| Param | Original file | Final file |
|---|---|---|
| Filename | modeM0/AS1A12_018T01_9000005874_43483cztM0_level2.fits | modeM0/AS1A12_018T01_9000005874_43483cztM0_level2_quad_clean.evt |
| Size (bytes) | 401,060,160 | 84,597,120 |
| Size | 382.5 MB | 80.7 MB |
| Events in quadrant A | 3,173,169 | 581,216 |
| Events in quadrant B | 2,864,949 | 589,829 |
| Events in quadrant C | 2,482,570 | 552,965 |
| Events in quadrant D | 5,909,528 | 463,072 |
| Mode M0 | |||
|---|---|---|---|
| Quadrant | BADHDUFLAG | Total packets | Discarded packets |
| A | 0 | 12853 | 1 |
| B | 0 | 12021 | 1 |
| C | 0 | 10780 | 2 |
| D | 0 | 21298 | 1 |
| Mode M9 | |||
|---|---|---|---|
| Quadrant | BADHDUFLAG | Total packets | Discarded packets |
| A | 0 | 16 | 0 |
| B | 0 | 16 | 0 |
| C | 0 | 16 | 0 |
| D | 0 | 16 | 0 |
| Mode SS | |||
|---|---|---|---|
| Quadrant | BADHDUFLAG | Total packets | Discarded packets |
| A | 0 | 108 | 0 |
| B | 0 | 108 | 0 |
| C | 0 | 108 | 0 |
| D | 0 | 108 | 0 |
| Quadrant | Total seconds | Saturated seconds | Saturation percentage |
|---|---|---|---|
| A | 5348 | 14 | 0.261780% |
| B | 5348 | 18 | 0.336574% |
| C | 5347 | 2 | 0.037404% |
| D | 5347 | 681 | 12.736114% |
Noise dominated data is calculated using 1-second bins in cleaned event files. If a bin has >2000 counts, and if more than 50% of those come from <1% of pixels, then it is considered to be noise-dominated and hence unusable.
| Quadrant | # 1 sec bins | Bins with >0 counts | Bins with >2000 counts | High rate bins dominated by noise | Noise dominated (total time) | Noise dominated (detector-on time) | Marked lightcurve |
|---|---|---|---|---|---|---|---|
| A | 6930 | 5349 | 6 | 6 | 0.09% | 0.11% | 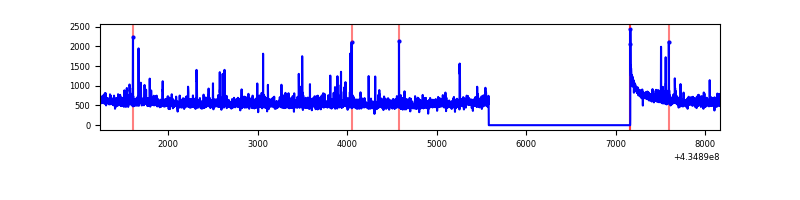 |
| B | 6930 | 5349 | 9 | 9 | 0.13% | 0.17% | 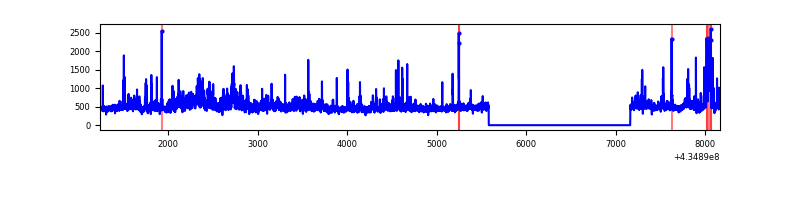 |
| C | 6929 | 5348 | 0 | 0 | 0.00% | 0.00% | 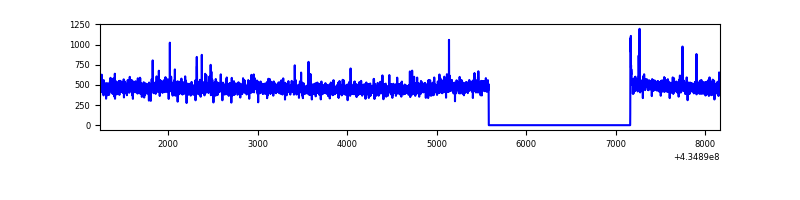 |
| D | 6929 | 5348 | 682 | 682 | 9.84% | 12.75% | 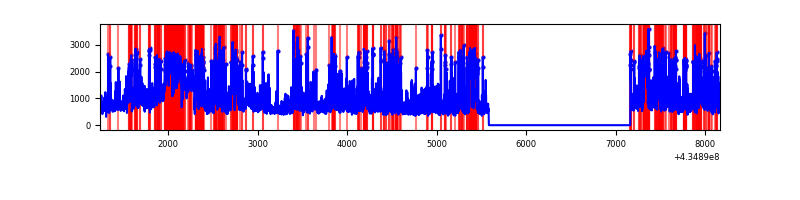 |
Top three noisy pixels from each quadrant. If the there are fewer than three noisy pixels in the level2.evt file, extra rows are filled as -1
| Pixel properties | Quadrant properties | ||||||
|---|---|---|---|---|---|---|---|
| Quadrant | DetID | PixID | Counts | Sigma | Mean | Median | Sigma |
| A | 10 | 83 | 571274 | 4829.14 | 571 | 559 | 118.2 |
| A | 15 | 222 | 342498 | 2893.34 | 571 | 559 | 118.2 |
| A | 15 | 237 | 33824 | 281.47 | 571 | 559 | 118.2 |
| B | 0 | 189 | 152843 | 1391.31 | 566 | 551 | 109.5 |
| B | 0 | 190 | 146434 | 1332.76 | 566 | 551 | 109.5 |
| B | 5 | 255 | 90169 | 818.73 | 566 | 551 | 109.5 |
| C | 15 | 214 | 219105 | 1691.88 | 554 | 556 | 129.2 |
| C | 3 | 233 | 80598 | 619.64 | 554 | 556 | 129.2 |
| C | 12 | 2 | 5978 | 41.97 | 554 | 556 | 129.2 |
| D | 1 | 52 | 1243390 | 9538.94 | 530 | 512 | 130.3 |
| D | 2 | 16 | 537566 | 4121.83 | 530 | 512 | 130.3 |
| D | 13 | 249 | 514819 | 3947.25 | 530 | 512 | 130.3 |
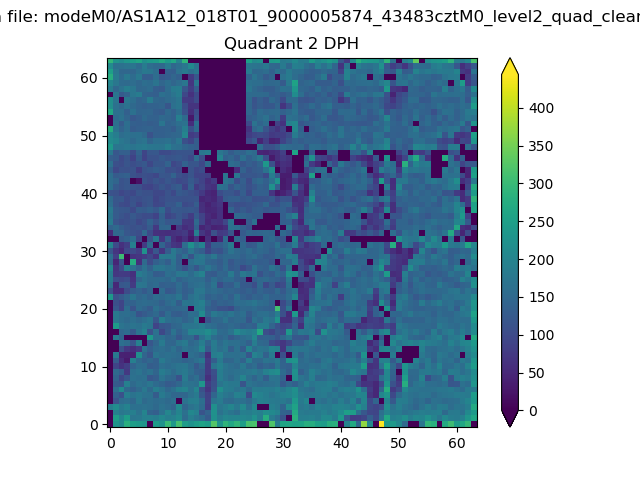
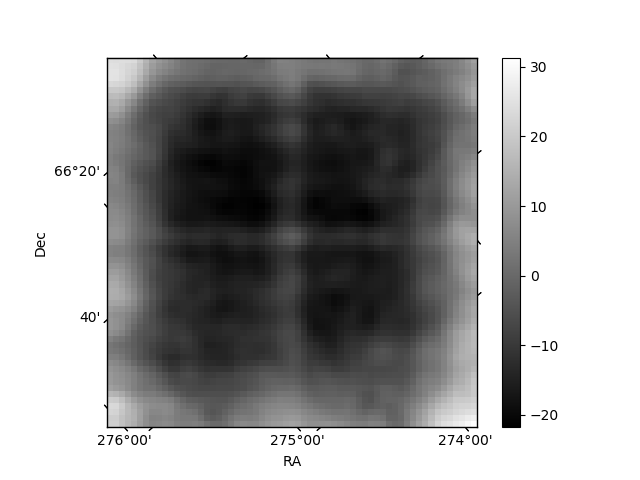
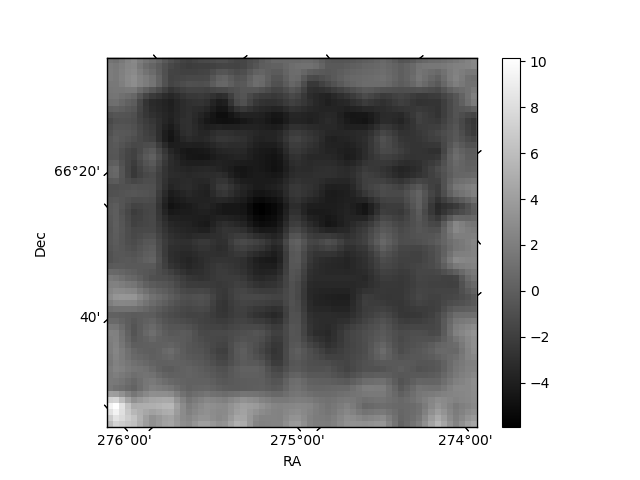
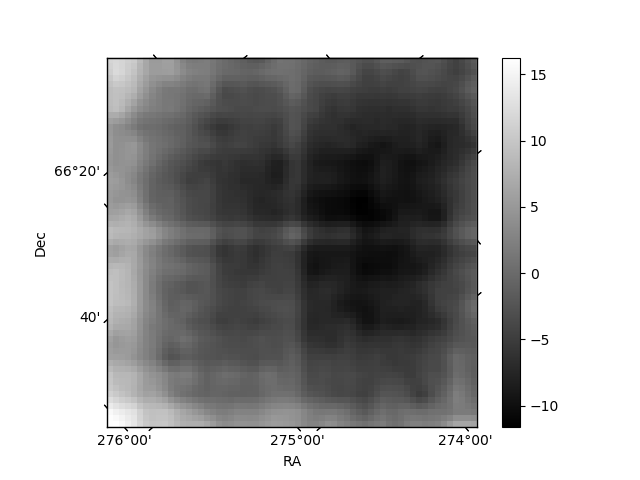
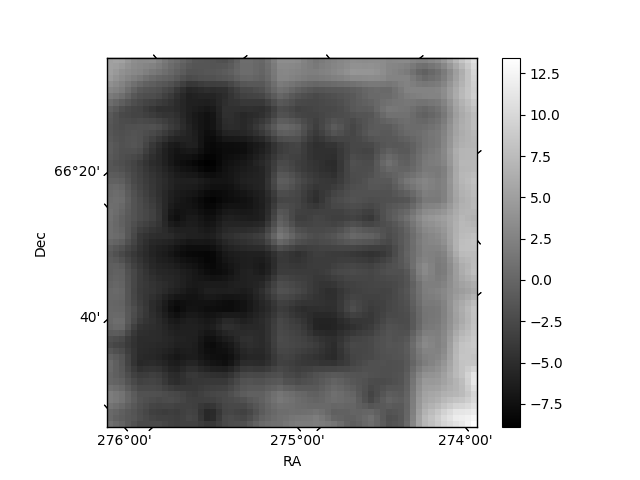
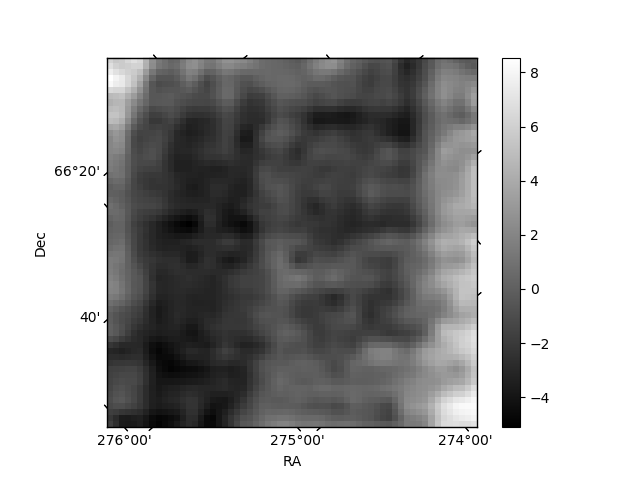
Histogram calculated using DETX and DETY for each event in the final _common_clean file
| Quadrant A | 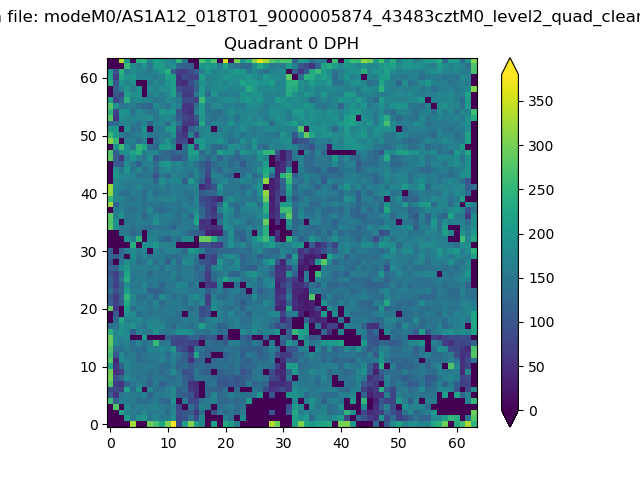 |
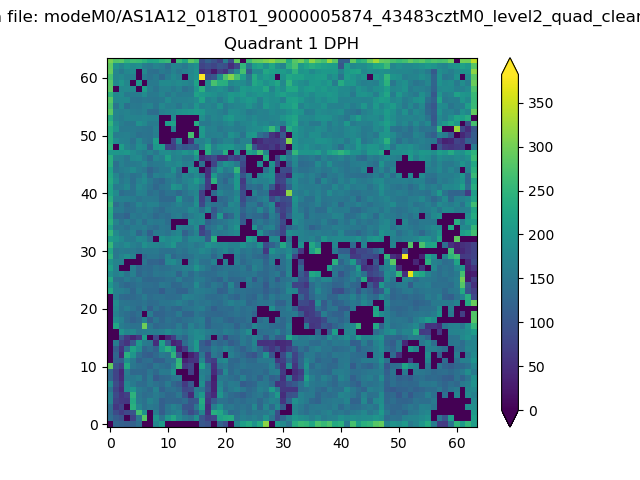 |
Quadrant B |
|---|---|---|---|
| Quadrant D | 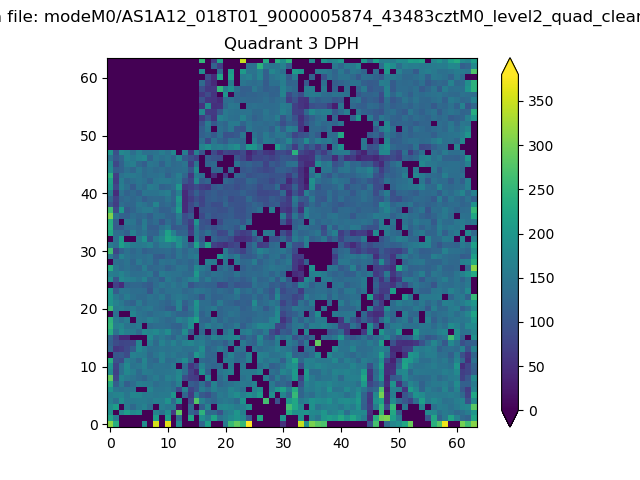 |
 |
Quadrant C |
| Plot type | Count rate plots | Images |
|---|---|---|
| Comparison with Poisson distribution Blue bars denote a histogram of data divided into 1 sec bins. Red curve is a Poisson curve with rate = median count rate of data. |
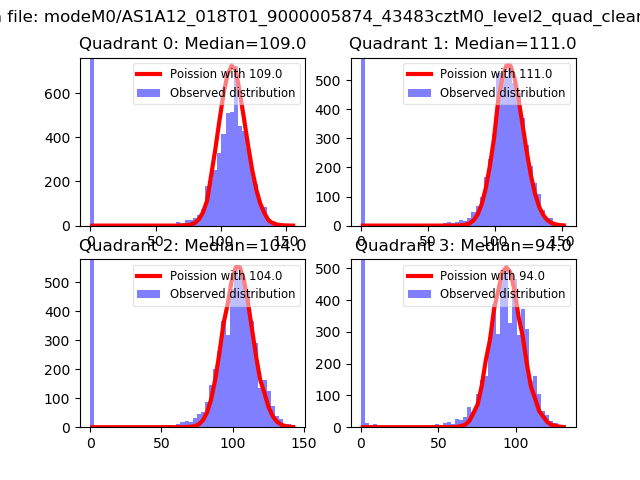 |
 |
| Quadrant-wise count rates Data is divided into 100 sec bins |
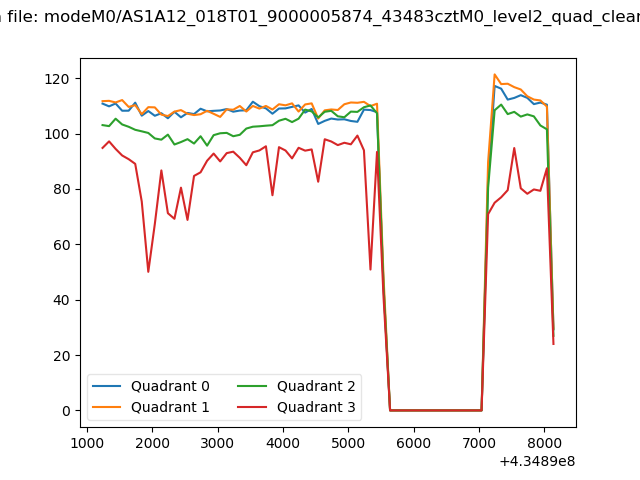 |
|
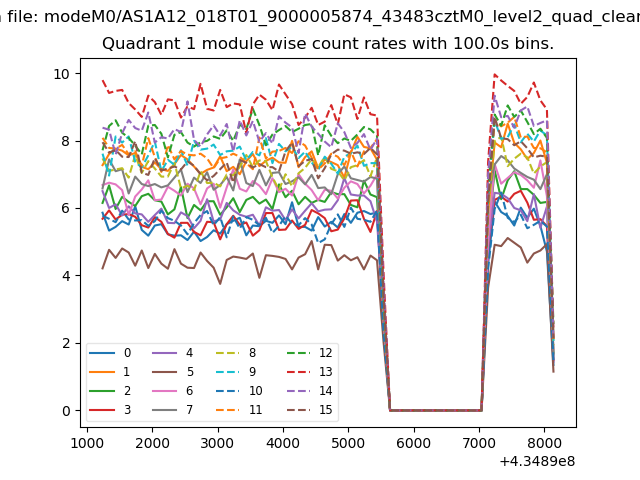
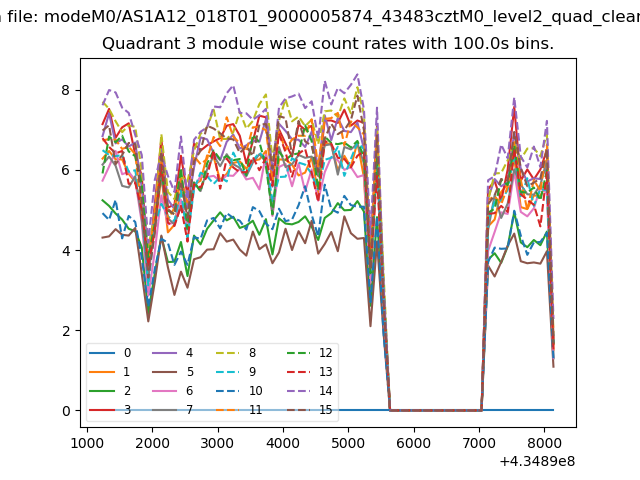
| Module-wise count rates for Quadrant A Data is divided into 100 sec bins |
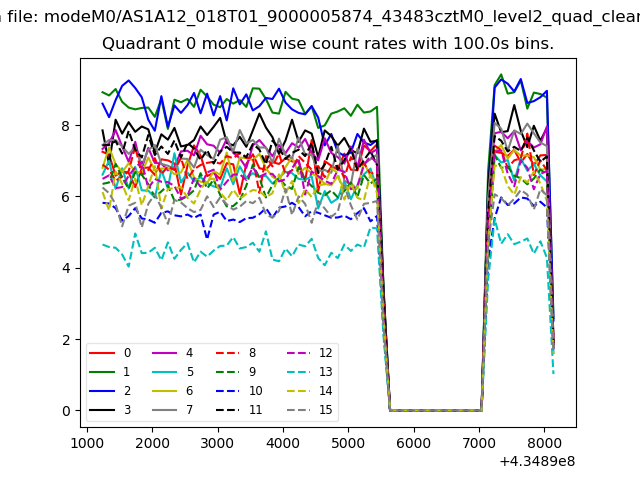 |
 |
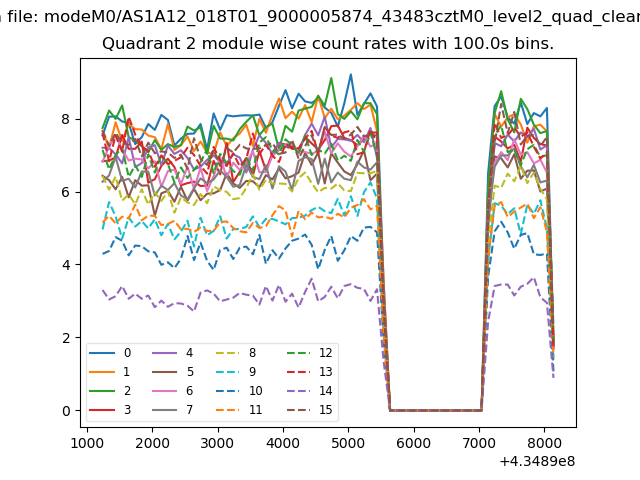
| Module-wise count rates for Quadrant B Data is divided into 100 sec bins |
 |
 |
| Module-wise count rates for Quadrant C Data is divided into 100 sec bins |
 |
 |
| Module-wise count rates for Quadrant D Data is divided into 100 sec bins |
 |
 |
| Parameter | Plot |
|---|---|
| CZT HV Monitor | 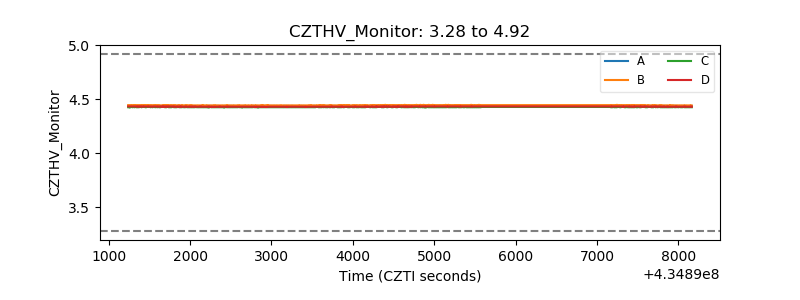 |
| D_VDD | 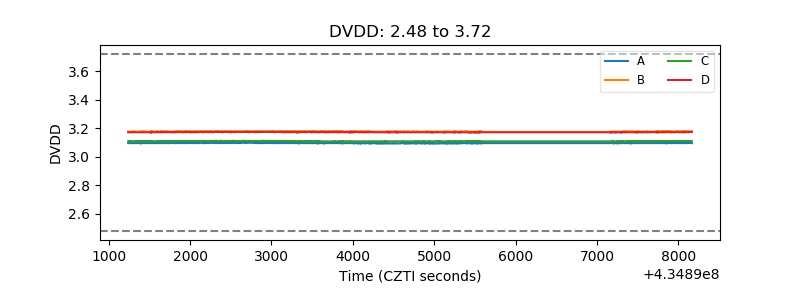 |
| Temperature 1 | 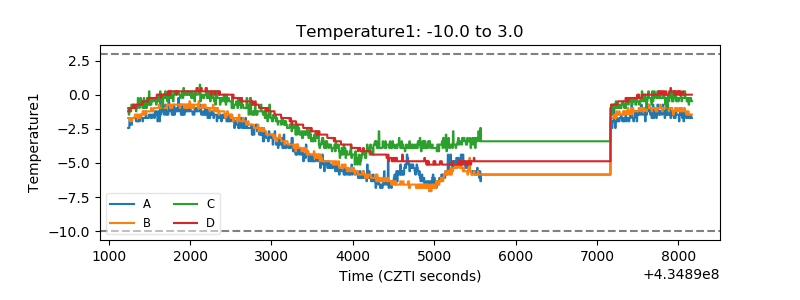 |
| Veto HV Monitor | 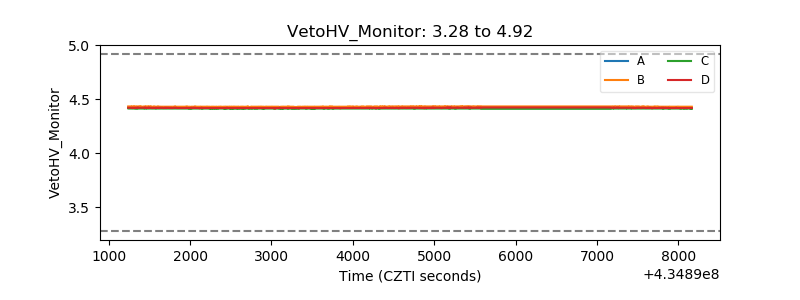 |
| Veto LLD | 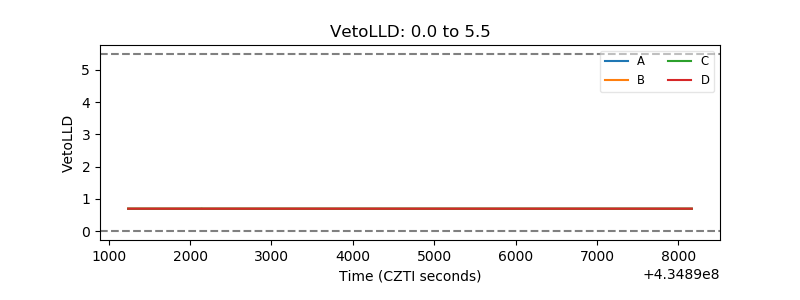 |
| Alpha Counter | 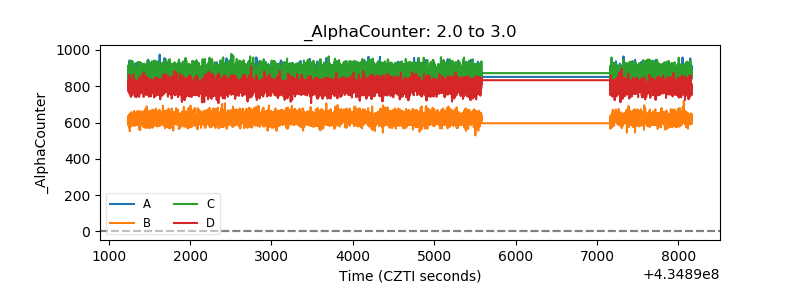 |
| _CPM_Rate | 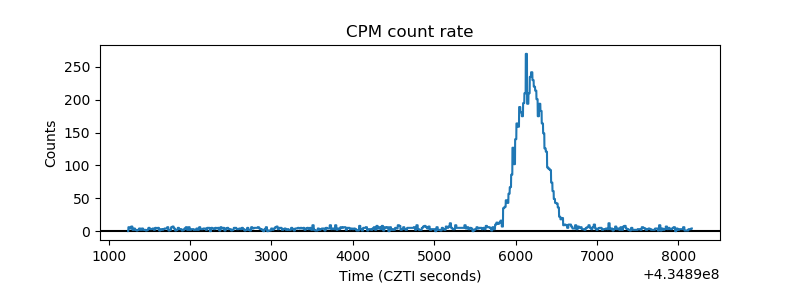 |
| CZT Counter | 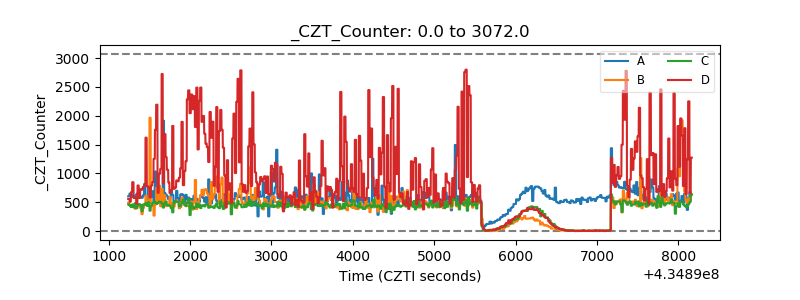 |
| +2.5 Volts monitor | 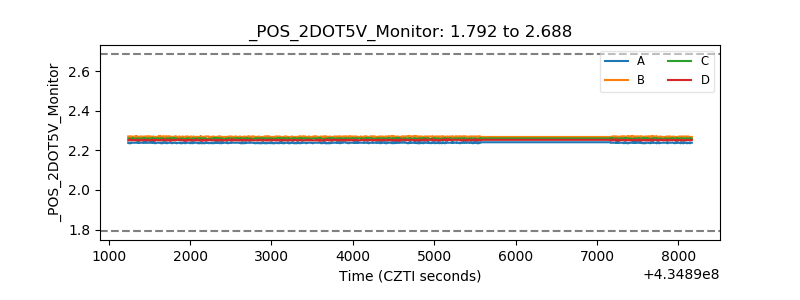 |
| +5 Volts monitor | 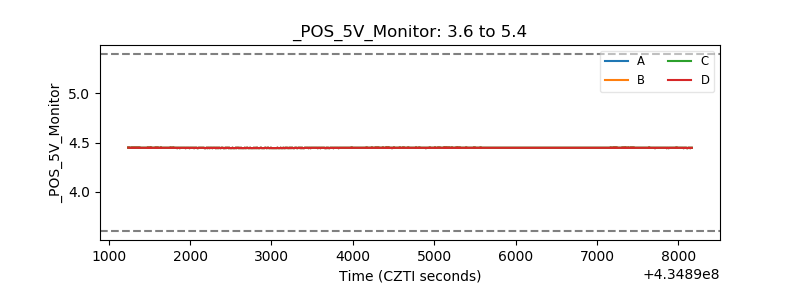 |
| _ROLL_ROT | 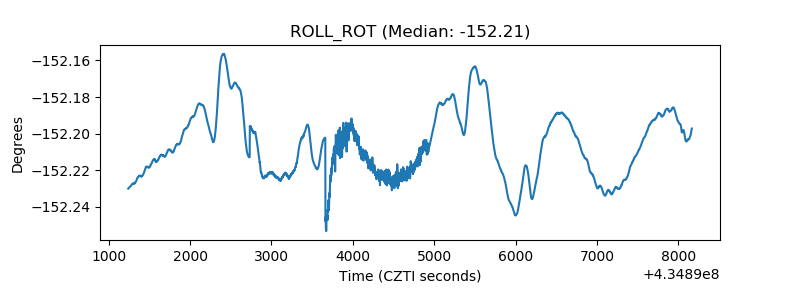 |
| _Roll_DEC |  |
| _Roll_RA | 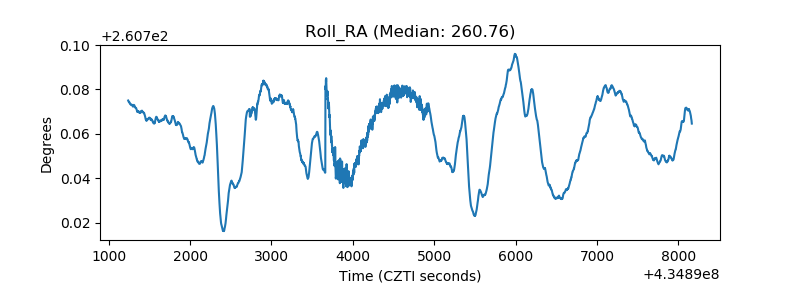 |
| Veto Counter | 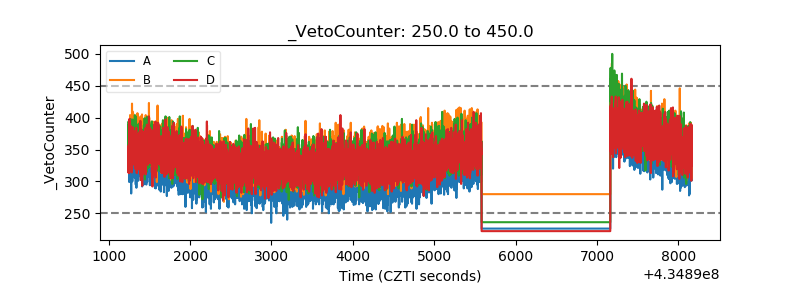 |