| Param | Original file | Final file |
|---|---|---|
| Filename | modeM0/AS1A12_018T01_9000005874_43484cztM0_level2.fits | modeM0/AS1A12_018T01_9000005874_43484cztM0_level2_quad_clean.evt |
| Size (bytes) | 442,892,160 | 90,040,320 |
| Size | 422.4 MB | 85.9 MB |
| Events in quadrant A | 3,441,727 | 624,561 |
| Events in quadrant B | 3,030,039 | 632,086 |
| Events in quadrant C | 2,660,234 | 596,593 |
| Events in quadrant D | 6,821,607 | 475,473 |
| Mode M0 | |||
|---|---|---|---|
| Quadrant | BADHDUFLAG | Total packets | Discarded packets |
| A | 0 | 13854 | 2 |
| B | 0 | 12779 | 2 |
| C | 0 | 11539 | 2 |
| D | 0 | 24228 | 2 |
| Mode M9 | |||
|---|---|---|---|
| Quadrant | BADHDUFLAG | Total packets | Discarded packets |
| A | 0 | 16 | 0 |
| B | 0 | 16 | 0 |
| C | 0 | 16 | 0 |
| D | 0 | 16 | 0 |
| Mode SS | |||
|---|---|---|---|
| Quadrant | BADHDUFLAG | Total packets | Discarded packets |
| A | 0 | 118 | 0 |
| B | 0 | 118 | 0 |
| C | 0 | 118 | 0 |
| D | 0 | 118 | 0 |
| Quadrant | Total seconds | Saturated seconds | Saturation percentage |
|---|---|---|---|
| A | 5673 | 19 | 0.334920% |
| B | 5673 | 34 | 0.599330% |
| C | 5674 | 3 | 0.052873% |
| D | 5673 | 1017 | 17.927023% |
Noise dominated data is calculated using 1-second bins in cleaned event files. If a bin has >2000 counts, and if more than 50% of those come from <1% of pixels, then it is considered to be noise-dominated and hence unusable.
| Quadrant | # 1 sec bins | Bins with >0 counts | Bins with >2000 counts | High rate bins dominated by noise | Noise dominated (total time) | Noise dominated (detector-on time) | Marked lightcurve |
|---|---|---|---|---|---|---|---|
| A | 7345 | 5674 | 5 | 5 | 0.07% | 0.09% | 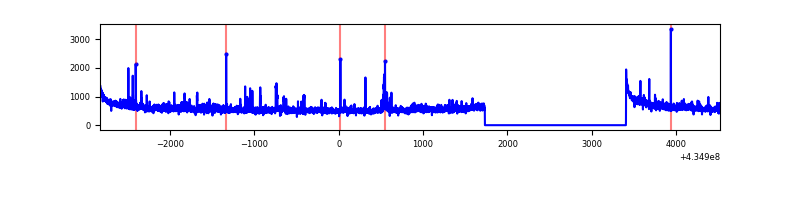 |
| B | 7345 | 5674 | 23 | 23 | 0.31% | 0.41% | 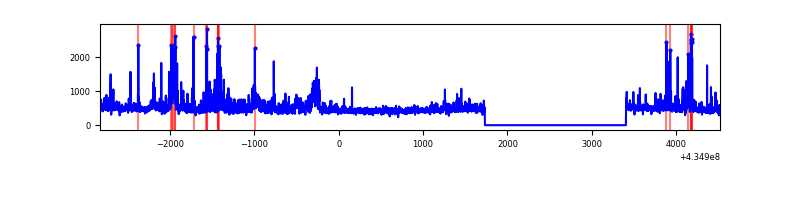 |
| C | 7346 | 5675 | 3 | 3 | 0.04% | 0.05% | 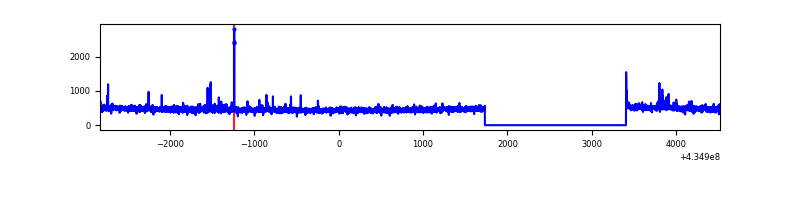 |
| D | 7345 | 5674 | 1005 | 1005 | 13.68% | 17.71% | 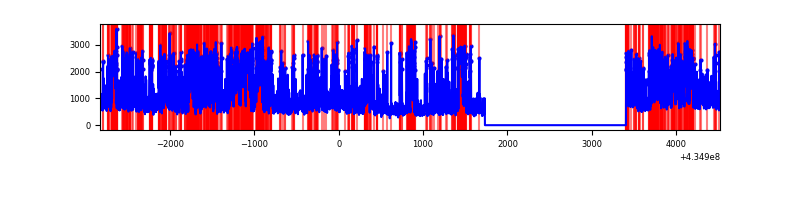 |
Top three noisy pixels from each quadrant. If the there are fewer than three noisy pixels in the level2.evt file, extra rows are filled as -1
| Pixel properties | Quadrant properties | ||||||
|---|---|---|---|---|---|---|---|
| Quadrant | DetID | PixID | Counts | Sigma | Mean | Median | Sigma |
| A | 10 | 83 | 668403 | 5342.73 | 608 | 596 | 125.0 |
| A | 15 | 222 | 317689 | 2536.87 | 608 | 596 | 125.0 |
| A | 15 | 237 | 56167 | 444.59 | 608 | 596 | 125.0 |
| B | 0 | 189 | 174846 | 1502.65 | 604 | 589 | 116.0 |
| B | 0 | 186 | 152712 | 1311.78 | 604 | 589 | 116.0 |
| B | 0 | 190 | 141113 | 1211.76 | 604 | 589 | 116.0 |
| C | 15 | 214 | 234516 | 1699.64 | 592 | 596 | 137.6 |
| C | 3 | 233 | 66960 | 482.2 | 592 | 596 | 137.6 |
| C | 0 | 239 | 18202 | 127.92 | 592 | 596 | 137.6 |
| D | 1 | 52 | 1744098 | 12853.93 | 549 | 532 | 135.6 |
| D | 1 | 47 | 1385372 | 10209.32 | 549 | 532 | 135.6 |
| D | 2 | 16 | 590145 | 4346.75 | 549 | 532 | 135.6 |
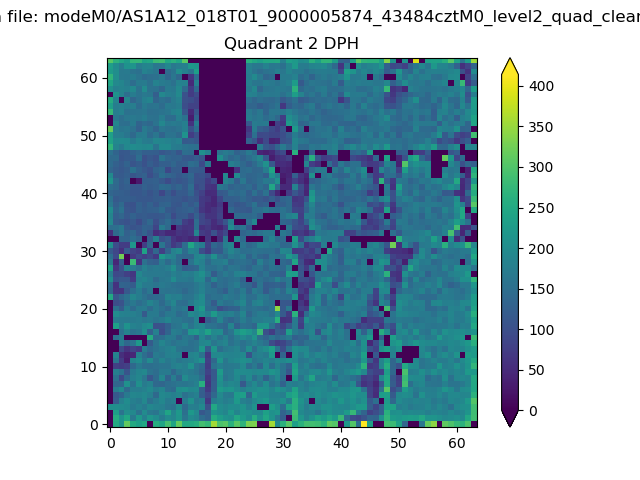
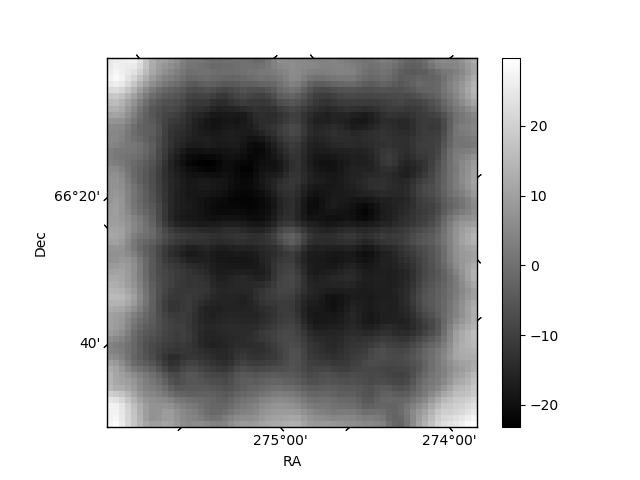
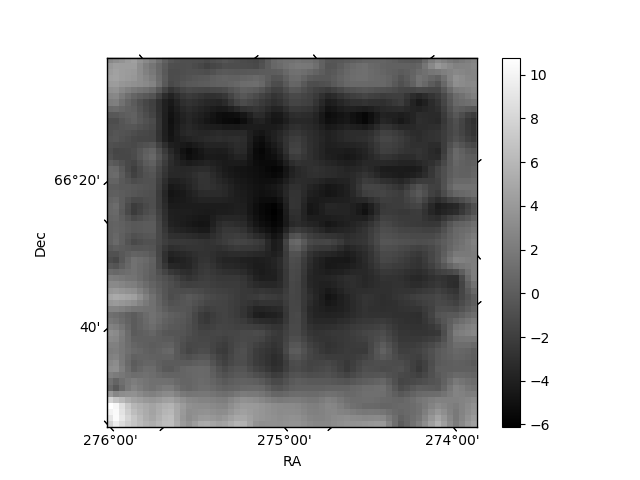
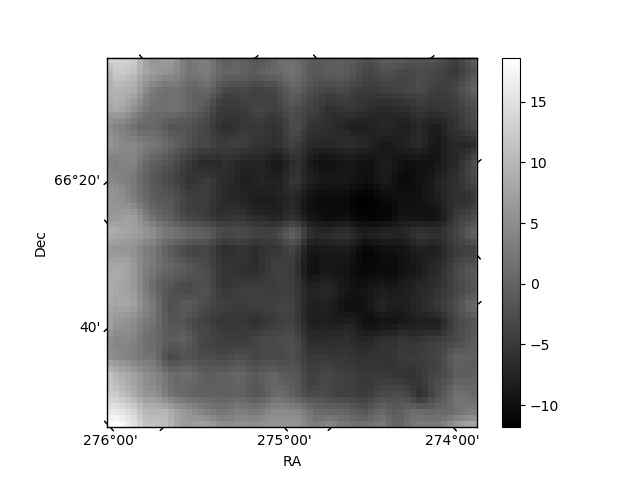
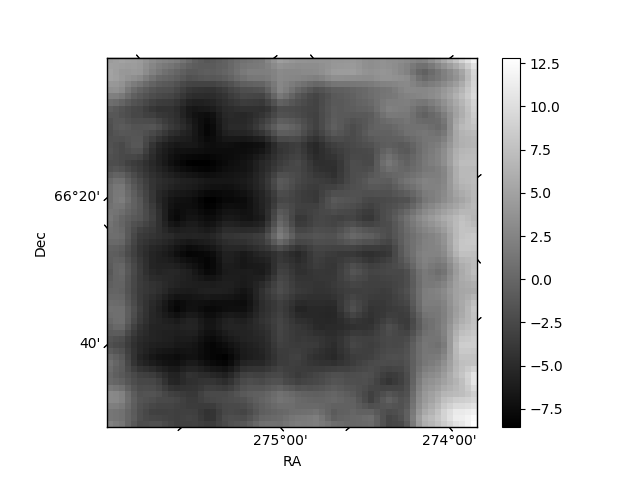
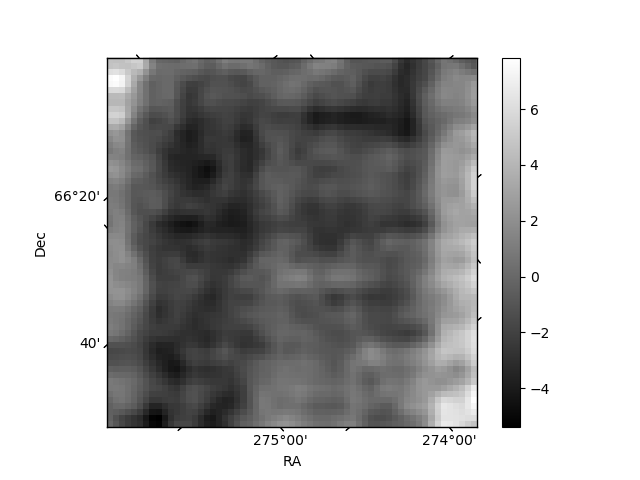
Histogram calculated using DETX and DETY for each event in the final _common_clean file
| Quadrant A | 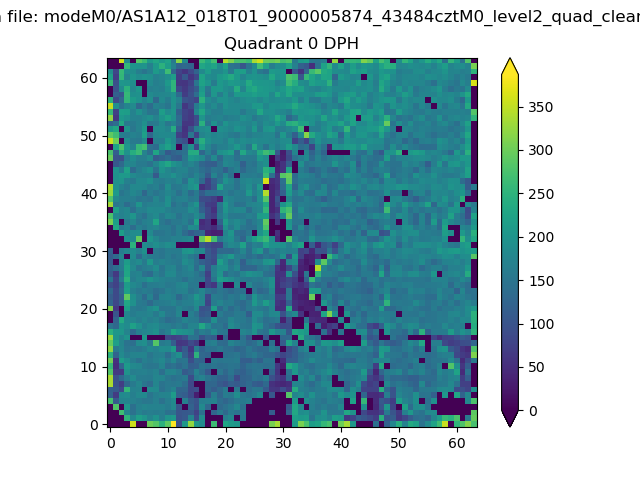 |
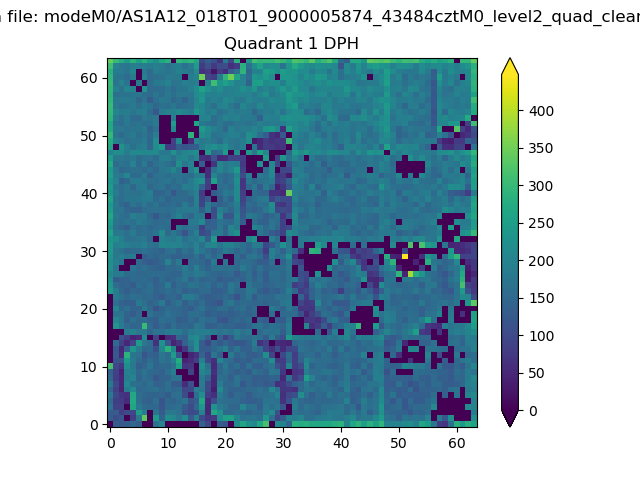 |
Quadrant B |
|---|---|---|---|
| Quadrant D | 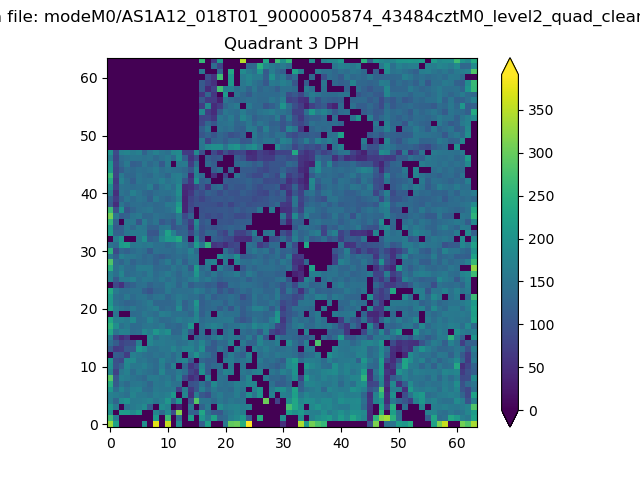 |
 |
Quadrant C |
| Plot type | Count rate plots | Images |
|---|---|---|
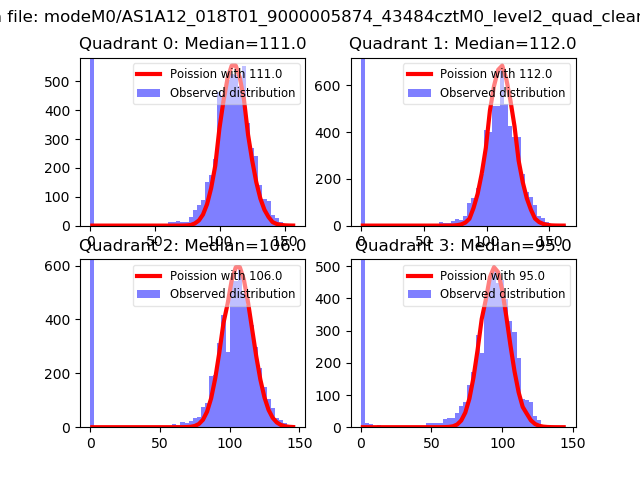
| Comparison with Poisson distribution Blue bars denote a histogram of data divided into 1 sec bins. Red curve is a Poisson curve with rate = median count rate of data. |
 |
 |
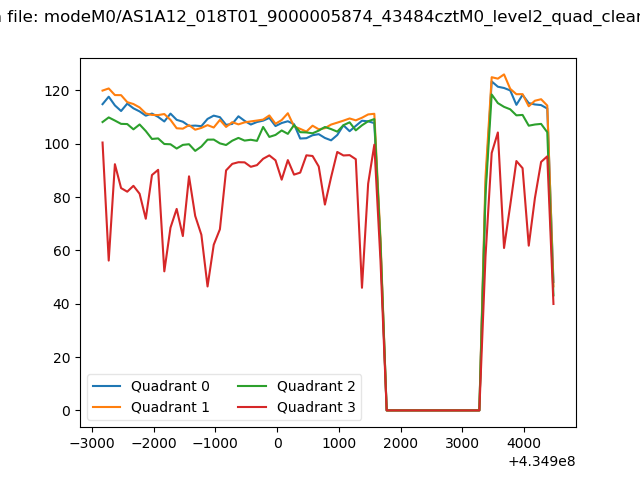
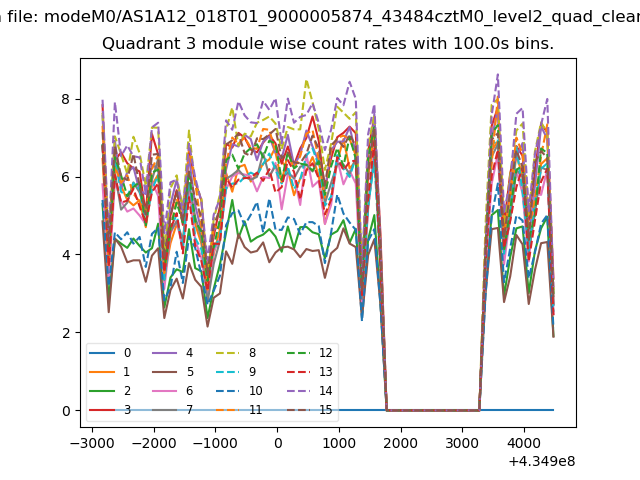
| Quadrant-wise count rates Data is divided into 100 sec bins |
 |
|
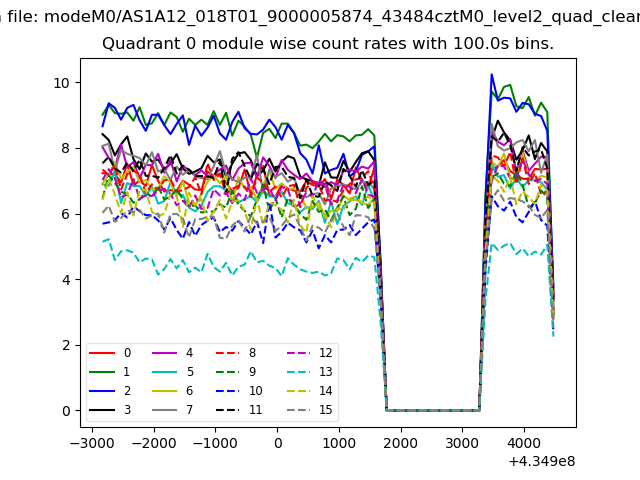
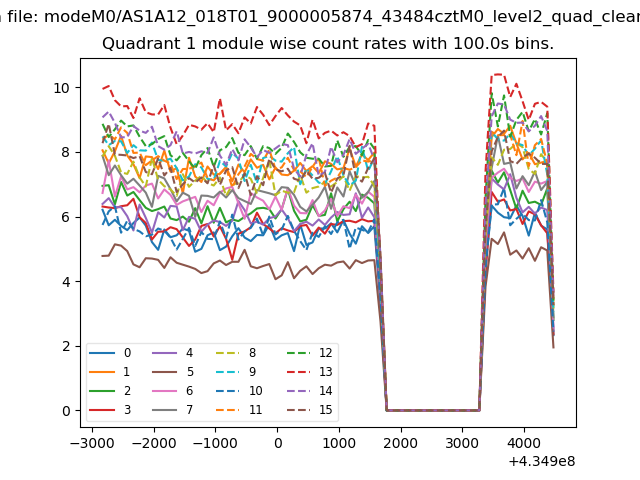
| Module-wise count rates for Quadrant A Data is divided into 100 sec bins |
 |
 |
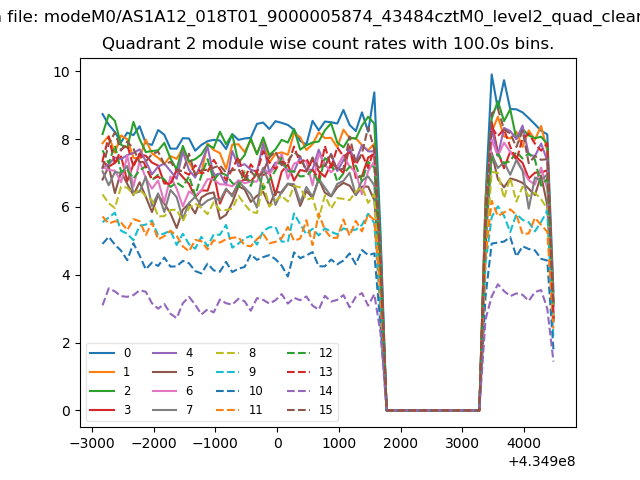
| Module-wise count rates for Quadrant B Data is divided into 100 sec bins |
 |
 |
| Module-wise count rates for Quadrant C Data is divided into 100 sec bins |
 |
 |
| Module-wise count rates for Quadrant D Data is divided into 100 sec bins |
 |
 |
| Parameter | Plot |
|---|---|
| CZT HV Monitor | 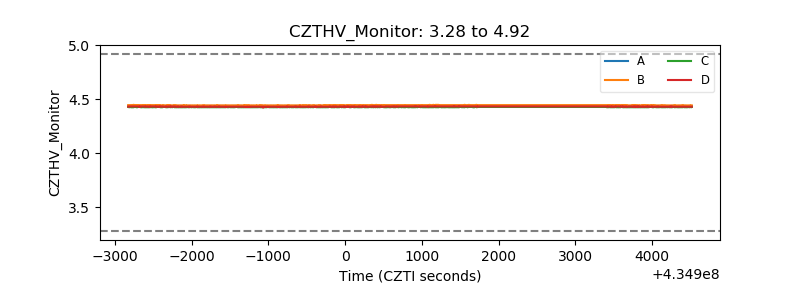 |
| D_VDD | 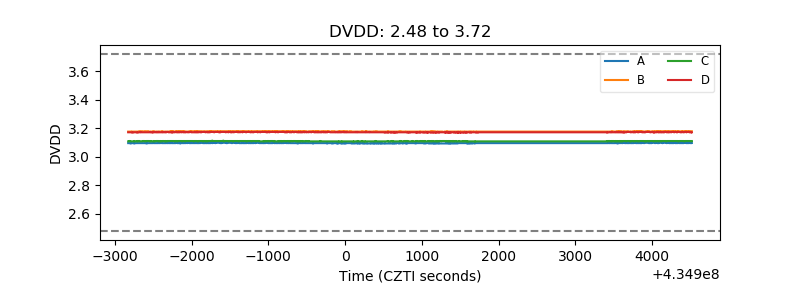 |
| Temperature 1 | 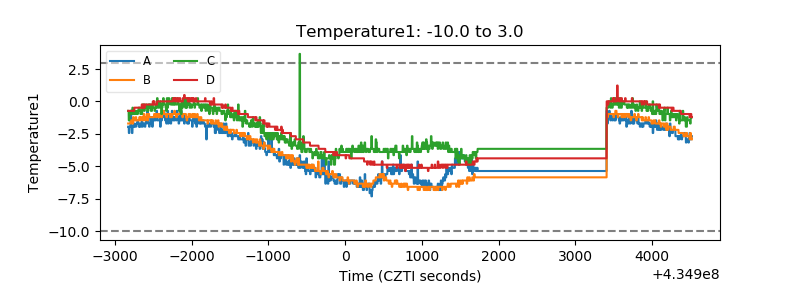 |
| Veto HV Monitor | 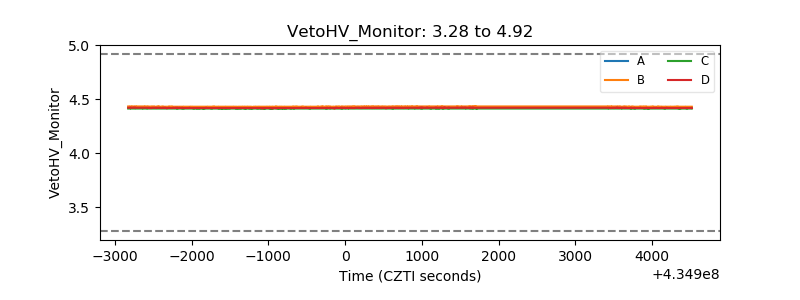 |
| Veto LLD | 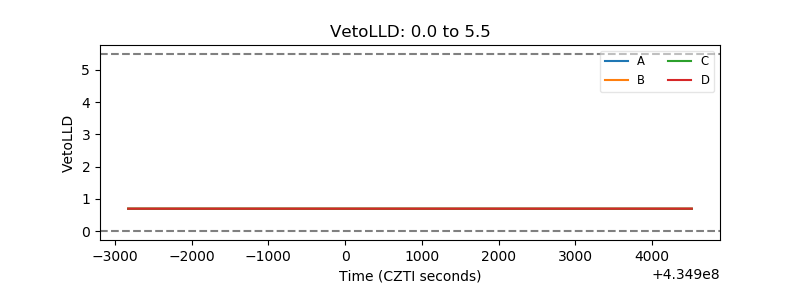 |
| Alpha Counter | 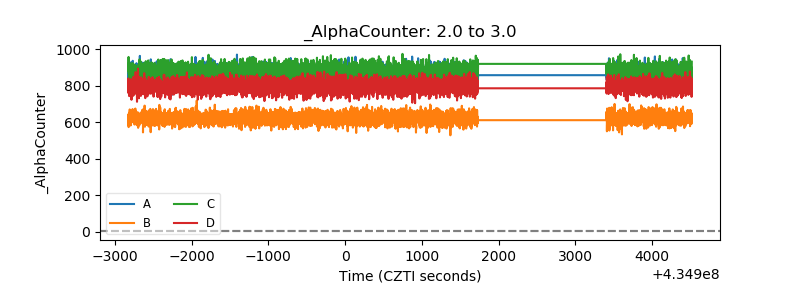 |
| _CPM_Rate | 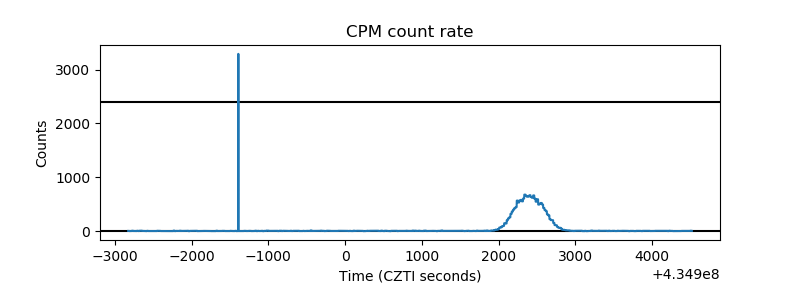 |
| CZT Counter | 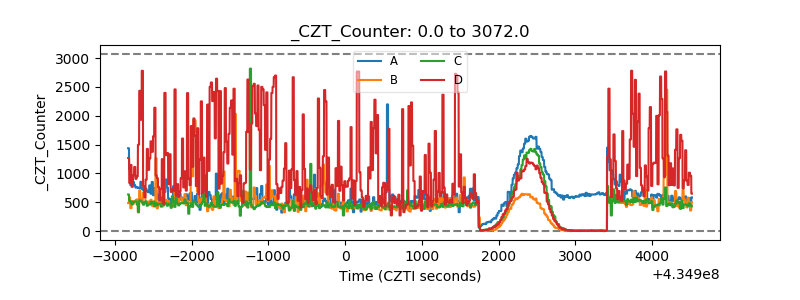 |
| +2.5 Volts monitor | 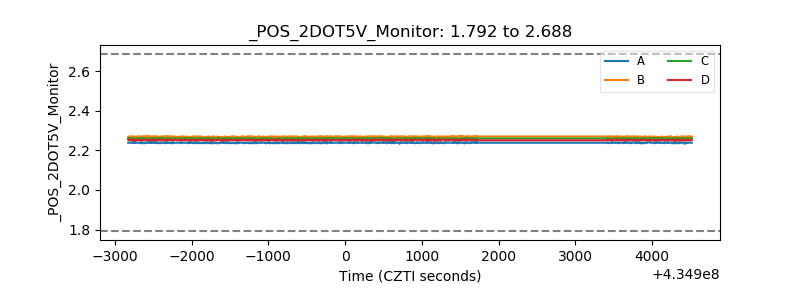 |
| +5 Volts monitor | 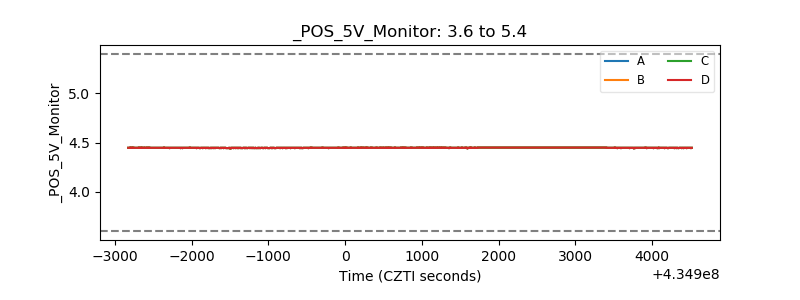 |
| _ROLL_ROT |  |
| _Roll_DEC | 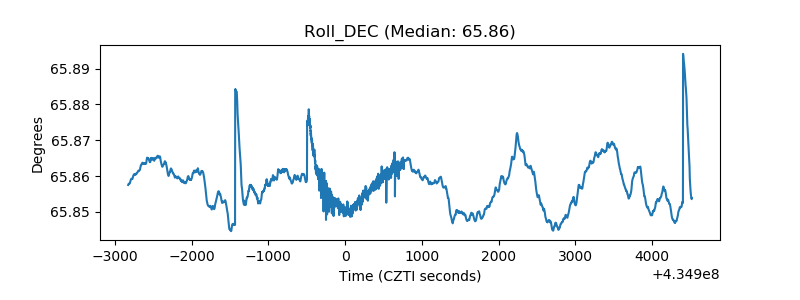 |
| _Roll_RA | 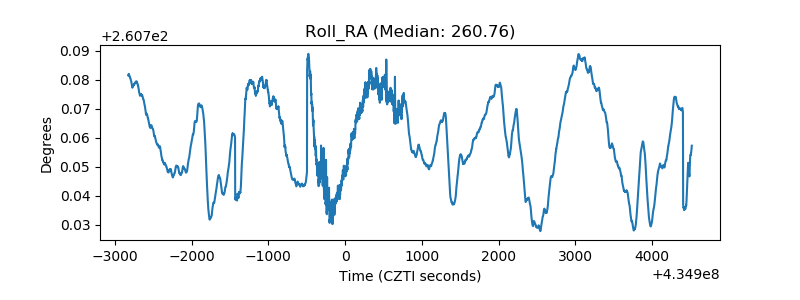 |
| Veto Counter |  |