| Param | Original file | Final file |
|---|---|---|
| Filename | modeM0/AS1A12_018T01_9000005874_43486cztM0_level2.fits | modeM0/AS1A12_018T01_9000005874_43486cztM0_level2_quad_clean.evt |
| Size (bytes) | 382,000,320 | 89,003,520 |
| Size | 364.3 MB | 84.9 MB |
| Events in quadrant A | 3,282,260 | 606,415 |
| Events in quadrant B | 2,882,908 | 614,913 |
| Events in quadrant C | 2,597,437 | 586,200 |
| Events in quadrant D | 4,959,806 | 510,960 |
| Mode M0 | |||
|---|---|---|---|
| Quadrant | BADHDUFLAG | Total packets | Discarded packets |
| A | 0 | 13277 | 2 |
| B | 0 | 12105 | 2 |
| C | 0 | 11097 | 2 |
| D | 0 | 18536 | 2 |
| Mode M9 | |||
|---|---|---|---|
| Quadrant | BADHDUFLAG | Total packets | Discarded packets |
| A | 0 | 21 | 0 |
| B | 0 | 22 | 0 |
| C | 0 | 22 | 0 |
| D | 0 | 22 | 0 |
| Mode SS | |||
|---|---|---|---|
| Quadrant | BADHDUFLAG | Total packets | Discarded packets |
| A | 0 | 110 | 0 |
| B | 0 | 110 | 0 |
| C | 0 | 110 | 0 |
| D | 0 | 110 | 0 |
| Quadrant | Total seconds | Saturated seconds | Saturation percentage |
|---|---|---|---|
| A | 5376 | 19 | 0.353423% |
| B | 5376 | 35 | 0.651042% |
| C | 5376 | 20 | 0.372024% |
| D | 5376 | 425 | 7.905506% |
Noise dominated data is calculated using 1-second bins in cleaned event files. If a bin has >2000 counts, and if more than 50% of those come from <1% of pixels, then it is considered to be noise-dominated and hence unusable.
| Quadrant | # 1 sec bins | Bins with >0 counts | Bins with >2000 counts | High rate bins dominated by noise | Noise dominated (total time) | Noise dominated (detector-on time) | Marked lightcurve |
|---|---|---|---|---|---|---|---|
| A | 7200 | 5377 | 5 | 5 | 0.07% | 0.09% | 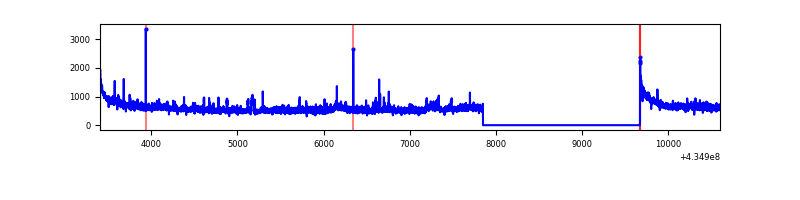 |
| B | 7200 | 5377 | 22 | 22 | 0.31% | 0.41% | 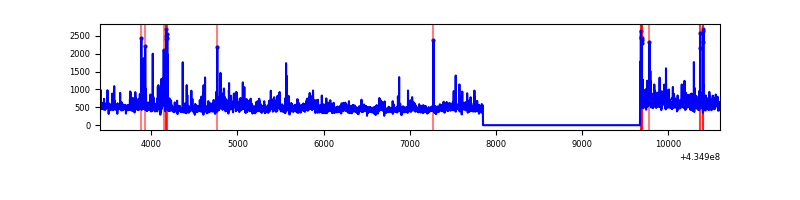 |
| C | 7200 | 5377 | 17 | 17 | 0.24% | 0.32% | 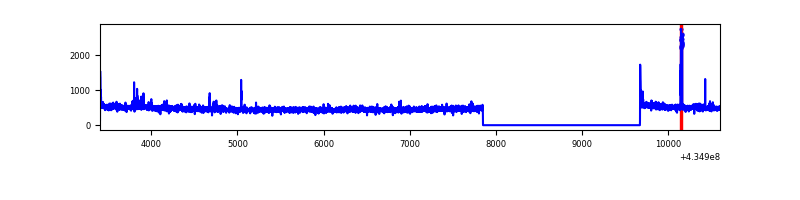 |
| D | 7200 | 5377 | 410 | 410 | 5.69% | 7.63% | 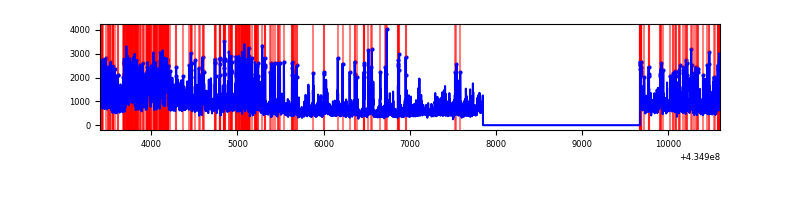 |
Top three noisy pixels from each quadrant. If the there are fewer than three noisy pixels in the level2.evt file, extra rows are filled as -1
| Pixel properties | Quadrant properties | ||||||
|---|---|---|---|---|---|---|---|
| Quadrant | DetID | PixID | Counts | Sigma | Mean | Median | Sigma |
| A | 10 | 83 | 647400 | 5420.71 | 580 | 568 | 119.3 |
| A | 15 | 222 | 261775 | 2189.02 | 580 | 568 | 119.3 |
| A | 15 | 237 | 118015 | 984.25 | 580 | 568 | 119.3 |
| B | 0 | 189 | 179550 | 1628.64 | 578 | 562 | 109.9 |
| B | 0 | 190 | 109082 | 987.44 | 578 | 562 | 109.9 |
| B | 0 | 186 | 86329 | 780.41 | 578 | 562 | 109.9 |
| C | 15 | 214 | 219991 | 1660.58 | 569 | 573 | 132.1 |
| C | 3 | 233 | 84675 | 636.49 | 569 | 573 | 132.1 |
| C | 12 | 249 | 49618 | 371.18 | 569 | 573 | 132.1 |
| D | 1 | 52 | 1224481 | 9073.65 | 551 | 535 | 134.9 |
| D | 2 | 16 | 688775 | 5102.23 | 551 | 535 | 134.9 |
| D | 1 | 47 | 245780 | 1818.11 | 551 | 535 | 134.9 |
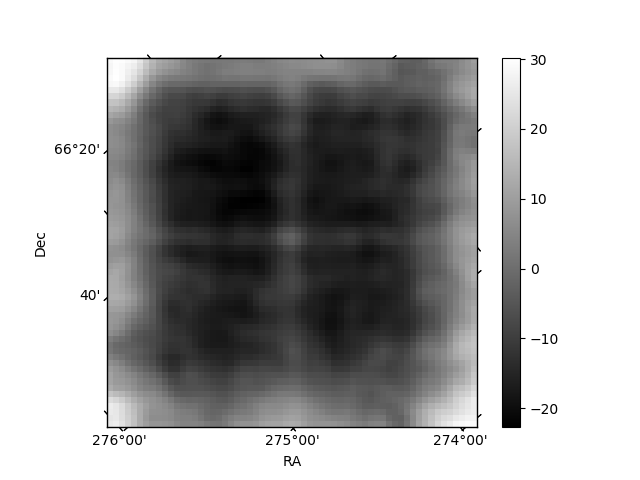
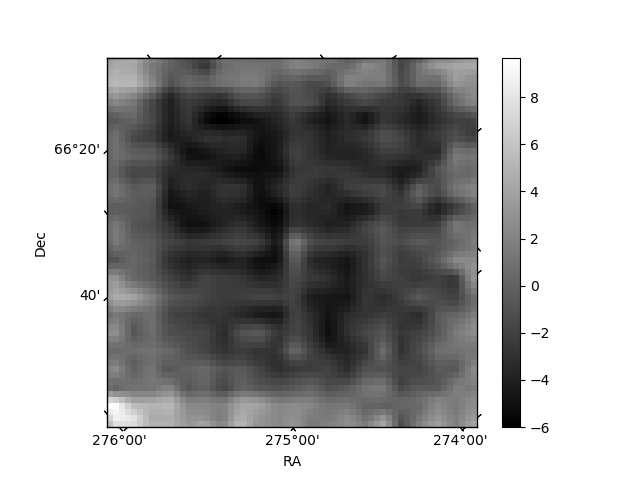
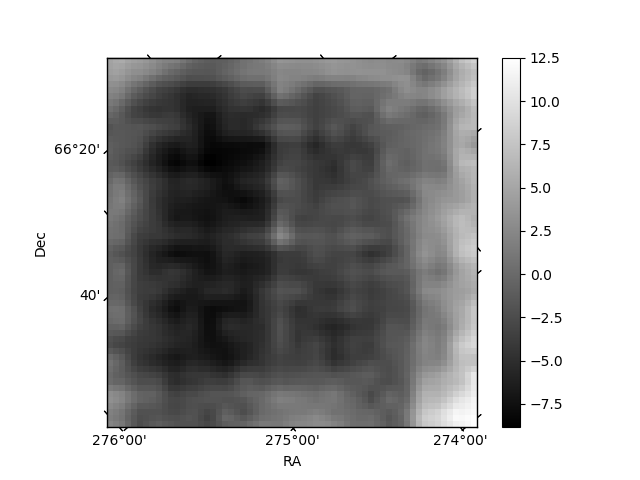
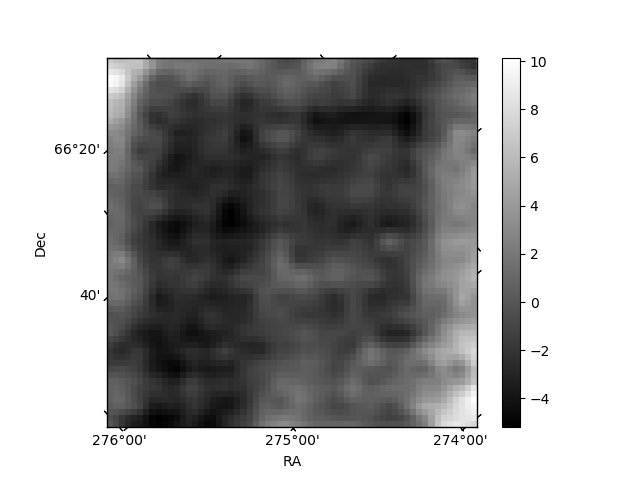
Histogram calculated using DETX and DETY for each event in the final _common_clean file
| Quadrant A | 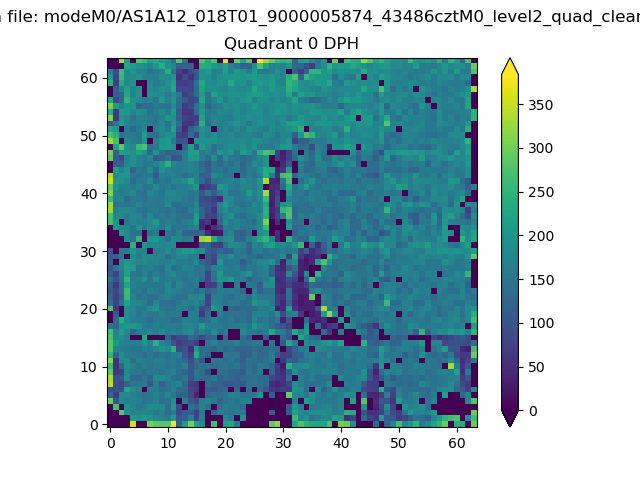 |
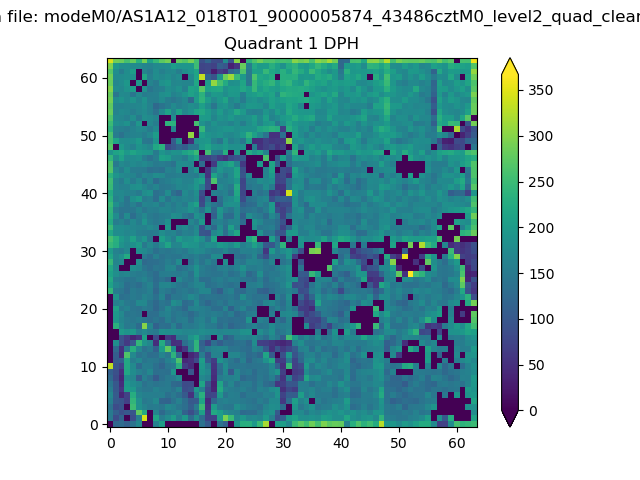 |
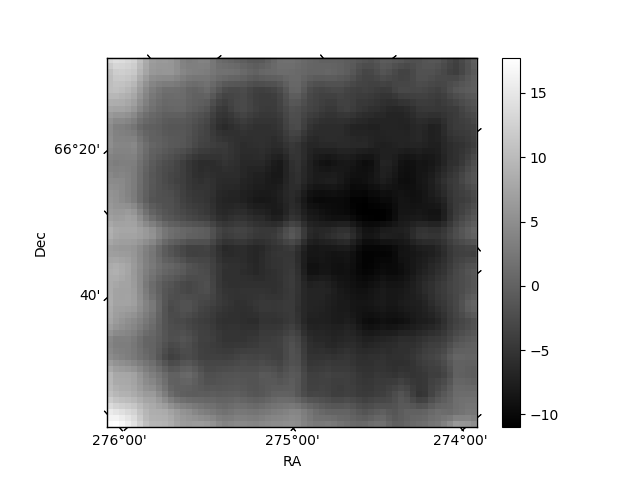
Quadrant B |
|---|---|---|---|
| Quadrant D | 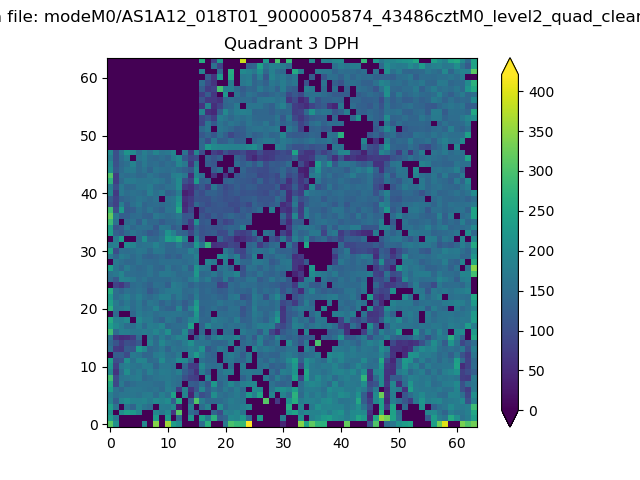 |
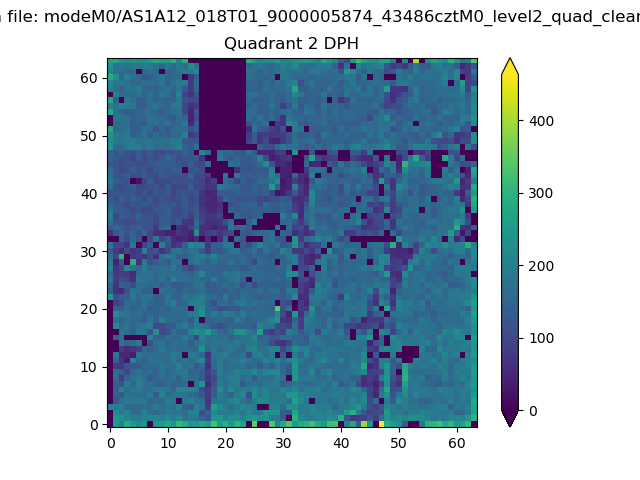 |
Quadrant C |
| Plot type | Count rate plots | Images |
|---|---|---|
| Comparison with Poisson distribution Blue bars denote a histogram of data divided into 1 sec bins. Red curve is a Poisson curve with rate = median count rate of data. |
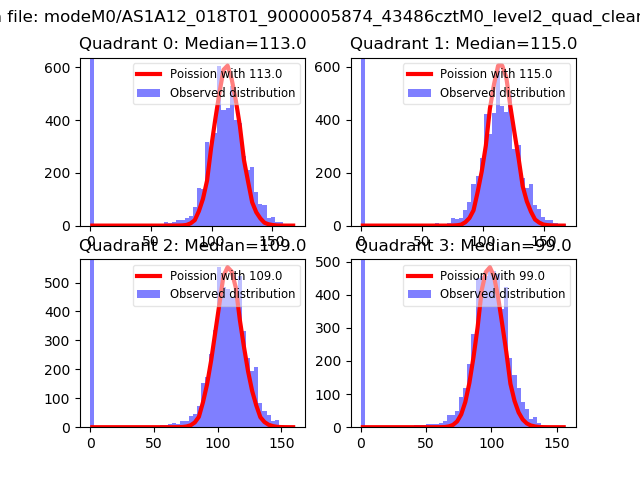 |
 |
| Quadrant-wise count rates Data is divided into 100 sec bins |
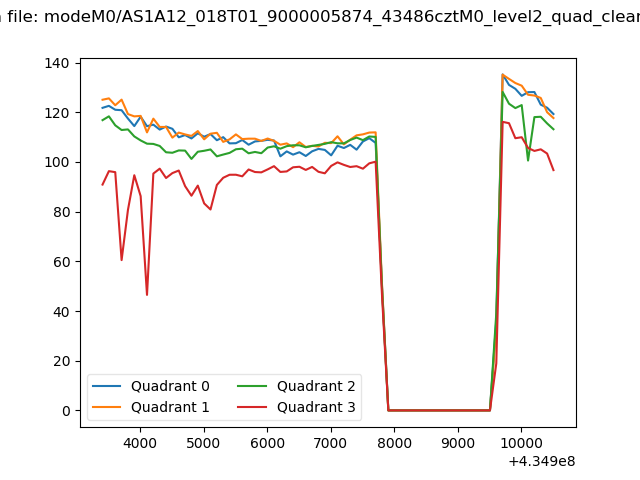 |
|
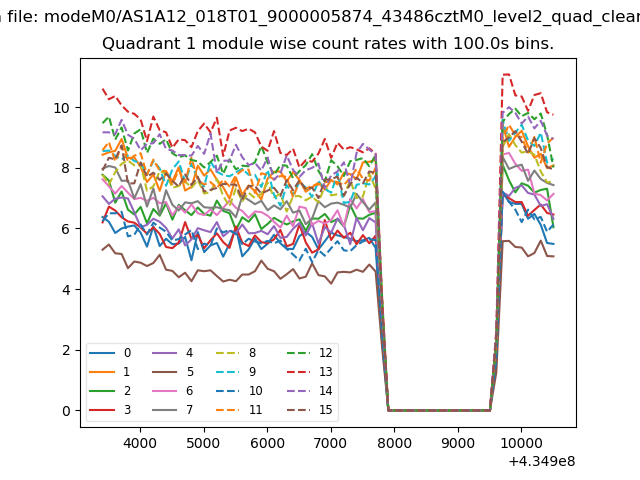
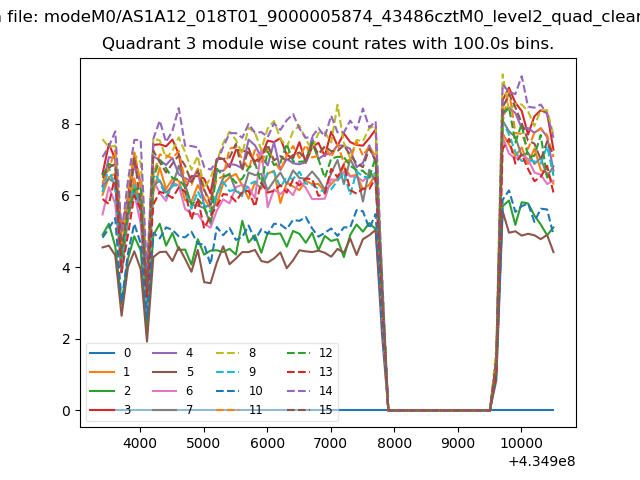
| Module-wise count rates for Quadrant A Data is divided into 100 sec bins |
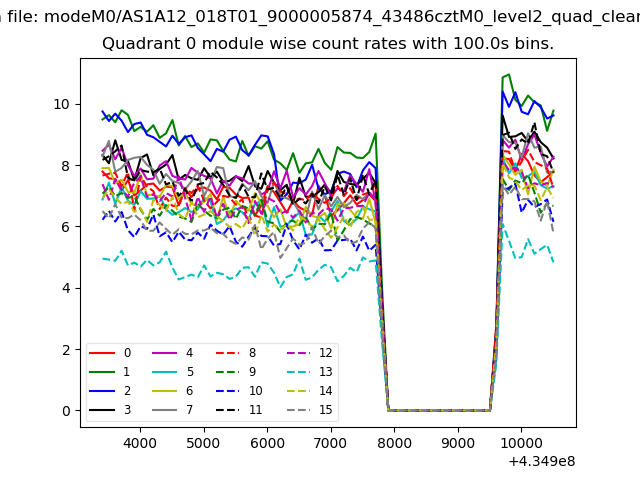 |
 |
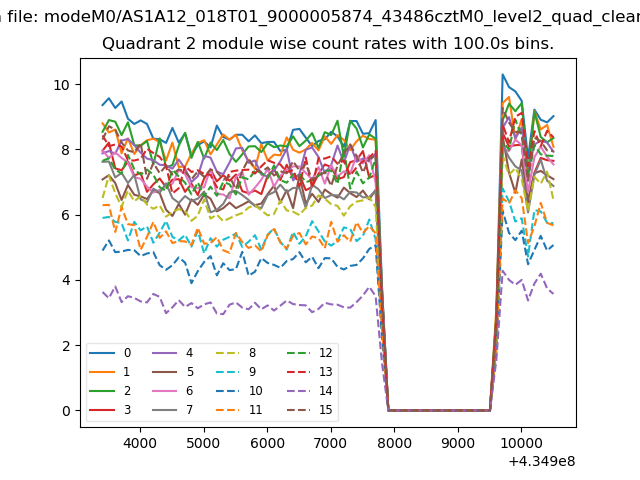
| Module-wise count rates for Quadrant B Data is divided into 100 sec bins |
 |
 |
| Module-wise count rates for Quadrant C Data is divided into 100 sec bins |
 |
 |
| Module-wise count rates for Quadrant D Data is divided into 100 sec bins |
 |
 |
| Parameter | Plot |
|---|---|
| CZT HV Monitor | 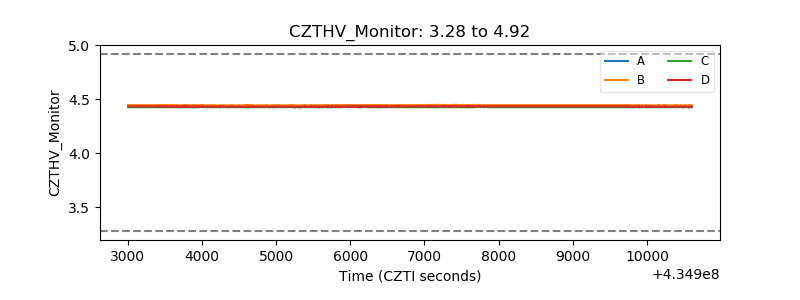 |
| D_VDD | 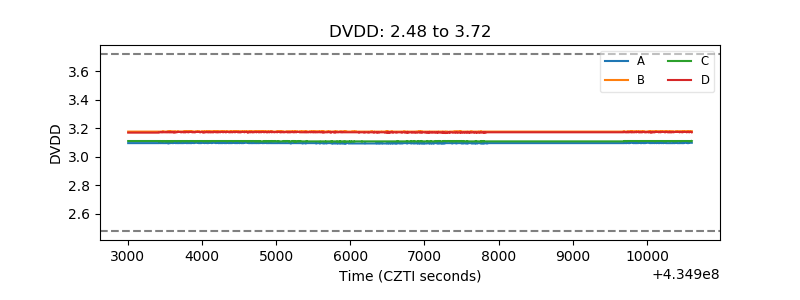 |
| Temperature 1 | 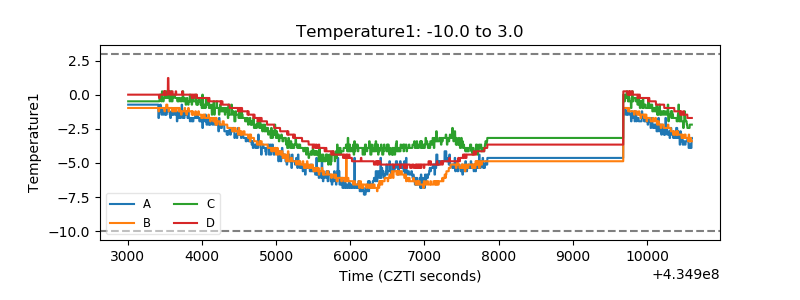 |
| Veto HV Monitor | 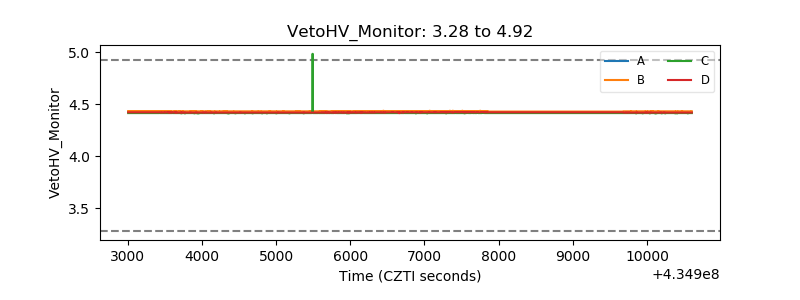 |
| Veto LLD | 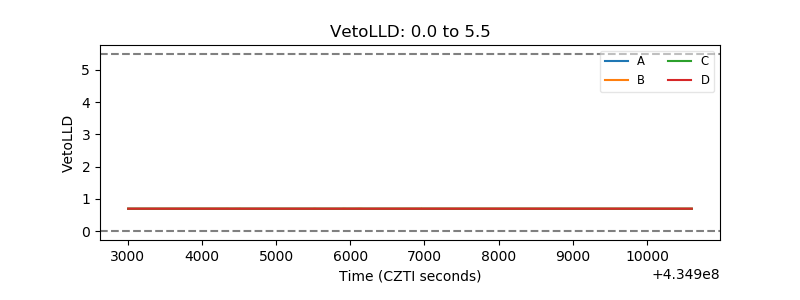 |
| Alpha Counter | 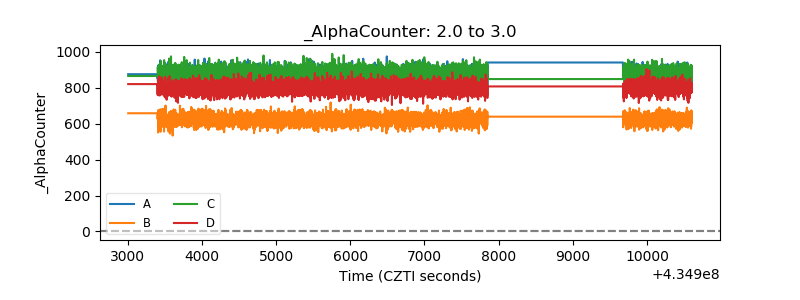 |
| _CPM_Rate | 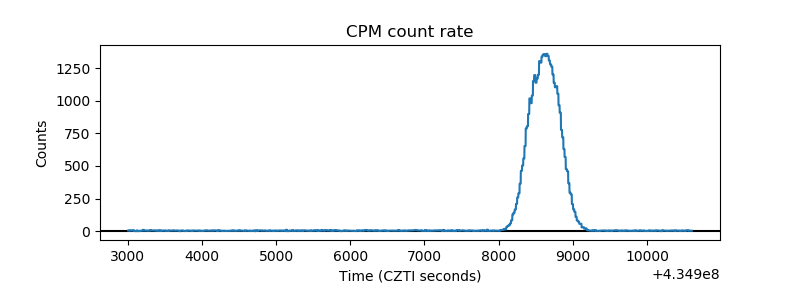 |
| CZT Counter | 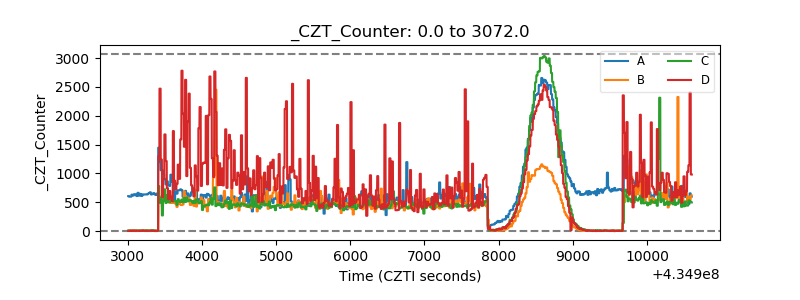 |
| +2.5 Volts monitor | 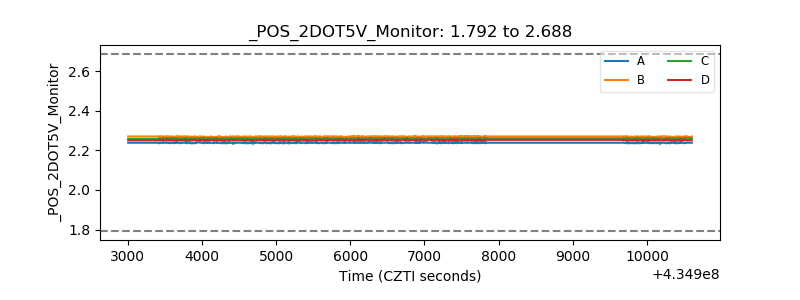 |
| +5 Volts monitor | 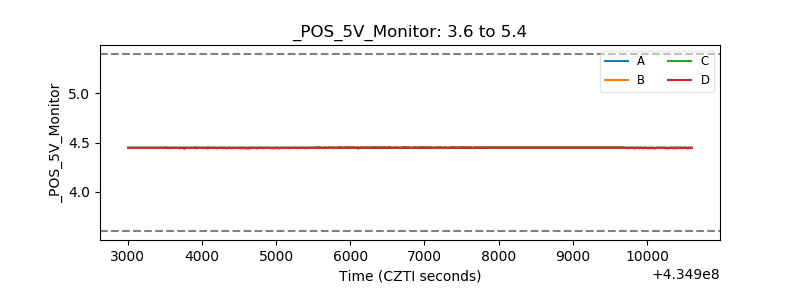 |
| _ROLL_ROT | 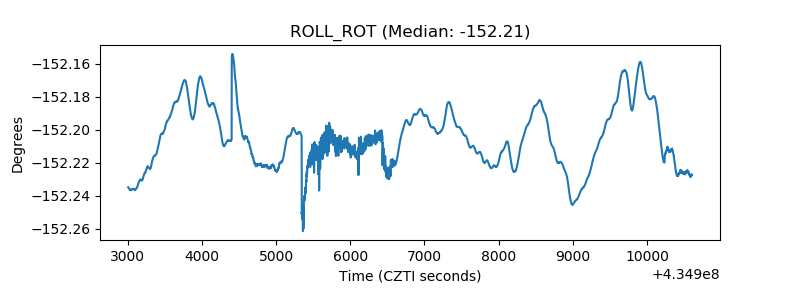 |
| _Roll_DEC | 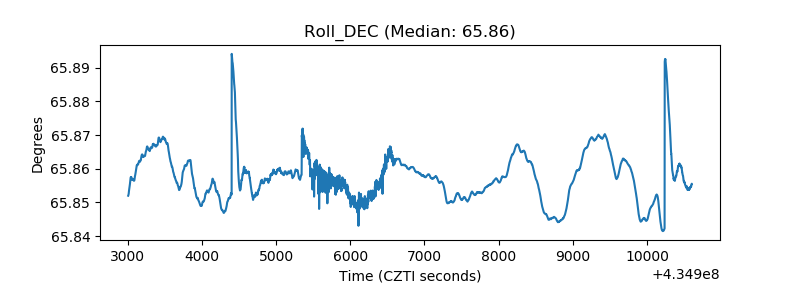 |
| _Roll_RA | 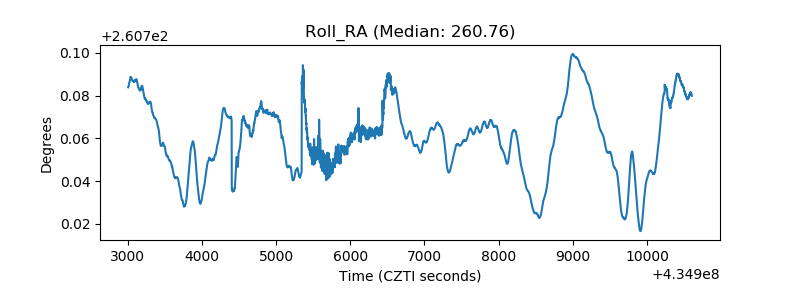 |
| Veto Counter | 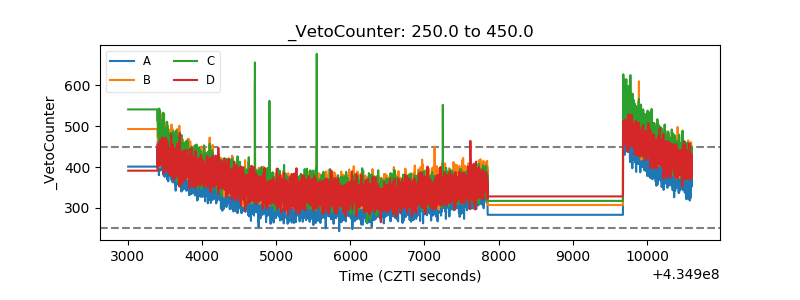 |