| Param | Original file | Final file |
|---|---|---|
| Filename | modeM0/AS1A12_018T01_9000005874_43487cztM0_level2.fits | modeM0/AS1A12_018T01_9000005874_43487cztM0_level2_quad_clean.evt |
| Size (bytes) | 367,171,200 | 85,832,640 |
| Size | 350.2 MB | 81.9 MB |
| Events in quadrant A | 3,107,920 | 585,414 |
| Events in quadrant B | 2,738,492 | 598,978 |
| Events in quadrant C | 2,454,430 | 575,211 |
| Events in quadrant D | 4,899,059 | 486,684 |
| Mode M0 | |||
|---|---|---|---|
| Quadrant | BADHDUFLAG | Total packets | Discarded packets |
| A | 0 | 12553 | 2 |
| B | 0 | 11575 | 2 |
| C | 0 | 10447 | 2 |
| D | 0 | 18061 | 2 |
| Mode M9 | |||
|---|---|---|---|
| Quadrant | BADHDUFLAG | Total packets | Discarded packets |
| A | 0 | 26 | 0 |
| B | 0 | 27 | 0 |
| C | 0 | 27 | 0 |
| D | 0 | 27 | 0 |
| Mode SS | |||
|---|---|---|---|
| Quadrant | BADHDUFLAG | Total packets | Discarded packets |
| A | 0 | 102 | 0 |
| B | 0 | 102 | 0 |
| C | 0 | 102 | 0 |
| D | 0 | 102 | 0 |
| Quadrant | Total seconds | Saturated seconds | Saturation percentage |
|---|---|---|---|
| A | 5032 | 24 | 0.476948% |
| B | 5032 | 46 | 0.914149% |
| C | 5032 | 19 | 0.377583% |
| D | 5032 | 555 | 11.029412% |
Noise dominated data is calculated using 1-second bins in cleaned event files. If a bin has >2000 counts, and if more than 50% of those come from <1% of pixels, then it is considered to be noise-dominated and hence unusable.
| Quadrant | # 1 sec bins | Bins with >0 counts | Bins with >2000 counts | High rate bins dominated by noise | Noise dominated (total time) | Noise dominated (detector-on time) | Marked lightcurve |
|---|---|---|---|---|---|---|---|
| A | 6976 | 5033 | 17 | 17 | 0.24% | 0.34% | 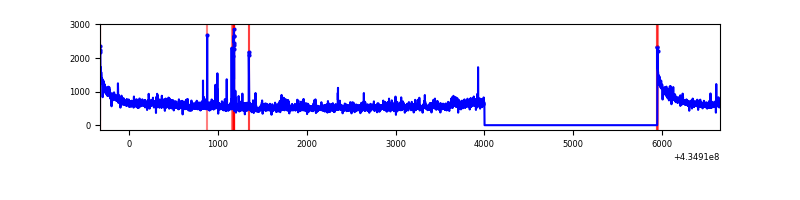 |
| B | 6976 | 5033 | 35 | 35 | 0.50% | 0.70% | 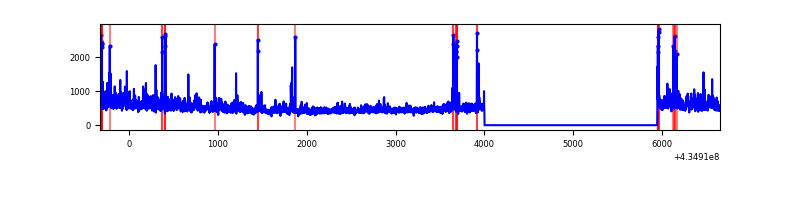 |
| C | 6976 | 5033 | 18 | 18 | 0.26% | 0.36% | 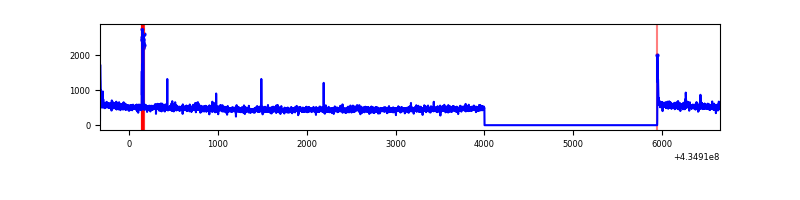 |
| D | 6976 | 5033 | 577 | 577 | 8.27% | 11.46% | 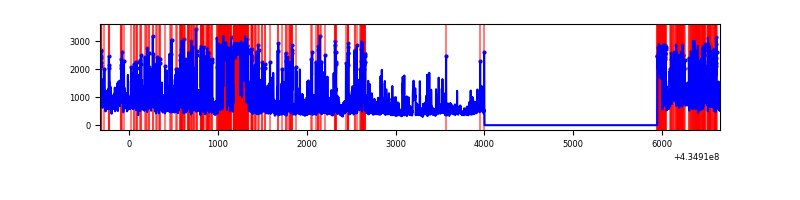 |
Top three noisy pixels from each quadrant. If the there are fewer than three noisy pixels in the level2.evt file, extra rows are filled as -1
| Pixel properties | Quadrant properties | ||||||
|---|---|---|---|---|---|---|---|
| Quadrant | DetID | PixID | Counts | Sigma | Mean | Median | Sigma |
| A | 10 | 83 | 612107 | 5478.51 | 548 | 538 | 111.6 |
| A | 15 | 222 | 254627 | 2276.16 | 548 | 538 | 111.6 |
| A | 15 | 237 | 99657 | 887.92 | 548 | 538 | 111.6 |
| B | 0 | 190 | 123894 | 1194.95 | 549 | 536 | 103.2 |
| B | 0 | 189 | 120622 | 1163.26 | 549 | 536 | 103.2 |
| B | 0 | 245 | 100256 | 965.97 | 549 | 536 | 103.2 |
| C | 15 | 214 | 207118 | 1640.86 | 545 | 549 | 125.9 |
| C | 3 | 233 | 59039 | 464.61 | 545 | 549 | 125.9 |
| C | 12 | 249 | 51038 | 401.05 | 545 | 549 | 125.9 |
| D | 1 | 52 | 1259065 | 9912.55 | 516 | 501 | 127.0 |
| D | 13 | 249 | 616857 | 4854.47 | 516 | 501 | 127.0 |
| D | 2 | 16 | 526091 | 4139.59 | 516 | 501 | 127.0 |
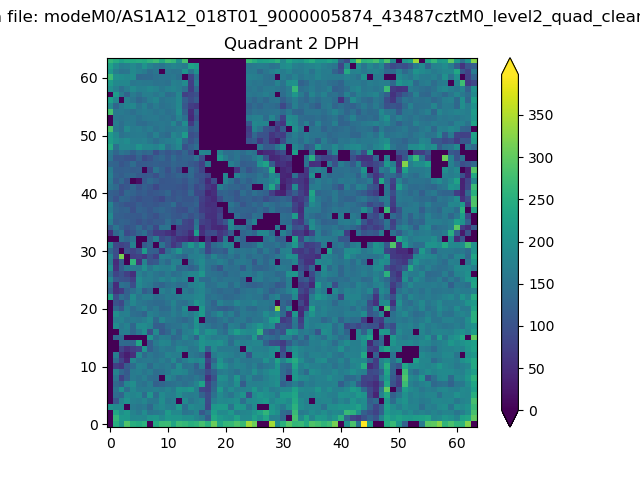
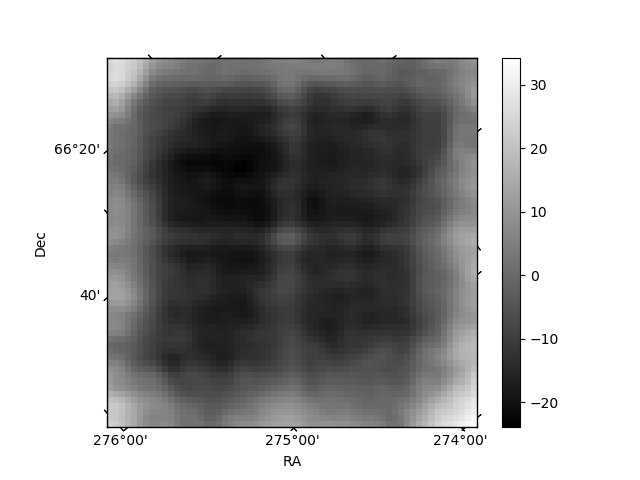
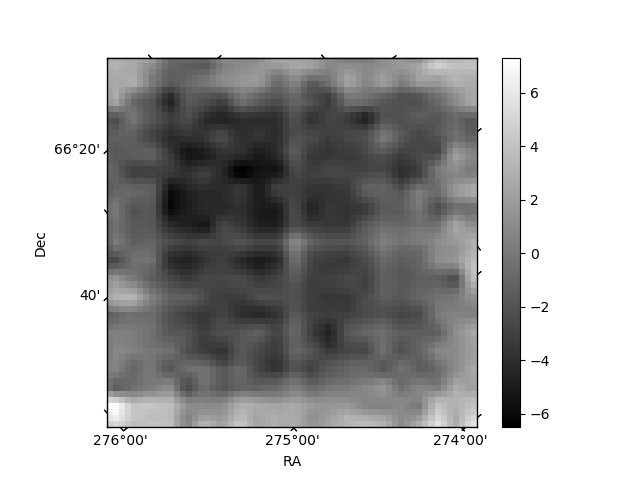
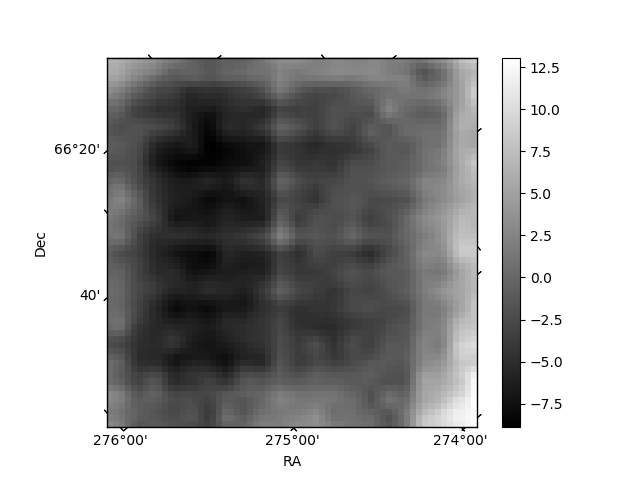
Histogram calculated using DETX and DETY for each event in the final _common_clean file
| Quadrant A | 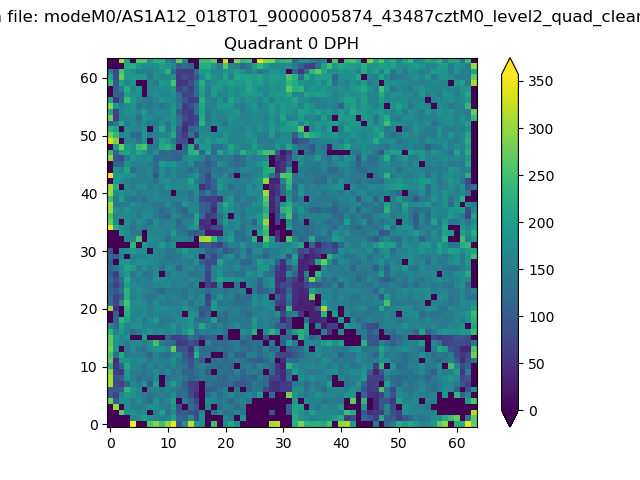 |
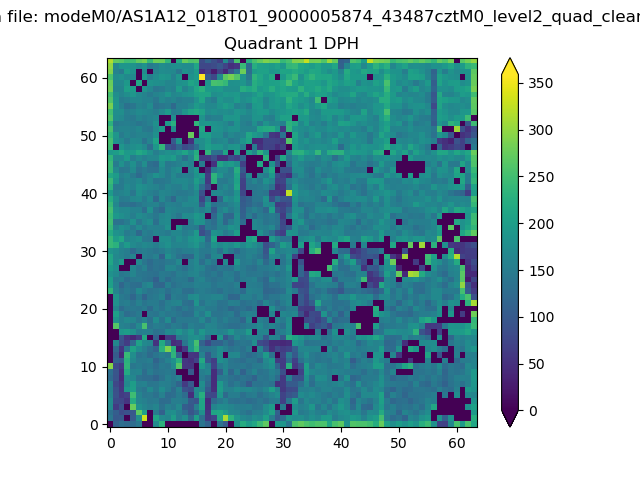 |
Quadrant B |
|---|---|---|---|
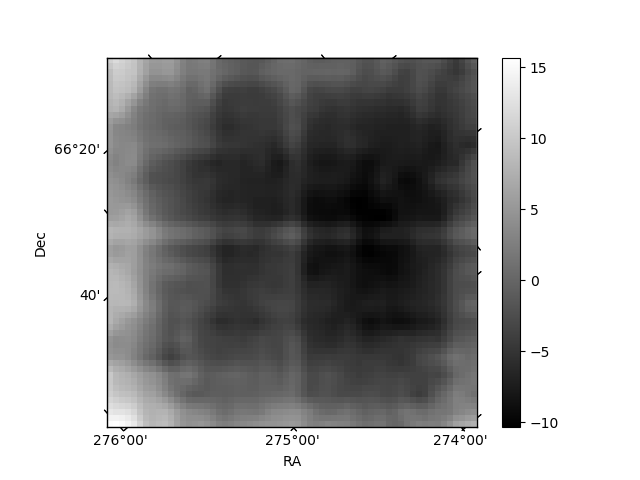
| Quadrant D | 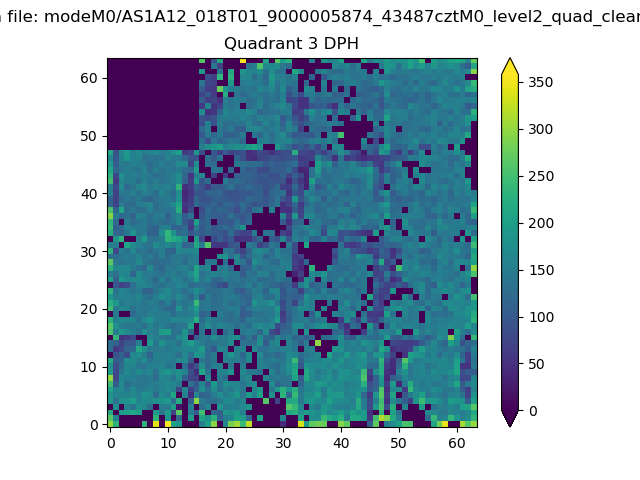 |
 |
Quadrant C |
| Plot type | Count rate plots | Images |
|---|---|---|
| Comparison with Poisson distribution Blue bars denote a histogram of data divided into 1 sec bins. Red curve is a Poisson curve with rate = median count rate of data. |
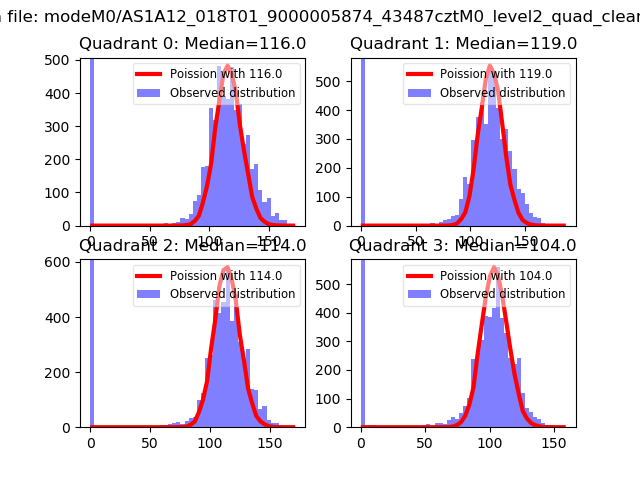 |
 |
| Quadrant-wise count rates Data is divided into 100 sec bins |
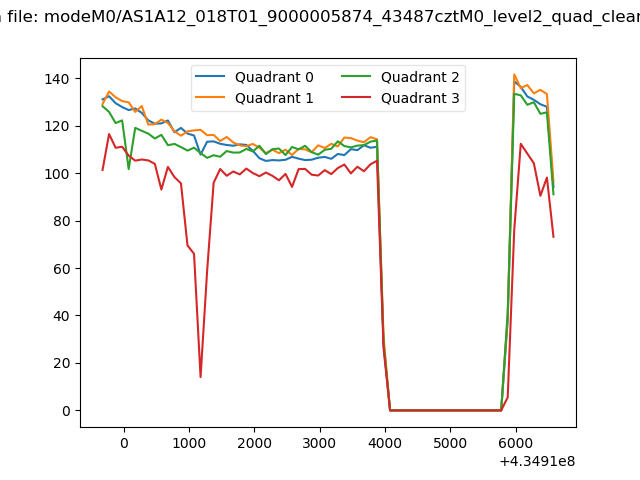 |
|
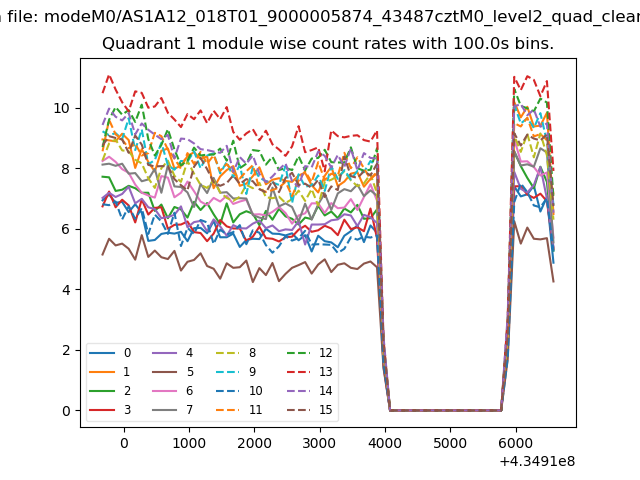
| Module-wise count rates for Quadrant A Data is divided into 100 sec bins |
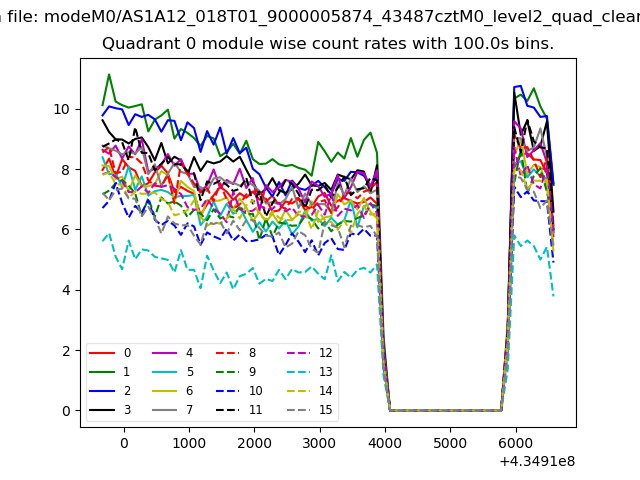 |
 |
| Module-wise count rates for Quadrant B Data is divided into 100 sec bins |
 |
 |
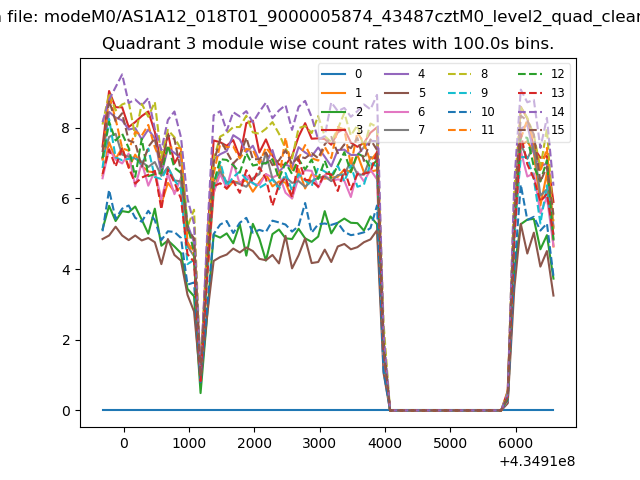
| Module-wise count rates for Quadrant C Data is divided into 100 sec bins |
 |
 |
| Module-wise count rates for Quadrant D Data is divided into 100 sec bins |
 |
 |
| Parameter | Plot |
|---|---|
| CZT HV Monitor | 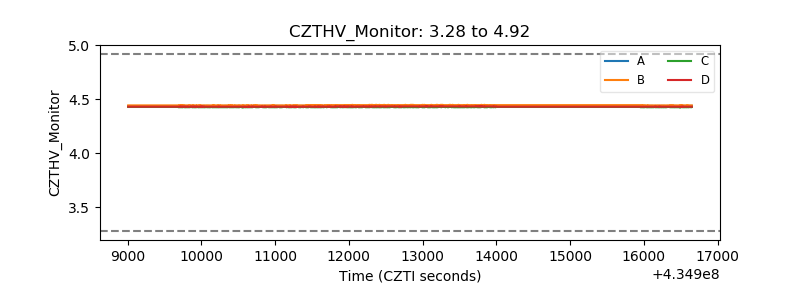 |
| D_VDD | 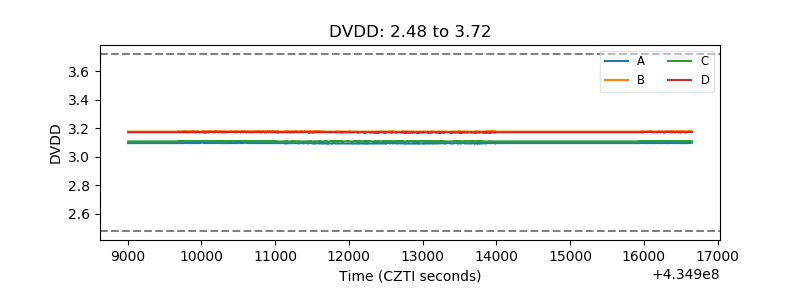 |
| Temperature 1 | 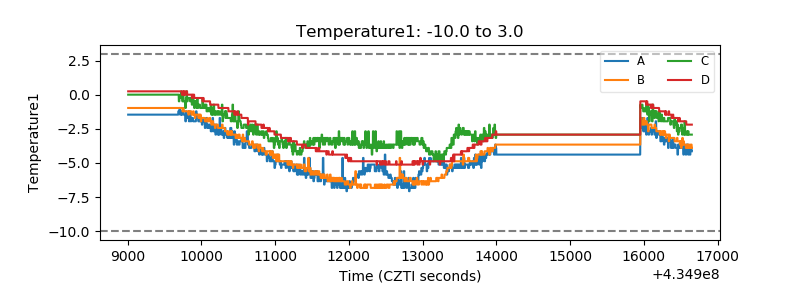 |
| Veto HV Monitor | 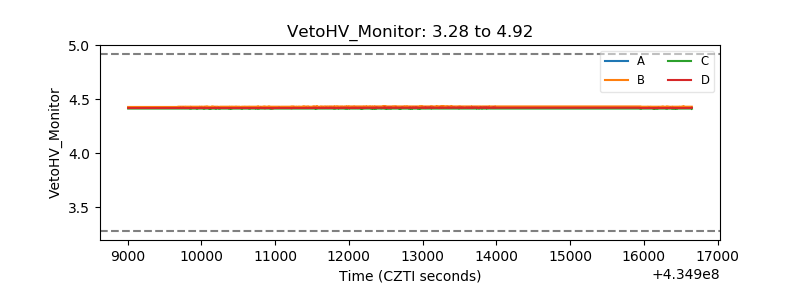 |
| Veto LLD | 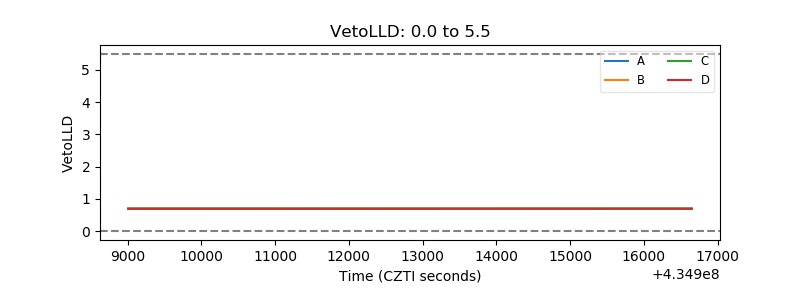 |
| Alpha Counter | 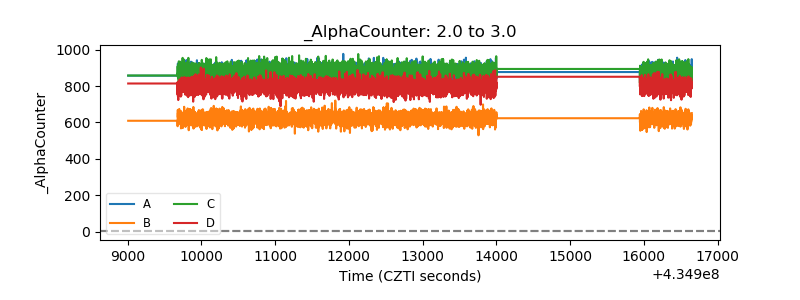 |
| _CPM_Rate | 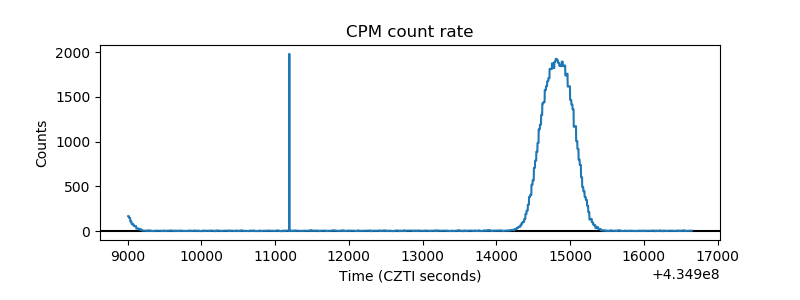 |
| CZT Counter | 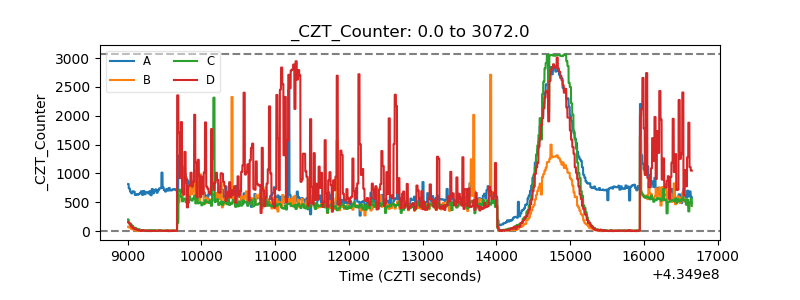 |
| +2.5 Volts monitor | 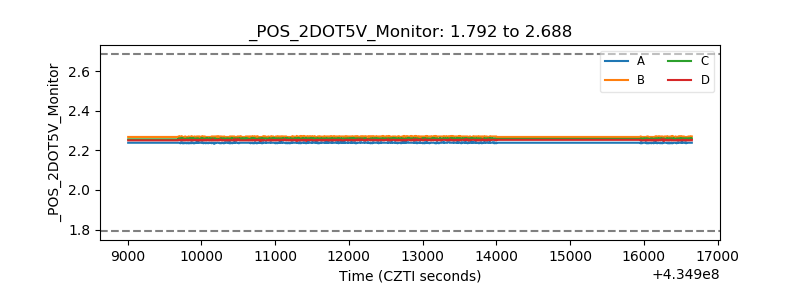 |
| +5 Volts monitor | 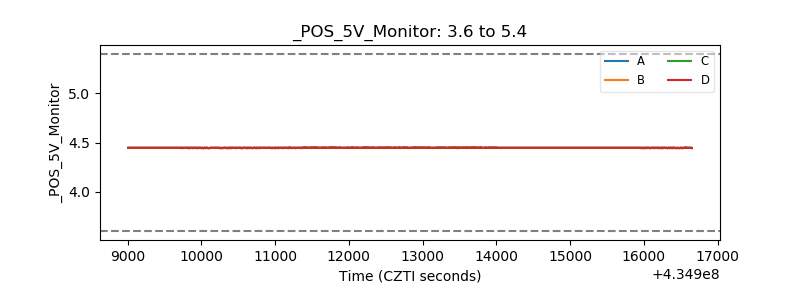 |
| _ROLL_ROT | 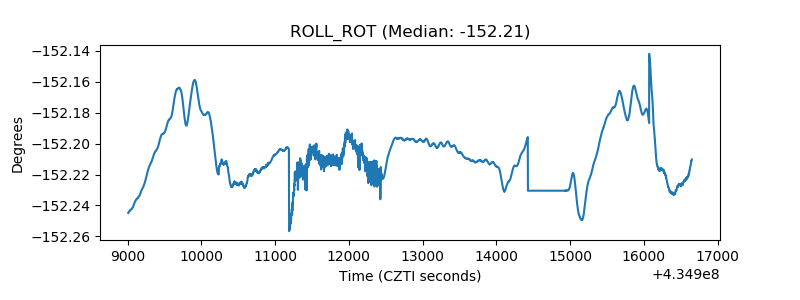 |
| _Roll_DEC | 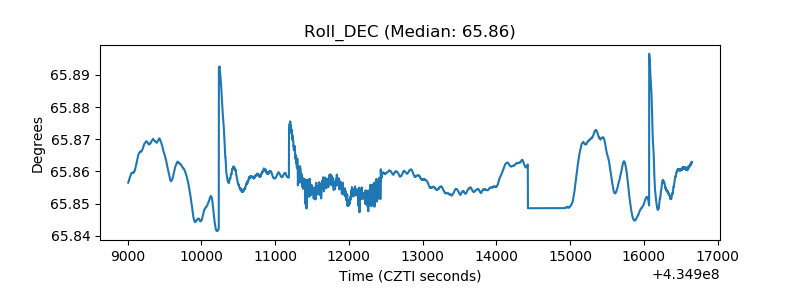 |
| _Roll_RA | 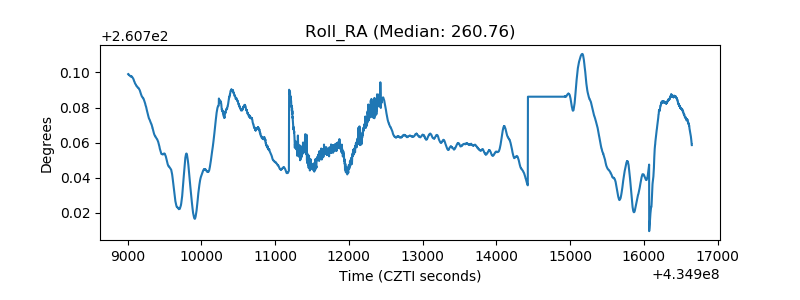 |
| Veto Counter | 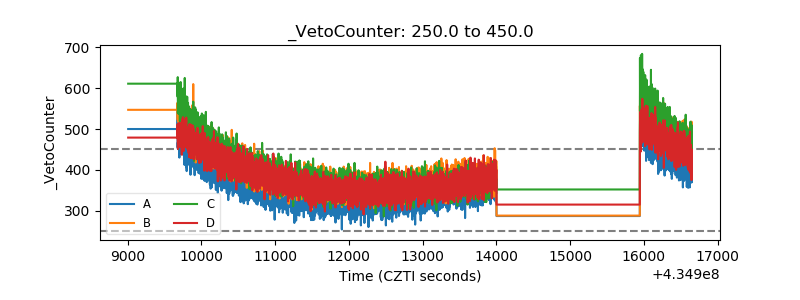 |