| Param | Original file | Final file |
|---|---|---|
| Filename | modeM0/AS1A12_018T01_9000005874_43488cztM0_level2.fits | modeM0/AS1A12_018T01_9000005874_43488cztM0_level2_quad_clean.evt |
| Size (bytes) | 362,350,080 | 87,226,560 |
| Size | 345.6 MB | 83.2 MB |
| Events in quadrant A | 3,008,263 | 595,949 |
| Events in quadrant B | 2,711,257 | 611,371 |
| Events in quadrant C | 2,455,987 | 593,584 |
| Events in quadrant D | 4,847,349 | 488,898 |
| Mode M0 | |||
|---|---|---|---|
| Quadrant | BADHDUFLAG | Total packets | Discarded packets |
| A | 0 | 12085 | 2 |
| B | 0 | 11382 | 2 |
| C | 0 | 10384 | 2 |
| D | 0 | 17920 | 2 |
| Mode M9 | |||
|---|---|---|---|
| Quadrant | BADHDUFLAG | Total packets | Discarded packets |
| A | 0 | 30 | 0 |
| B | 0 | 31 | 0 |
| C | 0 | 31 | 0 |
| D | 0 | 31 | 0 |
| Mode SS | |||
|---|---|---|---|
| Quadrant | BADHDUFLAG | Total packets | Discarded packets |
| A | 0 | 102 | 0 |
| B | 0 | 102 | 0 |
| C | 0 | 102 | 0 |
| D | 0 | 102 | 0 |
| Quadrant | Total seconds | Saturated seconds | Saturation percentage |
|---|---|---|---|
| A | 5013 | 20 | 0.398963% |
| B | 5013 | 43 | 0.857770% |
| C | 5013 | 4 | 0.079793% |
| D | 5013 | 606 | 12.088570% |
Noise dominated data is calculated using 1-second bins in cleaned event files. If a bin has >2000 counts, and if more than 50% of those come from <1% of pixels, then it is considered to be noise-dominated and hence unusable.
| Quadrant | # 1 sec bins | Bins with >0 counts | Bins with >2000 counts | High rate bins dominated by noise | Noise dominated (total time) | Noise dominated (detector-on time) | Marked lightcurve |
|---|---|---|---|---|---|---|---|
| A | 7075 | 5014 | 10 | 10 | 0.14% | 0.20% | 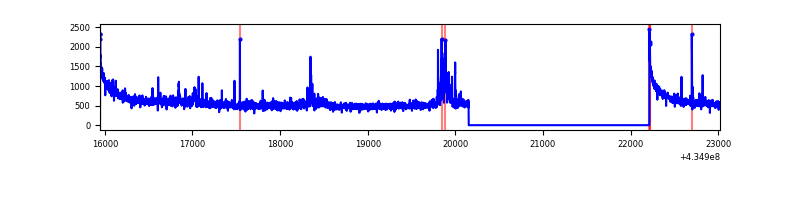 |
| B | 7075 | 5014 | 38 | 38 | 0.54% | 0.76% | 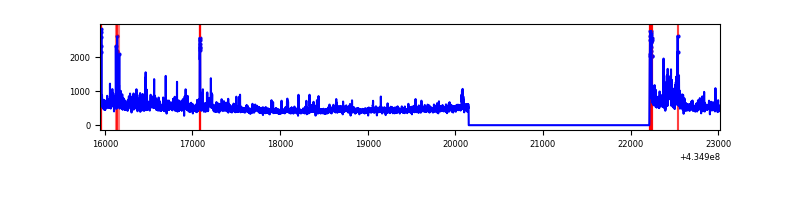 |
| C | 7075 | 5014 | 4 | 4 | 0.06% | 0.08% | 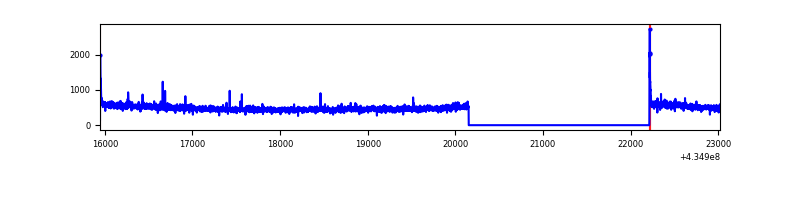 |
| D | 7074 | 5013 | 623 | 623 | 8.81% | 12.43% | 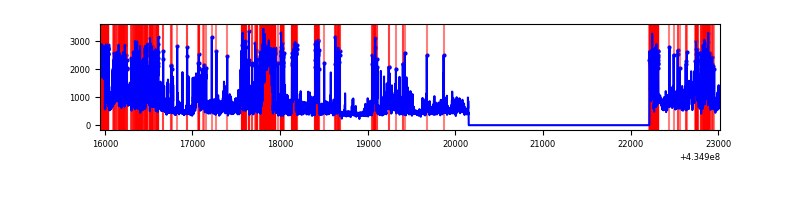 |
Top three noisy pixels from each quadrant. If the there are fewer than three noisy pixels in the level2.evt file, extra rows are filled as -1
| Pixel properties | Quadrant properties | ||||||
|---|---|---|---|---|---|---|---|
| Quadrant | DetID | PixID | Counts | Sigma | Mean | Median | Sigma |
| A | 10 | 83 | 595328 | 5341.51 | 549 | 539 | 111.4 |
| A | 15 | 222 | 191521 | 1715.12 | 549 | 539 | 111.4 |
| A | 15 | 237 | 59129 | 526.17 | 549 | 539 | 111.4 |
| B | 0 | 189 | 290009 | 2762.23 | 554 | 540 | 104.8 |
| B | 0 | 245 | 76688 | 726.63 | 554 | 540 | 104.8 |
| B | 15 | 36 | 53196 | 502.46 | 554 | 540 | 104.8 |
| C | 15 | 214 | 206070 | 1608.39 | 551 | 556 | 127.8 |
| C | 3 | 233 | 79311 | 616.35 | 551 | 556 | 127.8 |
| C | 12 | 2 | 8140 | 59.35 | 551 | 556 | 127.8 |
| D | 1 | 52 | 1324345 | 10561.95 | 514 | 500 | 125.3 |
| D | 2 | 16 | 534434 | 4259.85 | 514 | 500 | 125.3 |
| D | 13 | 249 | 317562 | 2529.6 | 514 | 500 | 125.3 |
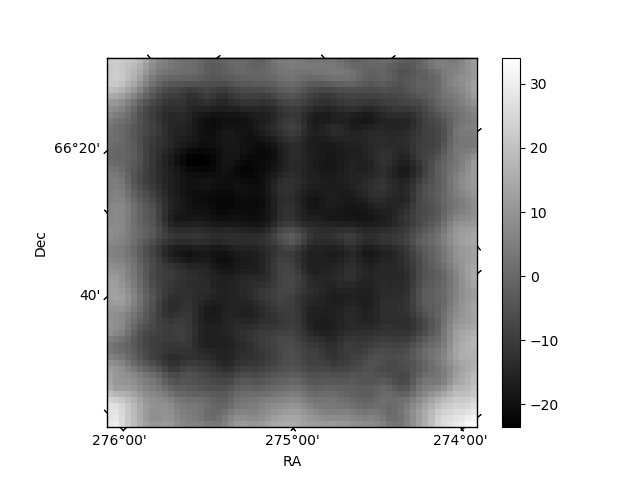
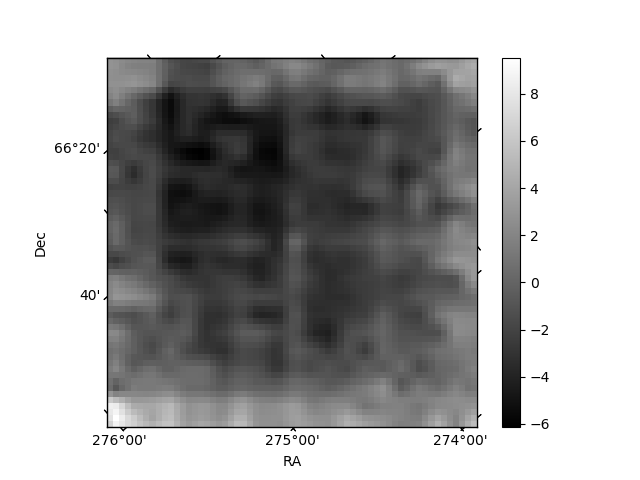
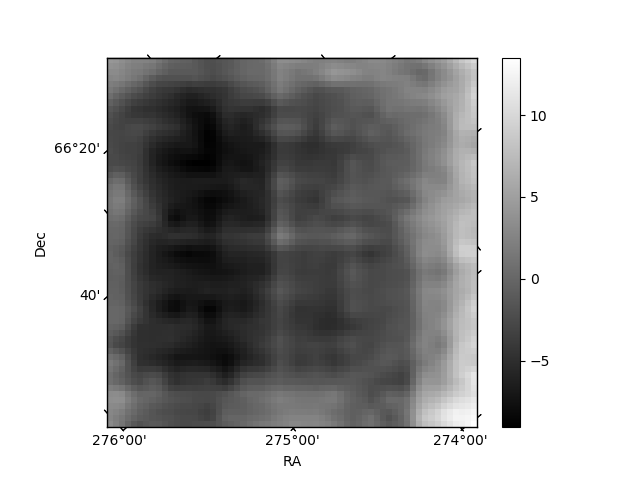
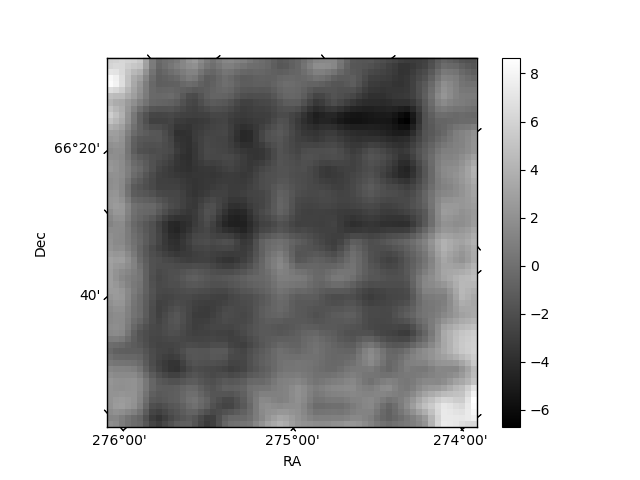
Histogram calculated using DETX and DETY for each event in the final _common_clean file
| Quadrant A | 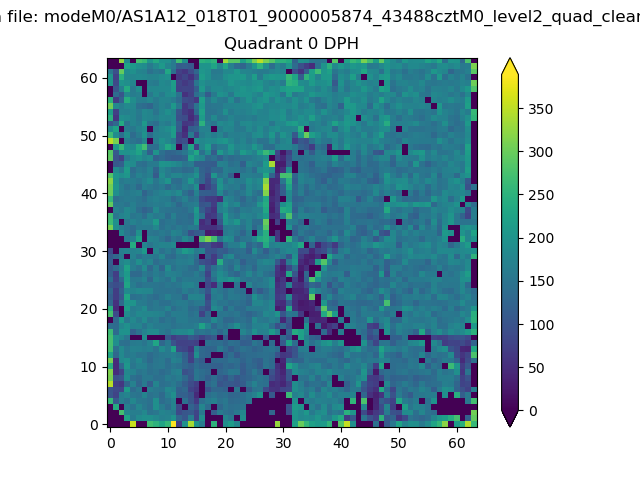 |
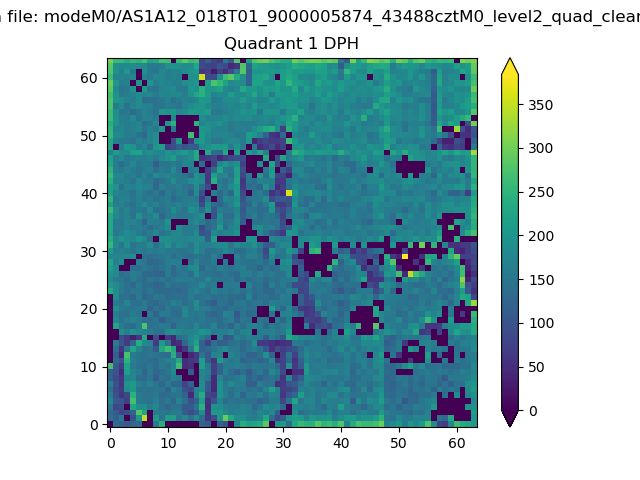 |
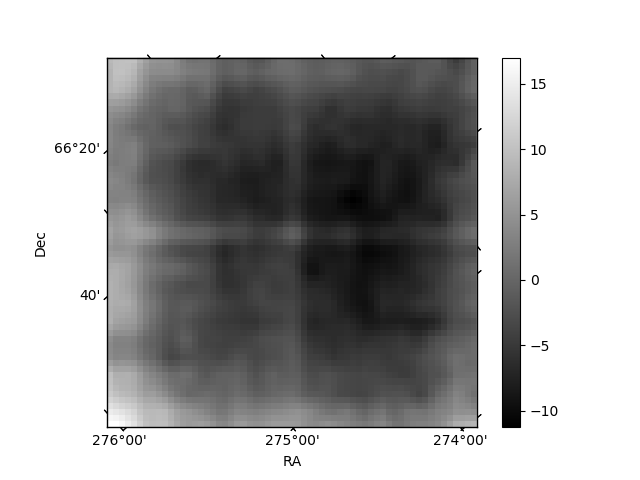
Quadrant B |
|---|---|---|---|
| Quadrant D | 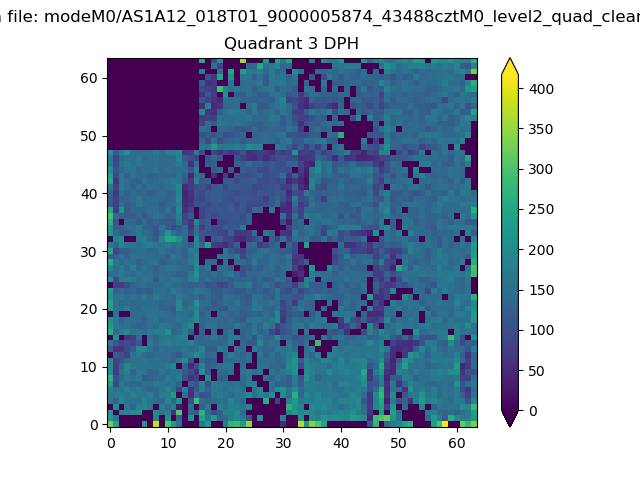 |
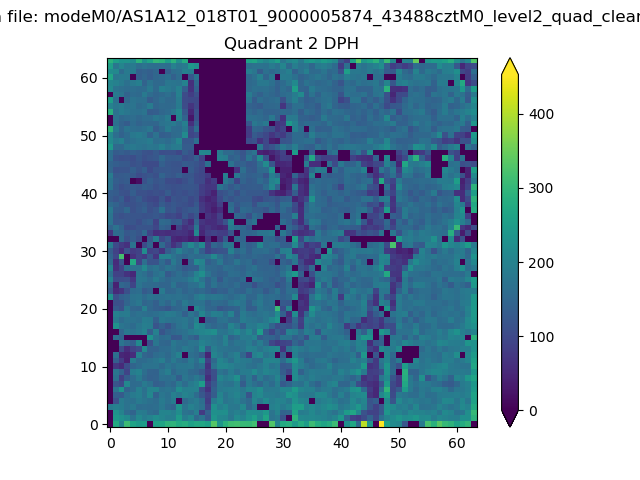 |
Quadrant C |
| Plot type | Count rate plots | Images |
|---|---|---|
| Comparison with Poisson distribution Blue bars denote a histogram of data divided into 1 sec bins. Red curve is a Poisson curve with rate = median count rate of data. |
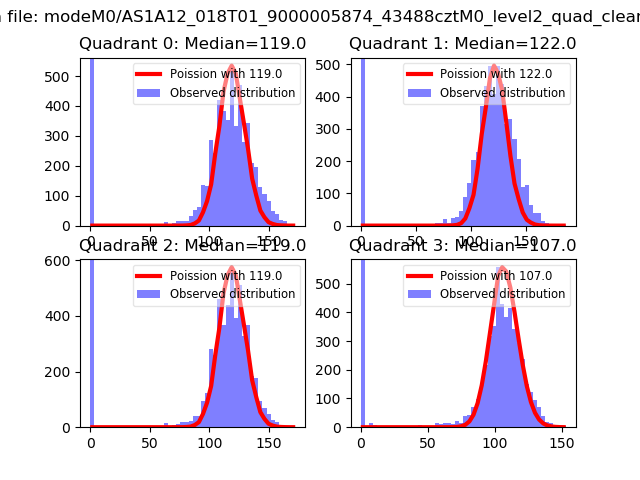 |
 |
| Quadrant-wise count rates Data is divided into 100 sec bins |
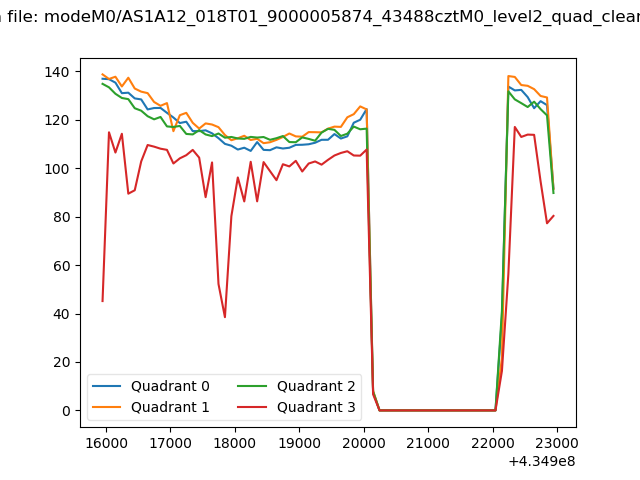 |
|
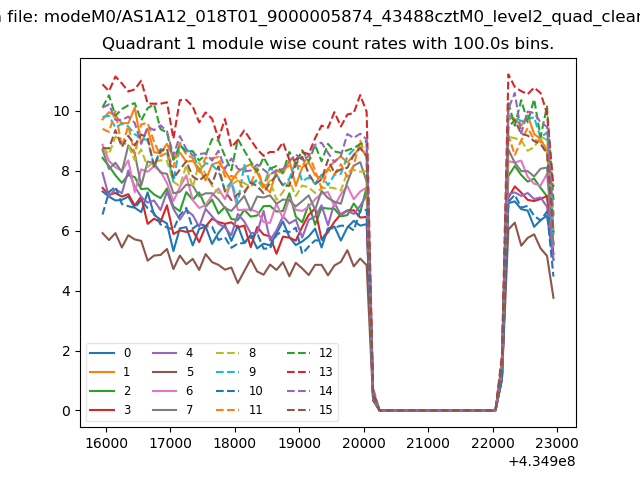
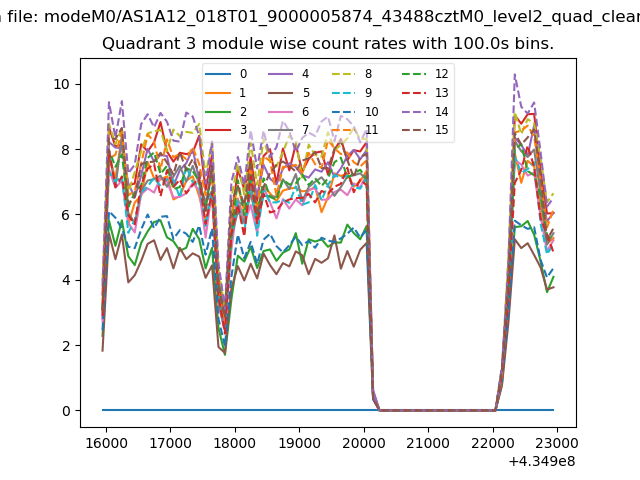
| Module-wise count rates for Quadrant A Data is divided into 100 sec bins |
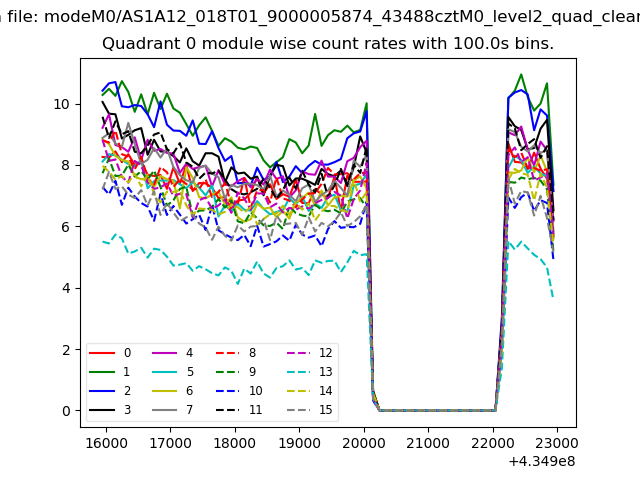 |
 |
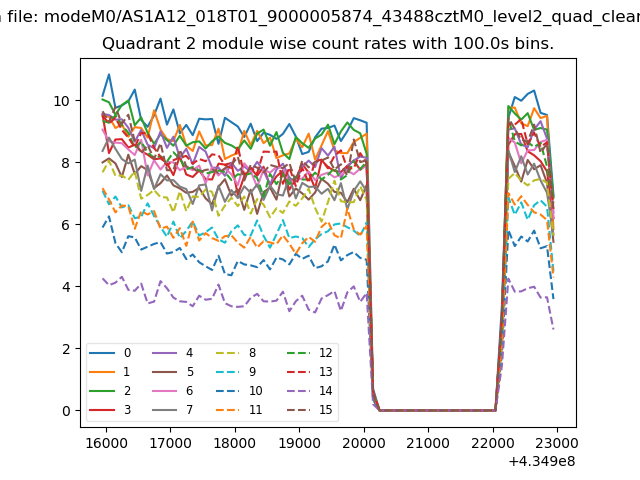
| Module-wise count rates for Quadrant B Data is divided into 100 sec bins |
 |
 |
| Module-wise count rates for Quadrant C Data is divided into 100 sec bins |
 |
 |
| Module-wise count rates for Quadrant D Data is divided into 100 sec bins |
 |
 |
| Parameter | Plot |
|---|---|
| CZT HV Monitor | 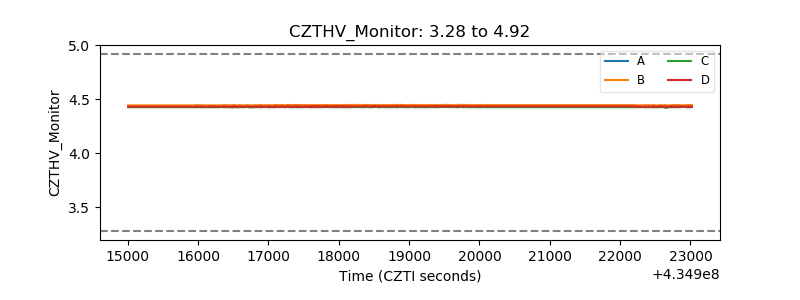 |
| D_VDD | 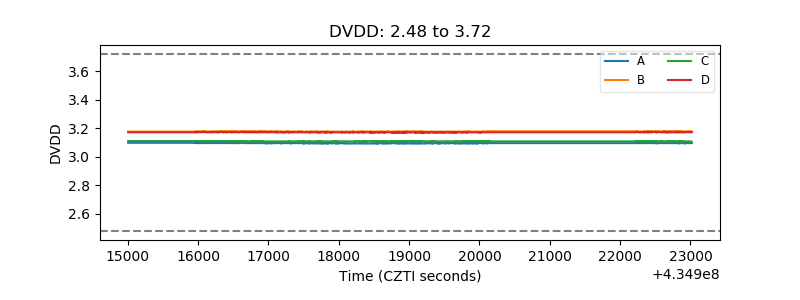 |
| Temperature 1 | 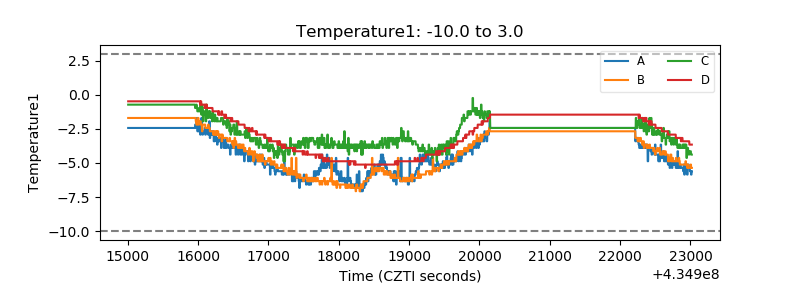 |
| Veto HV Monitor | 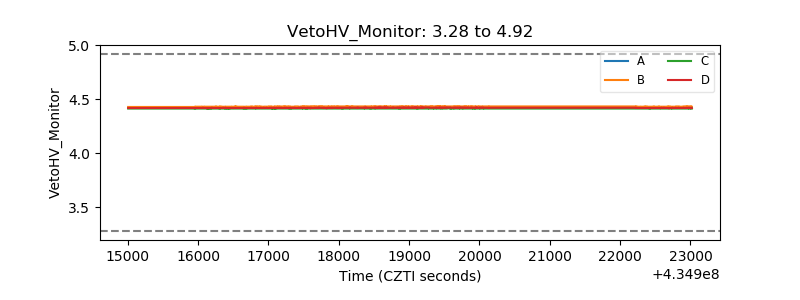 |
| Veto LLD | 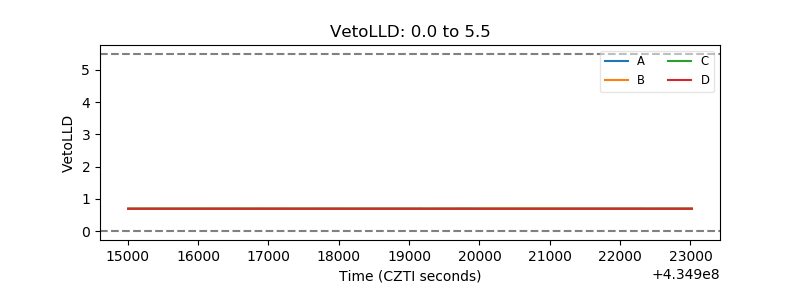 |
| Alpha Counter | 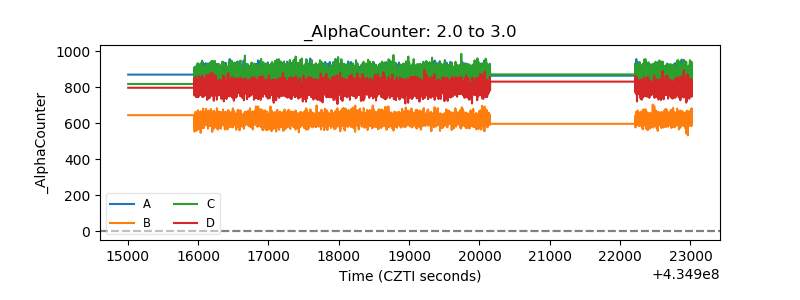 |
| _CPM_Rate | 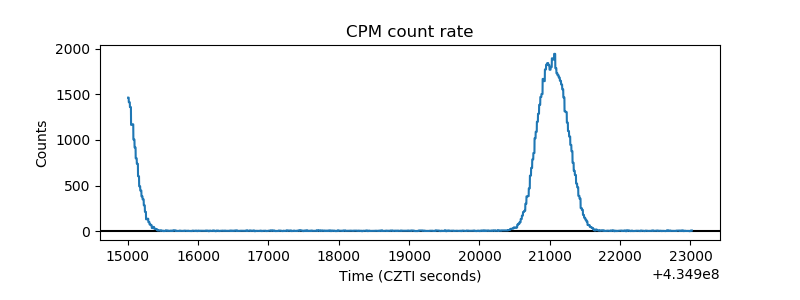 |
| CZT Counter | 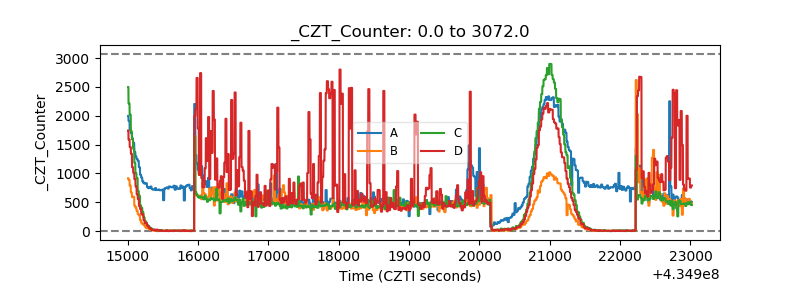 |
| +2.5 Volts monitor | 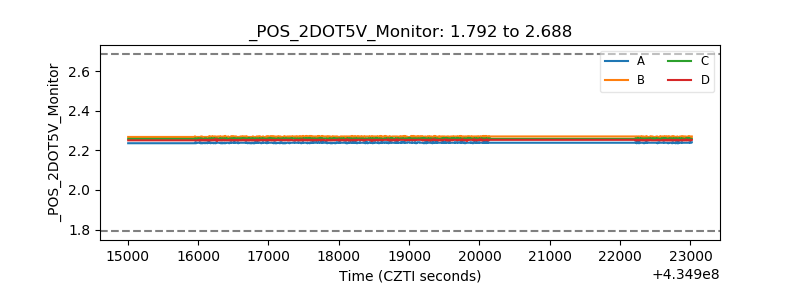 |
| +5 Volts monitor | 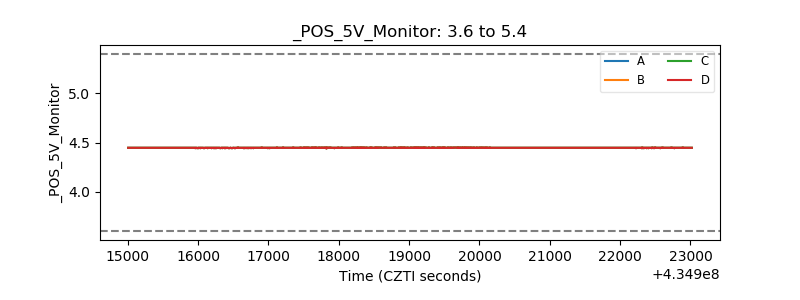 |
| _ROLL_ROT | 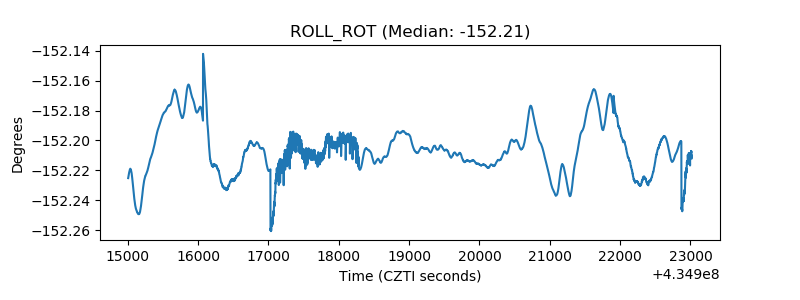 |
| _Roll_DEC | 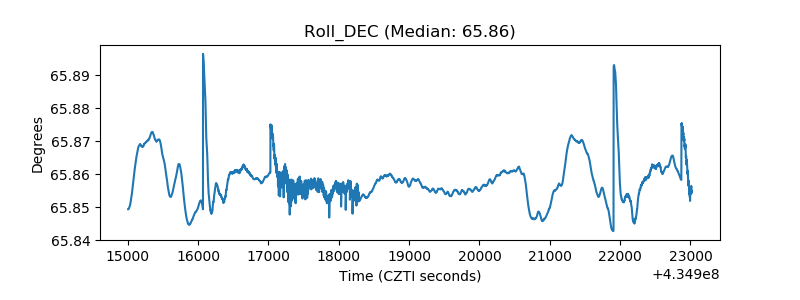 |
| _Roll_RA | 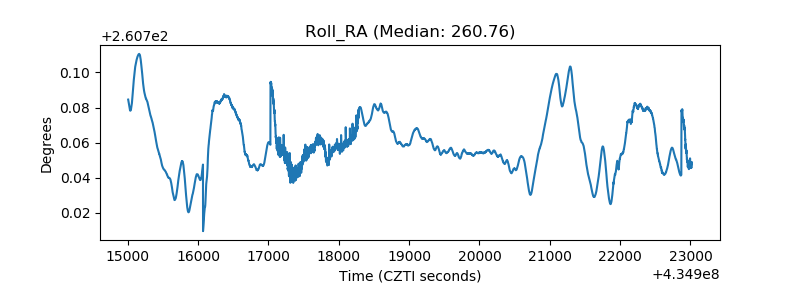 |
| Veto Counter | 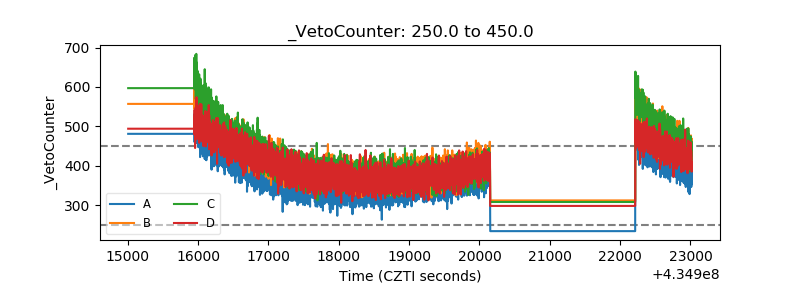 |