| Param | Original file | Final file |
|---|---|---|
| Filename | modeM0/AS1A12_018T01_9000005874_43491cztM0_level2.fits | modeM0/AS1A12_018T01_9000005874_43491cztM0_level2_quad_clean.evt |
| Size (bytes) | 359,159,040 | 85,386,240 |
| Size | 342.5 MB | 81.4 MB |
| Events in quadrant A | 2,952,800 | 571,820 |
| Events in quadrant B | 2,429,317 | 588,542 |
| Events in quadrant C | 2,475,859 | 567,729 |
| Events in quadrant D | 5,024,326 | 486,162 |
| Mode M0 | |||
|---|---|---|---|
| Quadrant | BADHDUFLAG | Total packets | Discarded packets |
| A | 0 | 12071 | 2 |
| B | 0 | 11090 | 2 |
| C | 0 | 10829 | 3 |
| D | 0 | 18763 | 2 |
| Mode M9 | |||
|---|---|---|---|
| Quadrant | BADHDUFLAG | Total packets | Discarded packets |
| A | 0 | 34 | 0 |
| B | 0 | 35 | 0 |
| C | 0 | 35 | 0 |
| D | 0 | 35 | 0 |
| Mode SS | |||
|---|---|---|---|
| Quadrant | BADHDUFLAG | Total packets | Discarded packets |
| A | 0 | 108 | 0 |
| B | 0 | 108 | 0 |
| C | 0 | 108 | 0 |
| D | 0 | 108 | 0 |
| Quadrant | Total seconds | Saturated seconds | Saturation percentage |
|---|---|---|---|
| A | 5300 | 13 | 0.245283% |
| B | 5300 | 16 | 0.301887% |
| C | 5299 | 11 | 0.207586% |
| D | 5299 | 489 | 9.228156% |
Noise dominated data is calculated using 1-second bins in cleaned event files. If a bin has >2000 counts, and if more than 50% of those come from <1% of pixels, then it is considered to be noise-dominated and hence unusable.
| Quadrant | # 1 sec bins | Bins with >0 counts | Bins with >2000 counts | High rate bins dominated by noise | Noise dominated (total time) | Noise dominated (detector-on time) | Marked lightcurve |
|---|---|---|---|---|---|---|---|
| A | 7303 | 5301 | 9 | 9 | 0.12% | 0.17% | 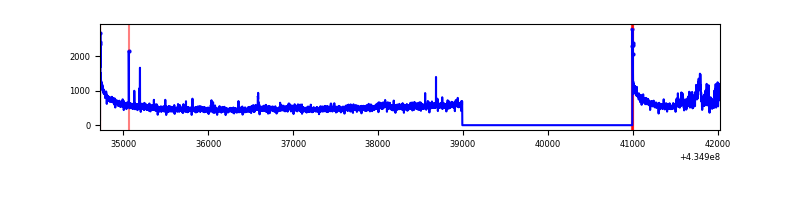 |
| B | 7303 | 5301 | 9 | 9 | 0.12% | 0.17% | 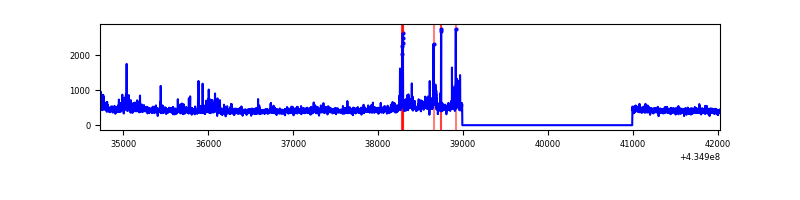 |
| C | 7302 | 5300 | 5 | 5 | 0.07% | 0.09% | 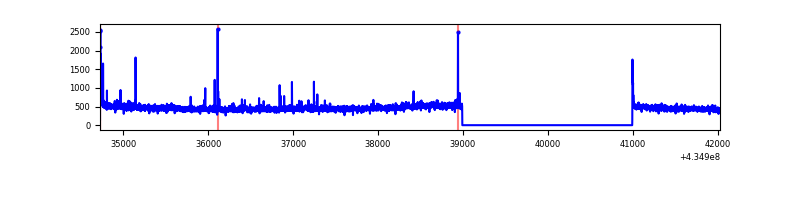 |
| D | 7302 | 5300 | 514 | 514 | 7.04% | 9.70% | 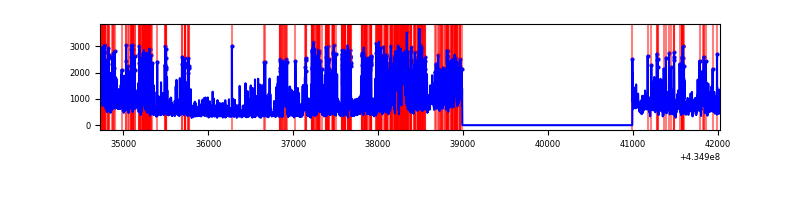 |
Top three noisy pixels from each quadrant. If the there are fewer than three noisy pixels in the level2.evt file, extra rows are filled as -1
| Pixel properties | Quadrant properties | ||||||
|---|---|---|---|---|---|---|---|
| Quadrant | DetID | PixID | Counts | Sigma | Mean | Median | Sigma |
| A | 10 | 83 | 578087 | 5128.66 | 552 | 542 | 112.6 |
| A | 15 | 237 | 204934 | 1815.02 | 552 | 542 | 112.6 |
| A | 13 | 6 | 12840 | 109.21 | 552 | 542 | 112.6 |
| B | 0 | 189 | 113020 | 1049.45 | 552 | 536 | 107.2 |
| B | 0 | 186 | 33329 | 305.95 | 552 | 536 | 107.2 |
| B | 0 | 245 | 26592 | 243.1 | 552 | 536 | 107.2 |
| C | 15 | 214 | 214311 | 1678.5 | 542 | 544 | 127.4 |
| C | 3 | 233 | 116113 | 907.45 | 542 | 544 | 127.4 |
| C | 14 | 254 | 17247 | 131.15 | 542 | 544 | 127.4 |
| D | 1 | 52 | 1611753 | 12649.41 | 519 | 503 | 127.4 |
| D | 2 | 16 | 589832 | 4626.63 | 519 | 503 | 127.4 |
| D | 5 | 222 | 206702 | 1618.8 | 519 | 503 | 127.4 |
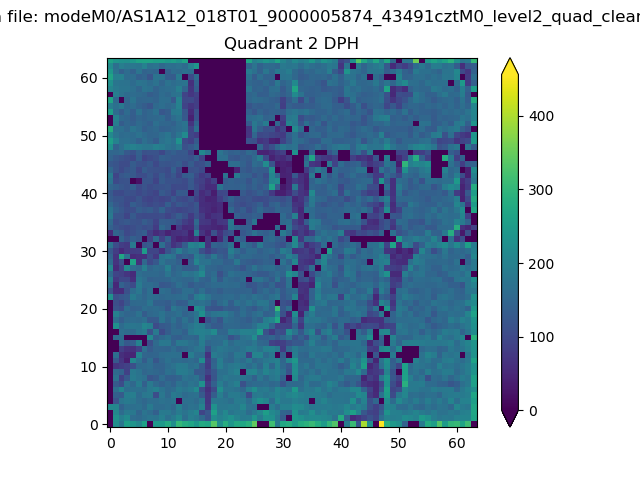
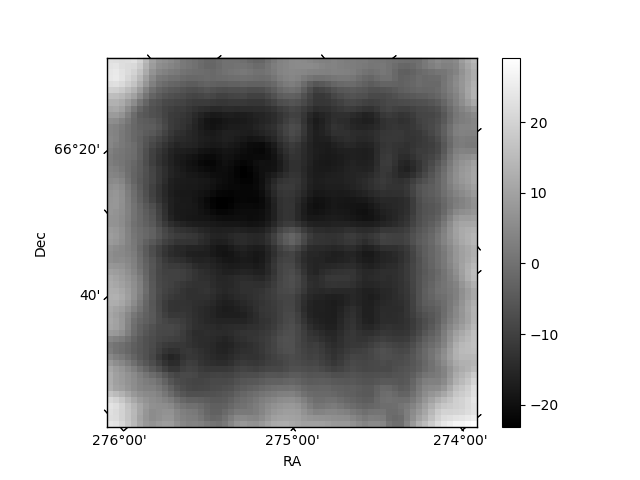
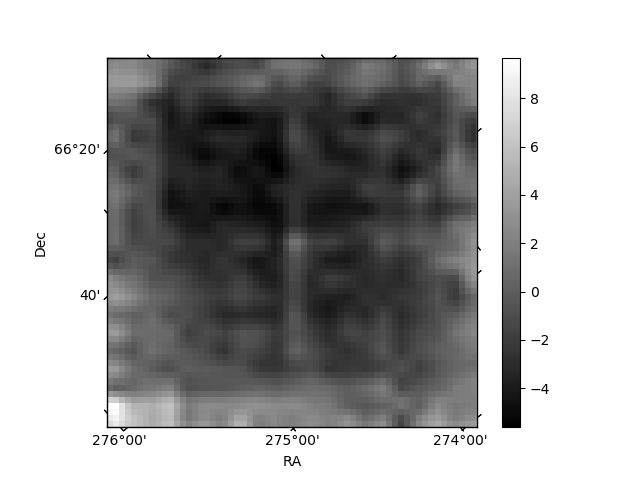
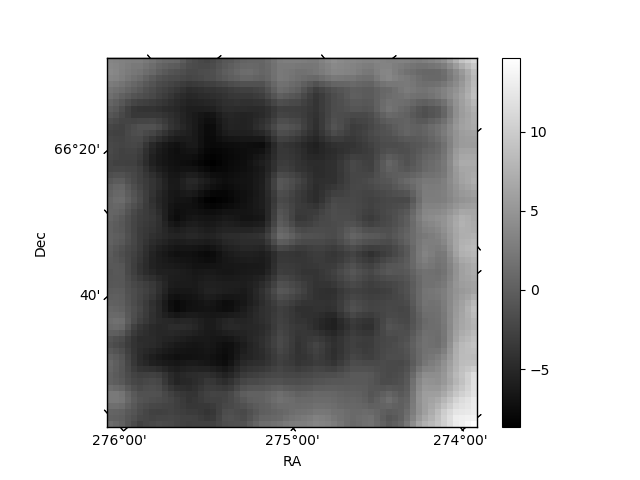
Histogram calculated using DETX and DETY for each event in the final _common_clean file
| Quadrant A | 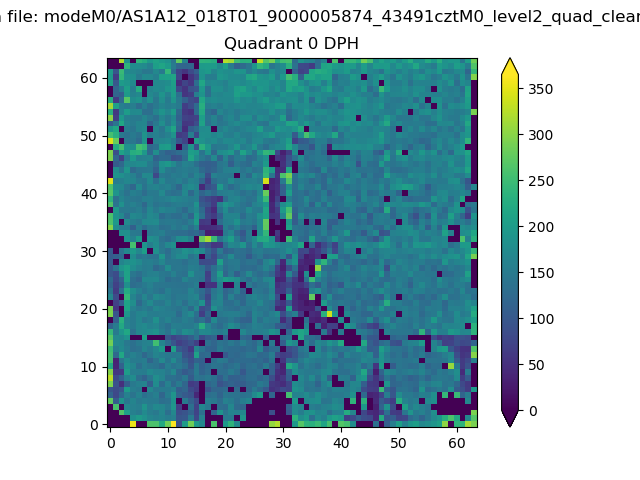 |
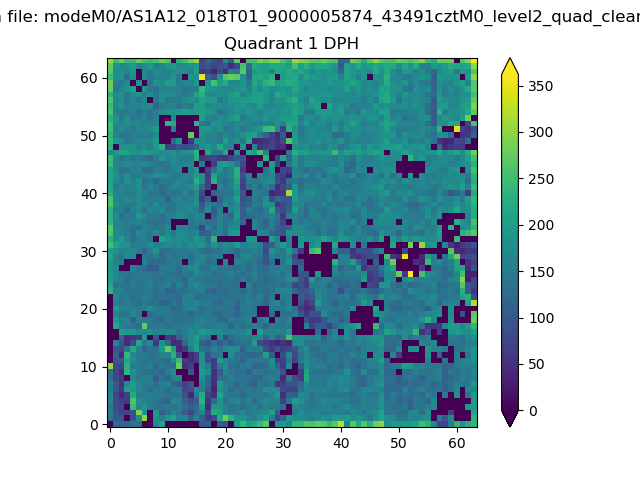 |
Quadrant B |
|---|---|---|---|
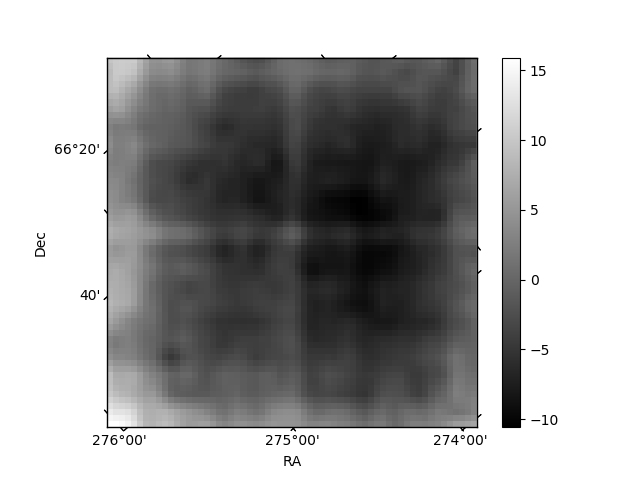
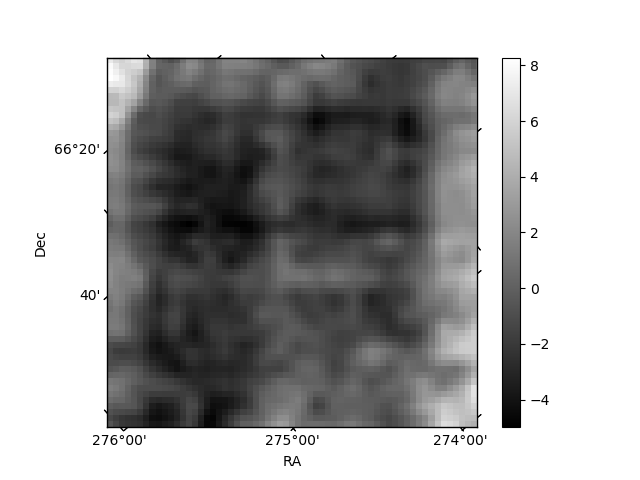
| Quadrant D | 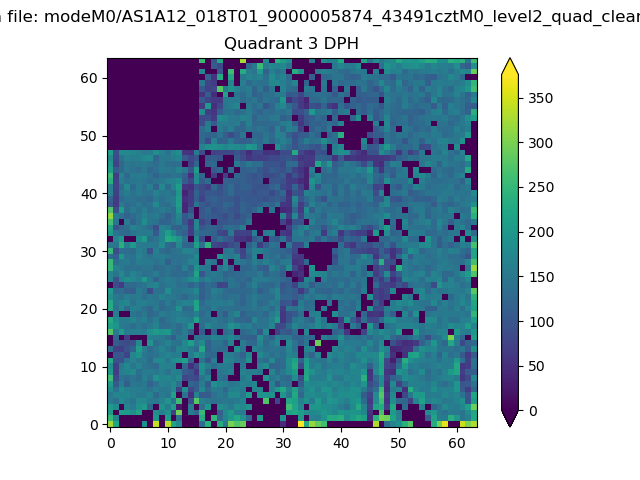 |
 |
Quadrant C |
| Plot type | Count rate plots | Images |
|---|---|---|
| Comparison with Poisson distribution Blue bars denote a histogram of data divided into 1 sec bins. Red curve is a Poisson curve with rate = median count rate of data. |
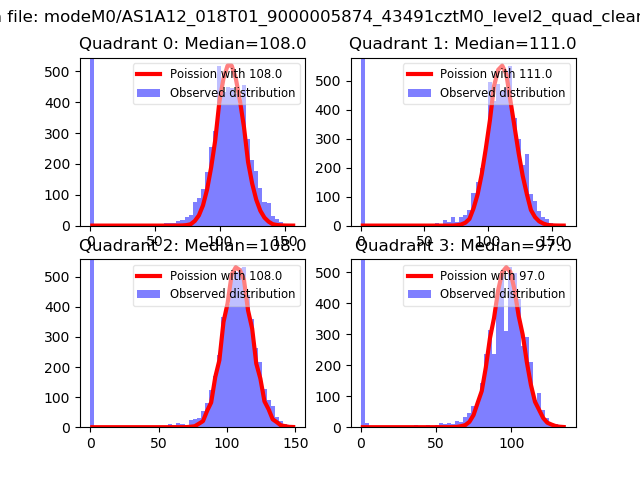 |
 |
| Quadrant-wise count rates Data is divided into 100 sec bins |
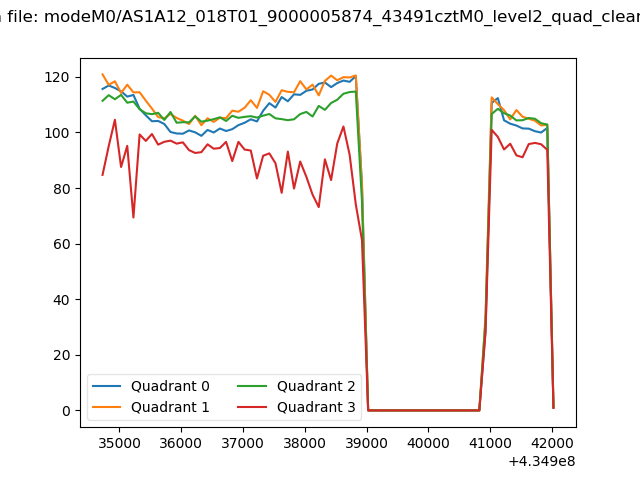 |
|
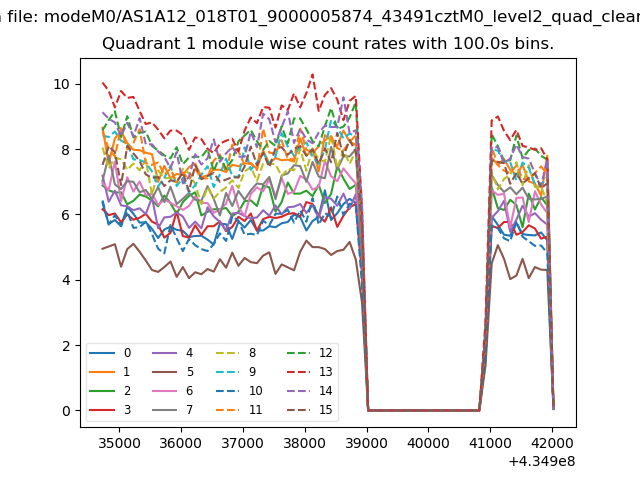
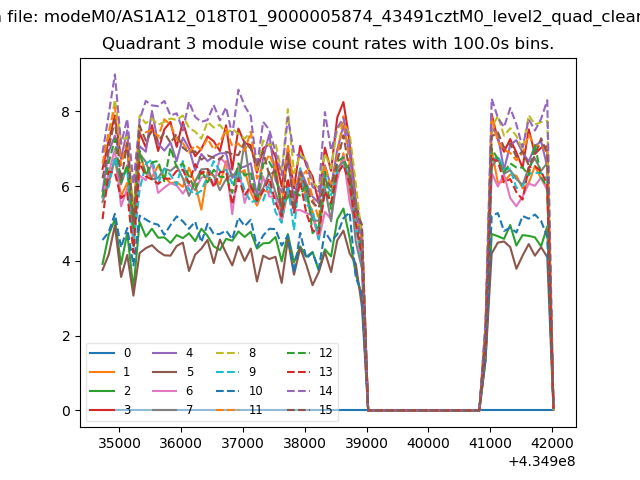
| Module-wise count rates for Quadrant A Data is divided into 100 sec bins |
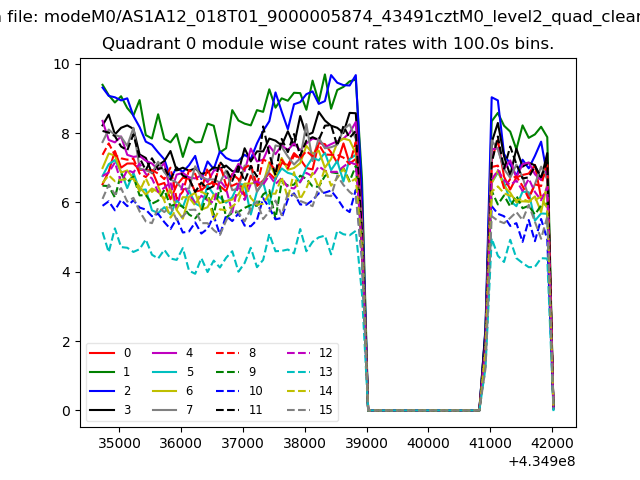 |
 |
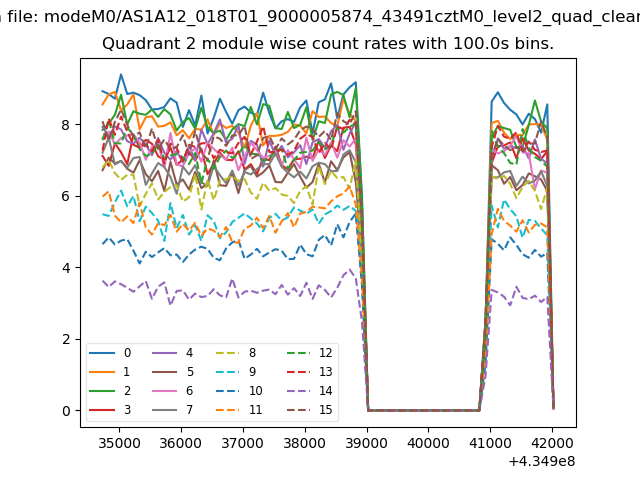
| Module-wise count rates for Quadrant B Data is divided into 100 sec bins |
 |
 |
| Module-wise count rates for Quadrant C Data is divided into 100 sec bins |
 |
 |
| Module-wise count rates for Quadrant D Data is divided into 100 sec bins |
 |
 |
| Parameter | Plot |
|---|---|
| CZT HV Monitor | 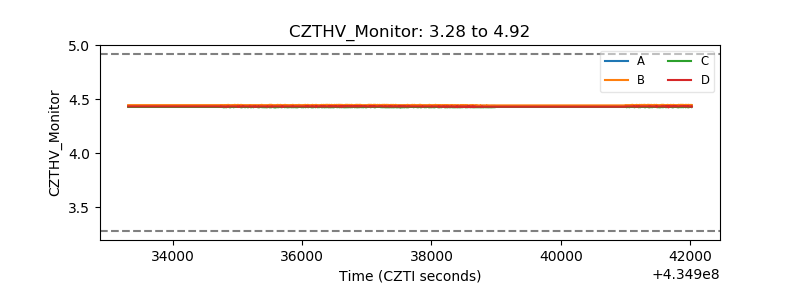 |
| D_VDD | 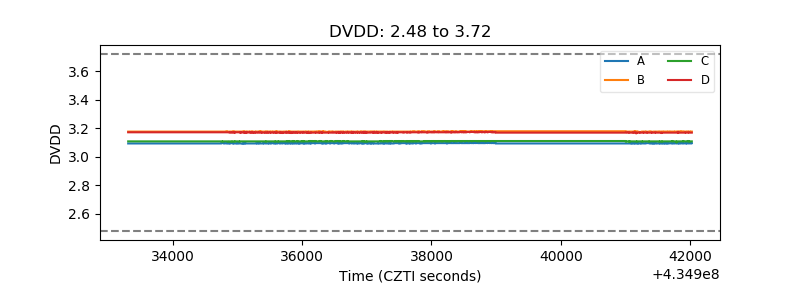 |
| Temperature 1 | 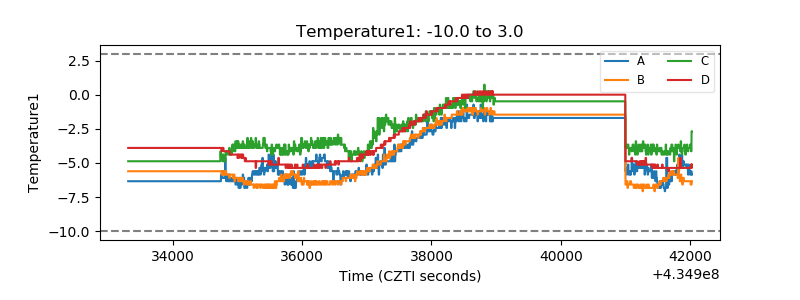 |
| Veto HV Monitor | 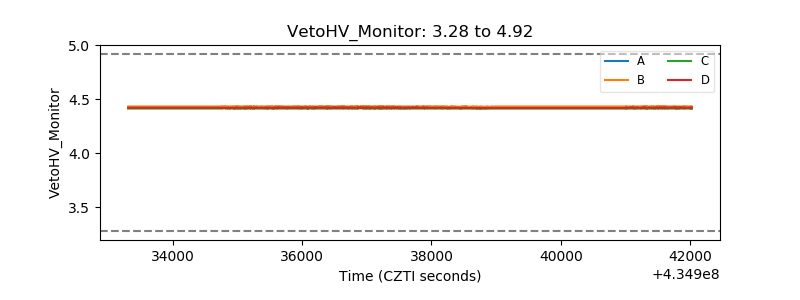 |
| Veto LLD | 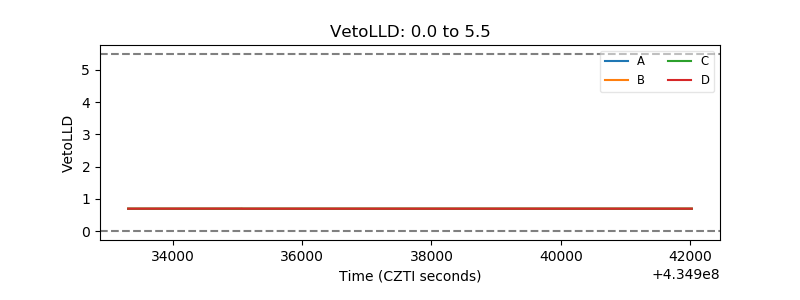 |
| Alpha Counter | 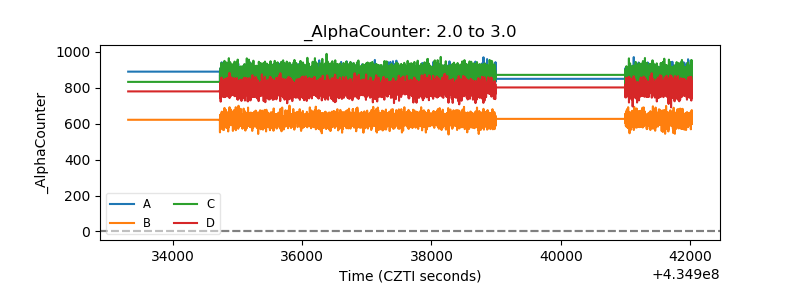 |
| _CPM_Rate | 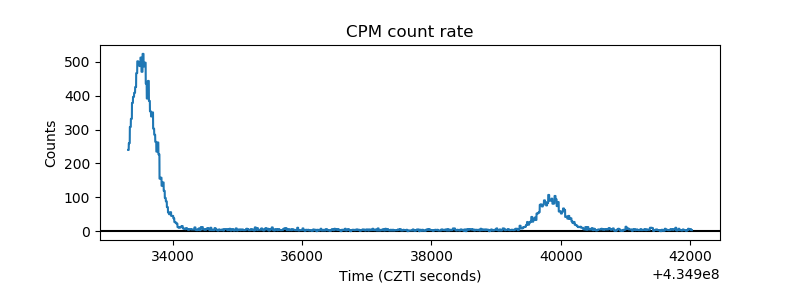 |
| CZT Counter | 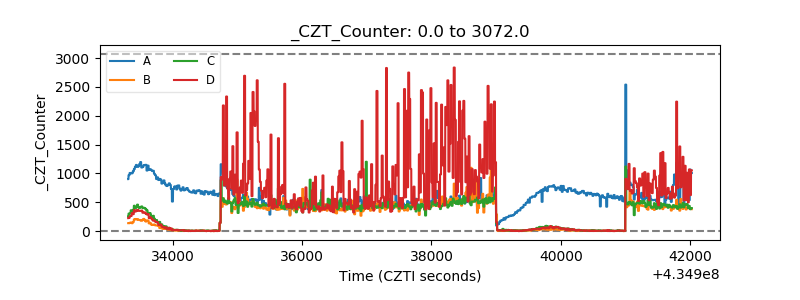 |
| +2.5 Volts monitor | 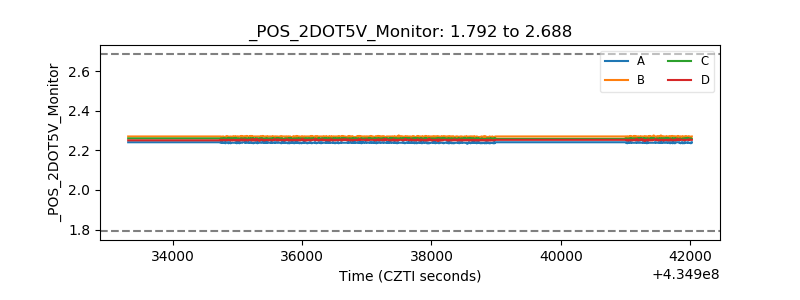 |
| +5 Volts monitor | 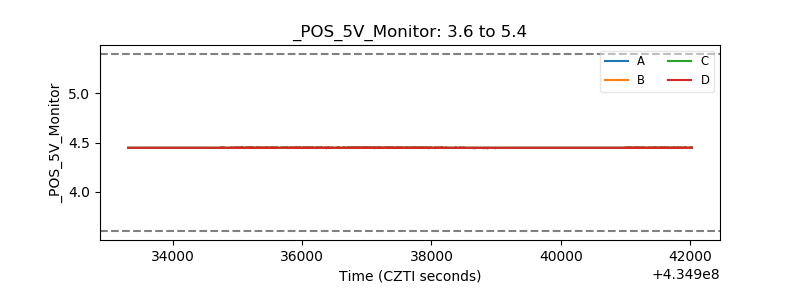 |
| _ROLL_ROT | 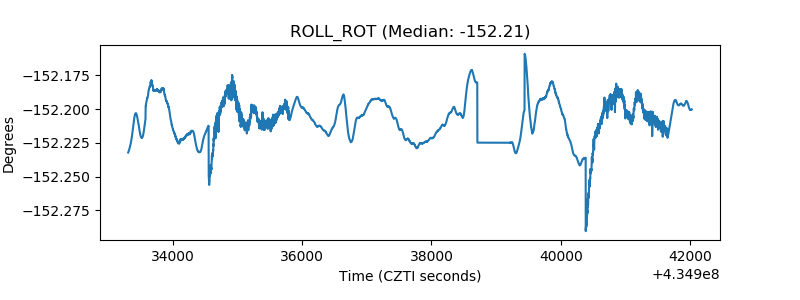 |
| _Roll_DEC | 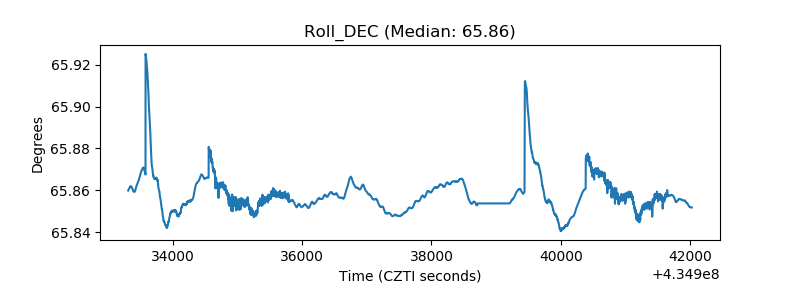 |
| _Roll_RA |  |
| Veto Counter | 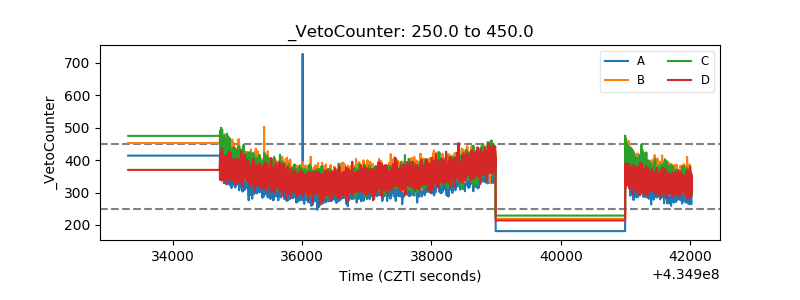 |