| Param | Original file | Final file |
|---|---|---|
| Filename | modeM0/AS1A12_018T01_9000005874_43492cztM0_level2.fits | modeM0/AS1A12_018T01_9000005874_43492cztM0_level2_quad_clean.evt |
| Size (bytes) | 403,162,560 | 87,606,720 |
| Size | 384.5 MB | 83.5 MB |
| Events in quadrant A | 3,981,819 | 584,184 |
| Events in quadrant B | 2,518,965 | 602,466 |
| Events in quadrant C | 2,566,458 | 580,338 |
| Events in quadrant D | 5,426,354 | 498,091 |
| Mode M0 | |||
|---|---|---|---|
| Quadrant | BADHDUFLAG | Total packets | Discarded packets |
| A | 0 | 15433 | 2 |
| B | 0 | 11557 | 2 |
| C | 0 | 11344 | 2 |
| D | 0 | 20020 | 2 |
| Mode M9 | |||
|---|---|---|---|
| Quadrant | BADHDUFLAG | Total packets | Discarded packets |
| A | 0 | 33 | 0 |
| B | 0 | 34 | 0 |
| C | 0 | 34 | 0 |
| D | 0 | 34 | 0 |
| Mode SS | |||
|---|---|---|---|
| Quadrant | BADHDUFLAG | Total packets | Discarded packets |
| A | 0 | 114 | 0 |
| B | 0 | 114 | 0 |
| C | 0 | 114 | 0 |
| D | 0 | 114 | 0 |
| Quadrant | Total seconds | Saturated seconds | Saturation percentage |
|---|---|---|---|
| A | 5533 | 54 | 0.975962% |
| B | 5533 | 10 | 0.180734% |
| C | 5533 | 7 | 0.126514% |
| D | 5533 | 498 | 9.000542% |
Noise dominated data is calculated using 1-second bins in cleaned event files. If a bin has >2000 counts, and if more than 50% of those come from <1% of pixels, then it is considered to be noise-dominated and hence unusable.
| Quadrant | # 1 sec bins | Bins with >0 counts | Bins with >2000 counts | High rate bins dominated by noise | Noise dominated (total time) | Noise dominated (detector-on time) | Marked lightcurve |
|---|---|---|---|---|---|---|---|
| A | 7235 | 5534 | 29 | 29 | 0.40% | 0.52% | 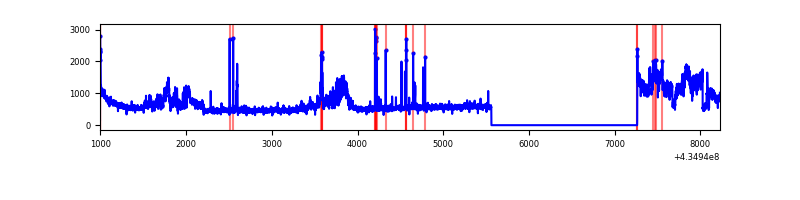 |
| B | 7235 | 5534 | 2 | 2 | 0.03% | 0.04% | 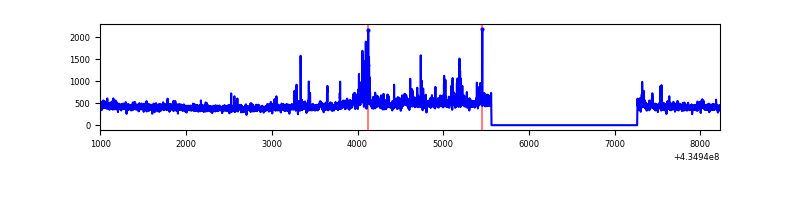 |
| C | 7235 | 5534 | 4 | 4 | 0.06% | 0.07% | 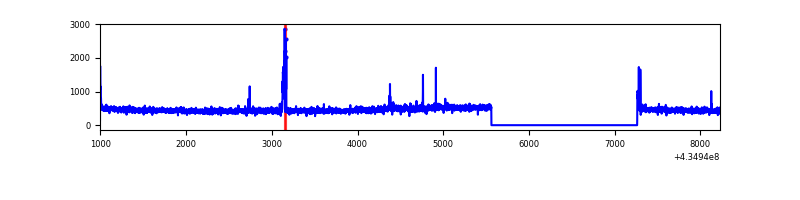 |
| D | 7235 | 5534 | 485 | 485 | 6.70% | 8.76% | 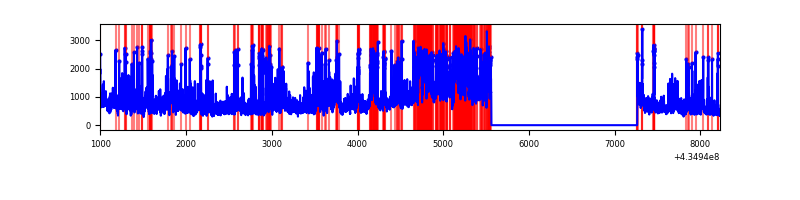 |
Top three noisy pixels from each quadrant. If the there are fewer than three noisy pixels in the level2.evt file, extra rows are filled as -1
| Pixel properties | Quadrant properties | ||||||
|---|---|---|---|---|---|---|---|
| Quadrant | DetID | PixID | Counts | Sigma | Mean | Median | Sigma |
| A | 15 | 237 | 1091779 | 9192.73 | 576 | 564 | 118.7 |
| A | 10 | 83 | 618328 | 5204.23 | 576 | 564 | 118.7 |
| A | 15 | 222 | 22445 | 184.33 | 576 | 564 | 118.7 |
| B | 0 | 189 | 120985 | 1072.81 | 578 | 563 | 112.2 |
| B | 0 | 245 | 58670 | 517.66 | 578 | 563 | 112.2 |
| B | 0 | 186 | 39836 | 349.87 | 578 | 563 | 112.2 |
| C | 15 | 214 | 227602 | 1709.98 | 567 | 571 | 132.8 |
| C | 3 | 233 | 68967 | 515.15 | 567 | 571 | 132.8 |
| C | 14 | 254 | 57372 | 427.82 | 567 | 571 | 132.8 |
| D | 2 | 16 | 1065354 | 7998.63 | 542 | 526 | 133.1 |
| D | 1 | 52 | 1039173 | 7801.97 | 542 | 526 | 133.1 |
| D | 13 | 249 | 422548 | 3170.09 | 542 | 526 | 133.1 |
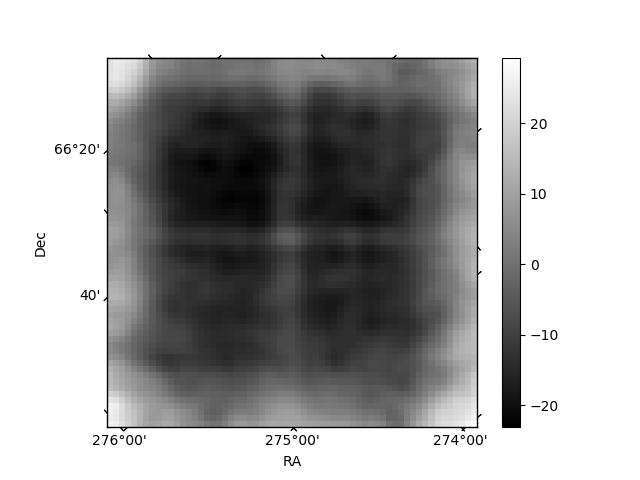
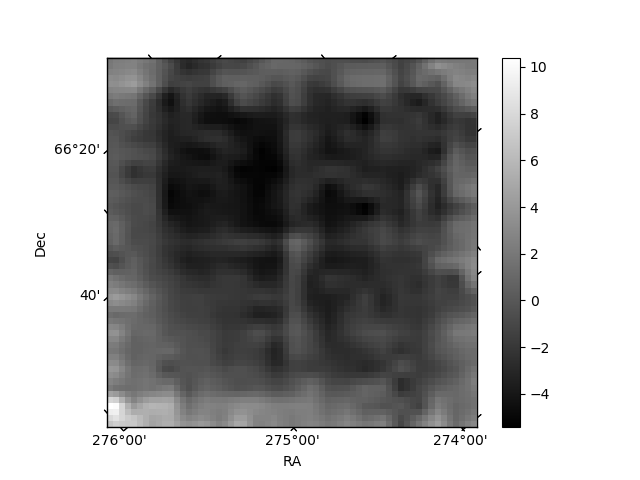
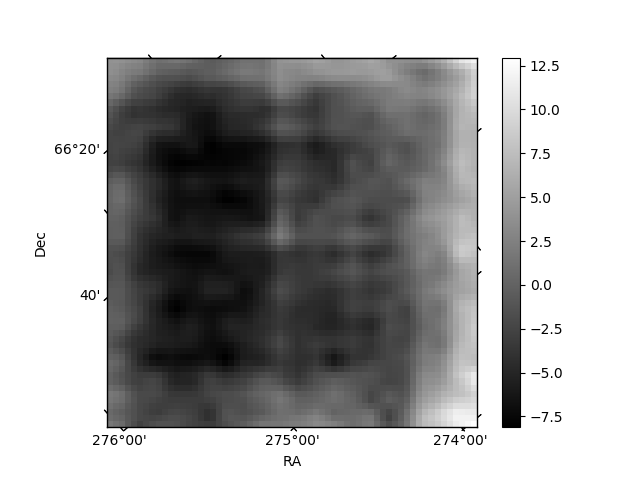
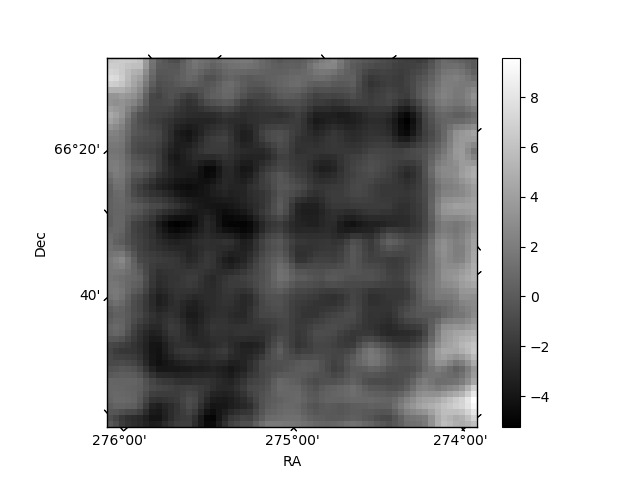
Histogram calculated using DETX and DETY for each event in the final _common_clean file
| Quadrant A | 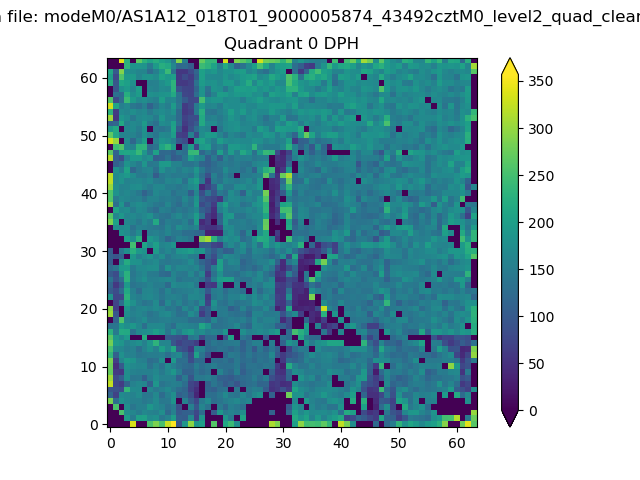 |
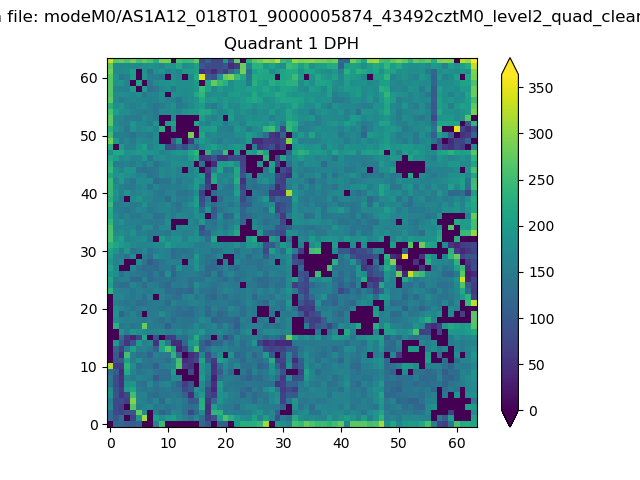 |
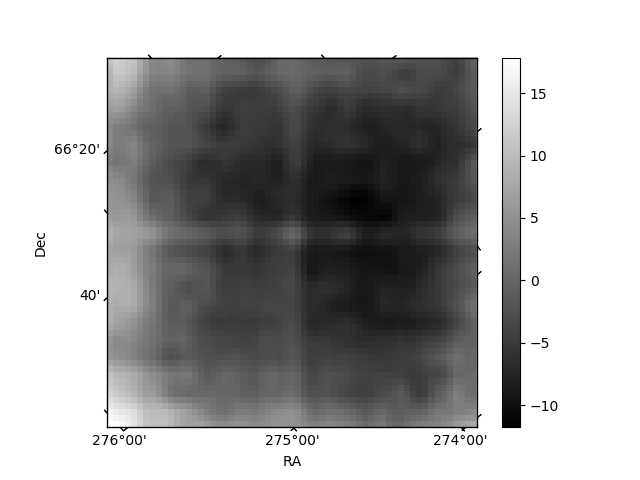
Quadrant B |
|---|---|---|---|
| Quadrant D | 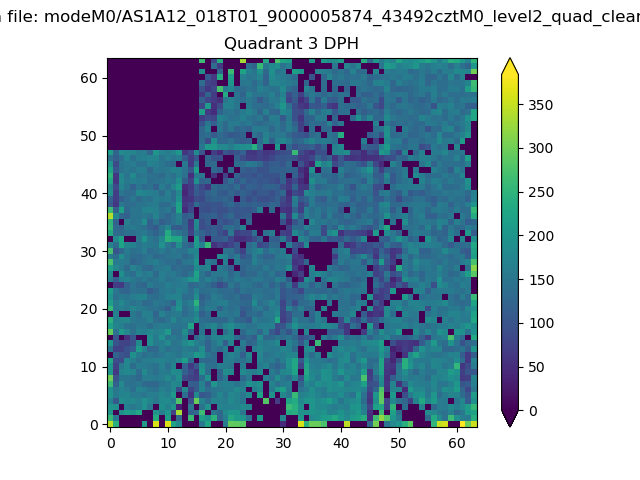 |
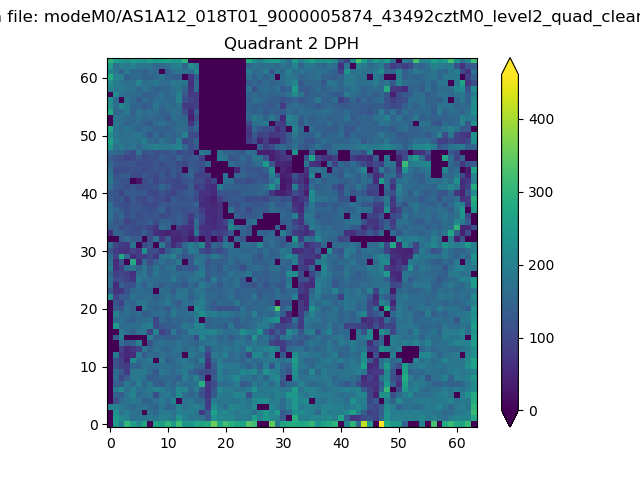 |
Quadrant C |
| Plot type | Count rate plots | Images |
|---|---|---|
| Comparison with Poisson distribution Blue bars denote a histogram of data divided into 1 sec bins. Red curve is a Poisson curve with rate = median count rate of data. |
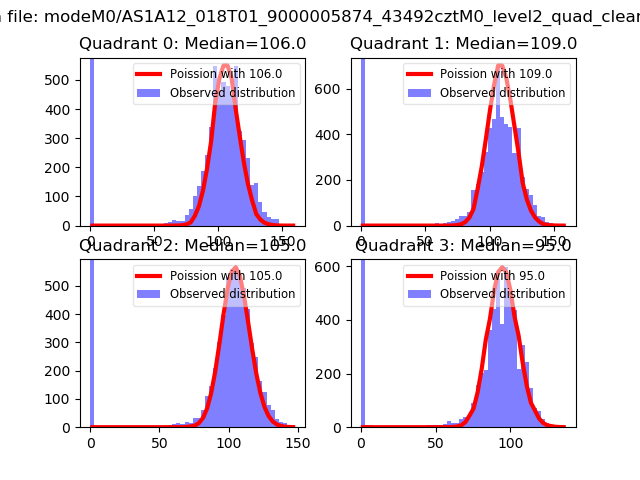 |
 |
| Quadrant-wise count rates Data is divided into 100 sec bins |
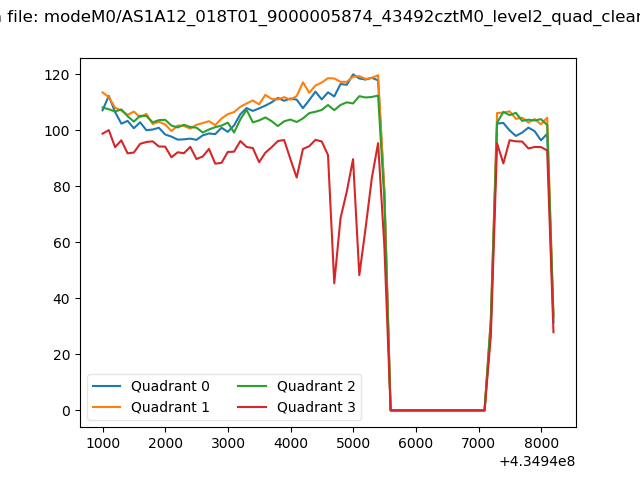 |
|
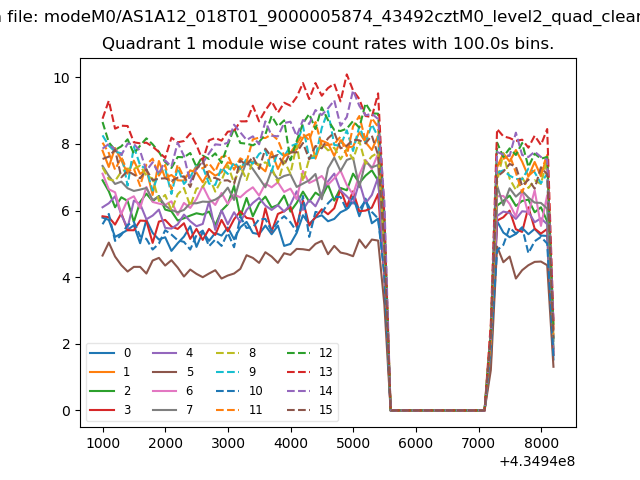
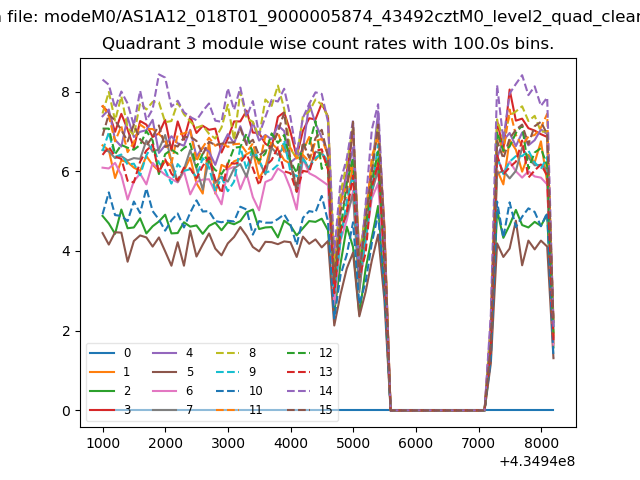
| Module-wise count rates for Quadrant A Data is divided into 100 sec bins |
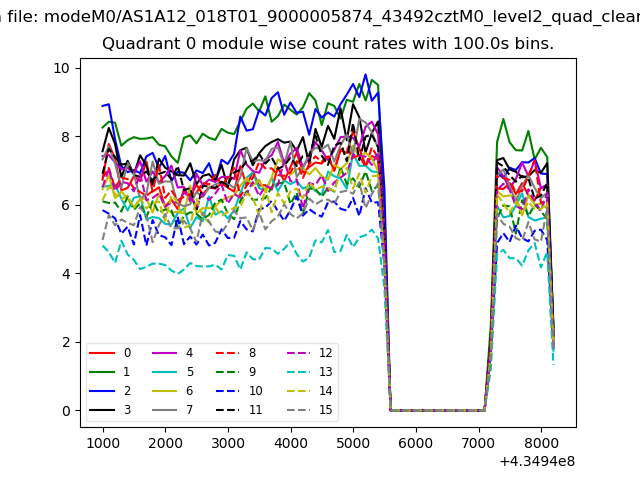 |
 |
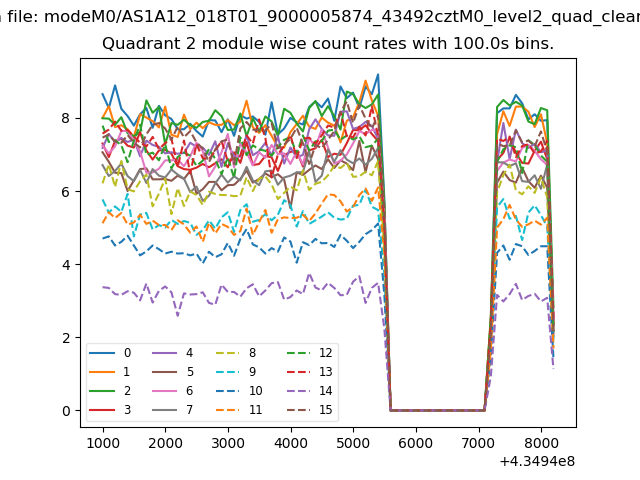
| Module-wise count rates for Quadrant B Data is divided into 100 sec bins |
 |
 |
| Module-wise count rates for Quadrant C Data is divided into 100 sec bins |
 |
 |
| Module-wise count rates for Quadrant D Data is divided into 100 sec bins |
 |
 |
| Parameter | Plot |
|---|---|
| CZT HV Monitor | 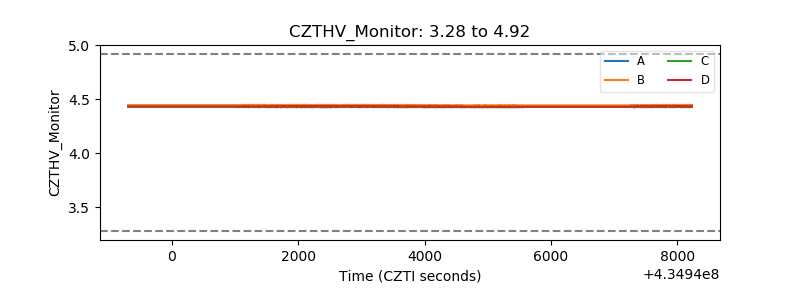 |
| D_VDD | 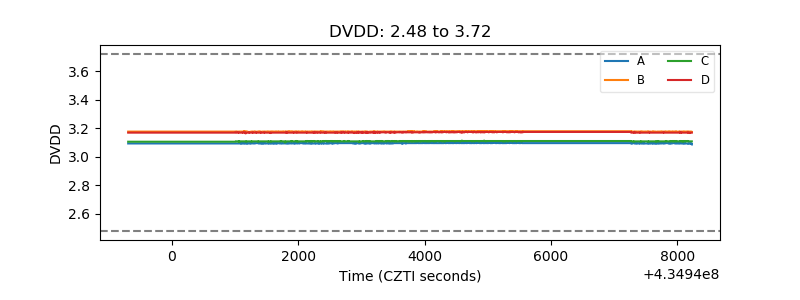 |
| Temperature 1 | 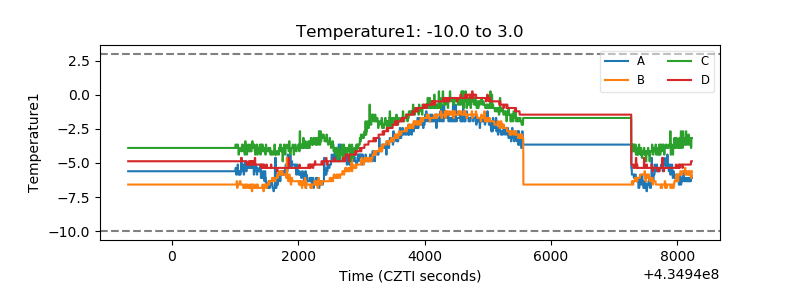 |
| Veto HV Monitor | 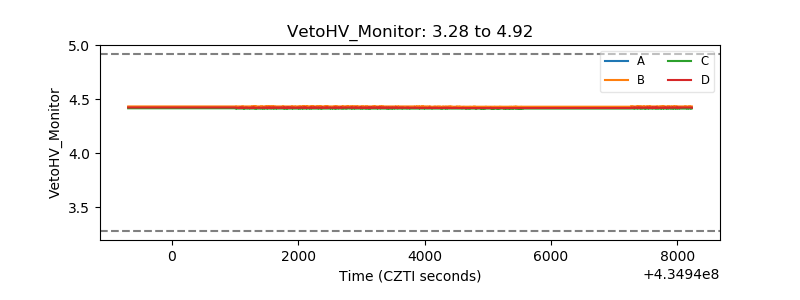 |
| Veto LLD | 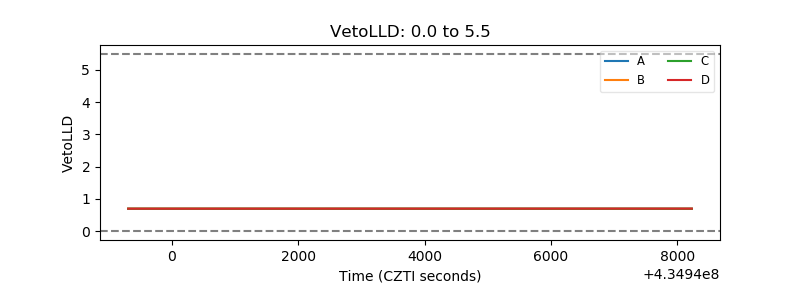 |
| Alpha Counter | 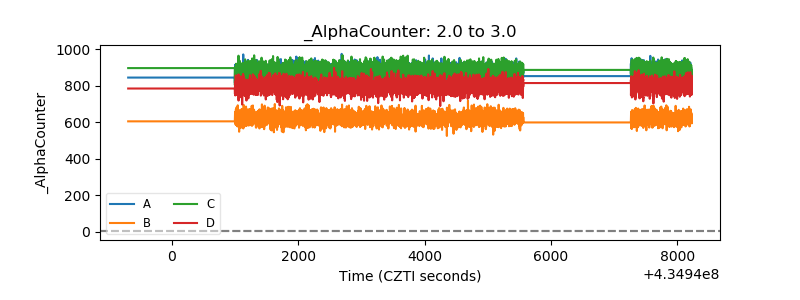 |
| _CPM_Rate | 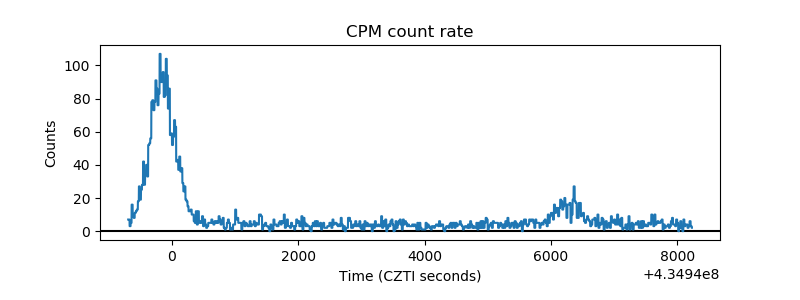 |
| CZT Counter | 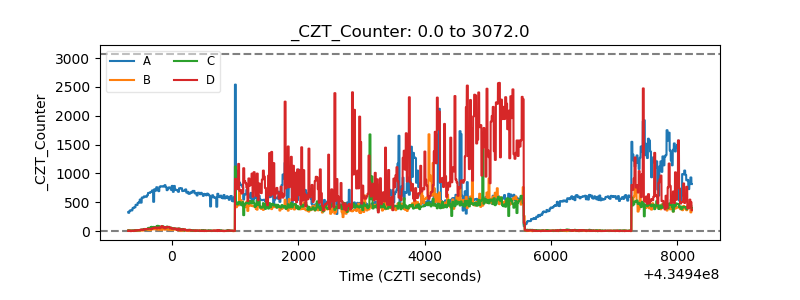 |
| +2.5 Volts monitor | 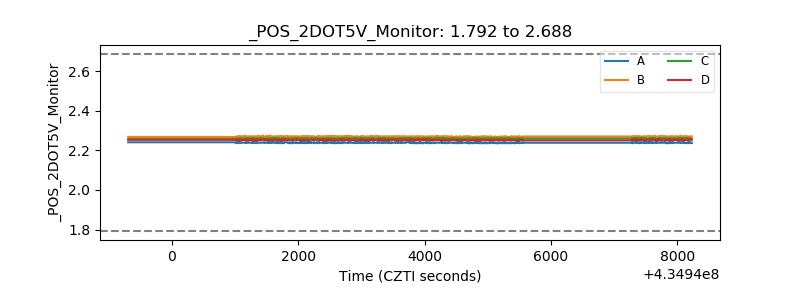 |
| +5 Volts monitor | 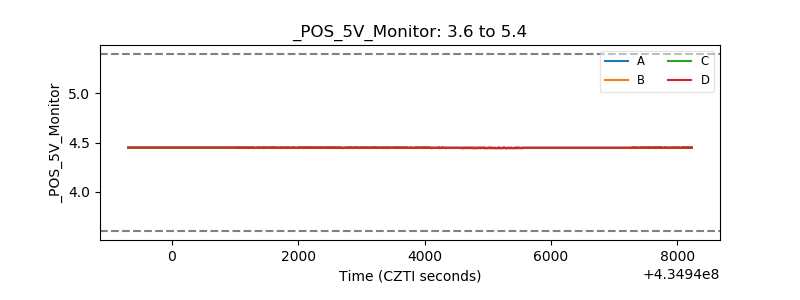 |
| _ROLL_ROT | 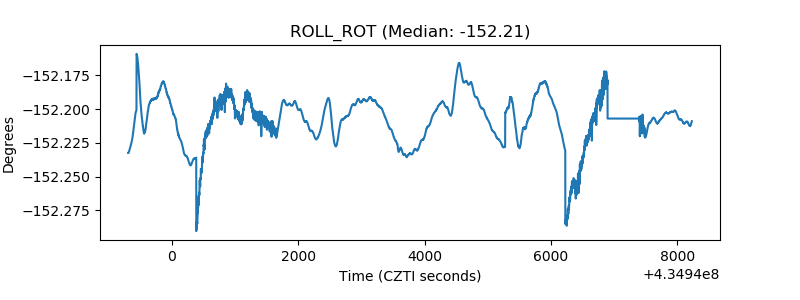 |
| _Roll_DEC |  |
| _Roll_RA | 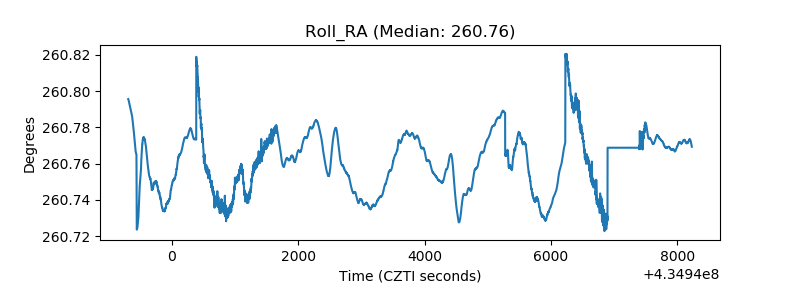 |
| Veto Counter | 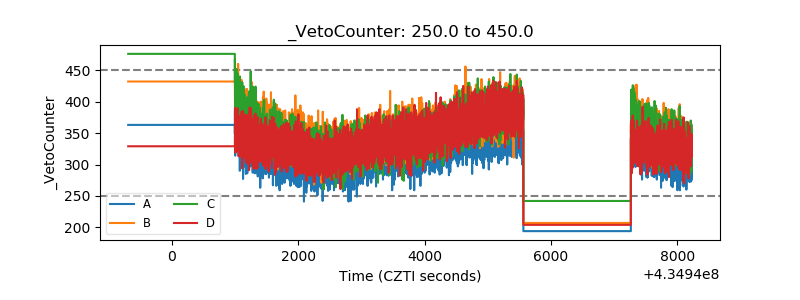 |