| Param | Original file | Final file |
|---|---|---|
| Filename | modeM0/AS1A12_018T01_9000005874_43493cztM0_level2.fits | modeM0/AS1A12_018T01_9000005874_43493cztM0_level2_quad_clean.evt |
| Size (bytes) | 458,524,800 | 88,133,760 |
| Size | 437.3 MB | 84.1 MB |
| Events in quadrant A | 5,144,658 | 582,301 |
| Events in quadrant B | 2,627,818 | 618,169 |
| Events in quadrant C | 2,764,797 | 590,801 |
| Events in quadrant D | 5,995,582 | 479,891 |
| Mode M0 | |||
|---|---|---|---|
| Quadrant | BADHDUFLAG | Total packets | Discarded packets |
| A | 0 | 18766 | 1 |
| B | 0 | 11915 | 2 |
| C | 0 | 11932 | 1 |
| D | 0 | 21825 | 1 |
| Mode M9 | |||
|---|---|---|---|
| Quadrant | BADHDUFLAG | Total packets | Discarded packets |
| A | 0 | 13 | 0 |
| B | 0 | 13 | 0 |
| C | 0 | 13 | 0 |
| D | 0 | 13 | 0 |
| Mode SS | |||
|---|---|---|---|
| Quadrant | BADHDUFLAG | Total packets | Discarded packets |
| A | 0 | 118 | 0 |
| B | 0 | 118 | 0 |
| C | 0 | 118 | 0 |
| D | 0 | 118 | 0 |
| Quadrant | Total seconds | Saturated seconds | Saturation percentage |
|---|---|---|---|
| A | 5672 | 280 | 4.936530% |
| B | 5671 | 14 | 0.246870% |
| C | 5671 | 8 | 0.141069% |
| D | 5671 | 804 | 14.177394% |
Noise dominated data is calculated using 1-second bins in cleaned event files. If a bin has >2000 counts, and if more than 50% of those come from <1% of pixels, then it is considered to be noise-dominated and hence unusable.
| Quadrant | # 1 sec bins | Bins with >0 counts | Bins with >2000 counts | High rate bins dominated by noise | Noise dominated (total time) | Noise dominated (detector-on time) | Marked lightcurve |
|---|---|---|---|---|---|---|---|
| A | 7044 | 5673 | 280 | 280 | 3.98% | 4.94% | 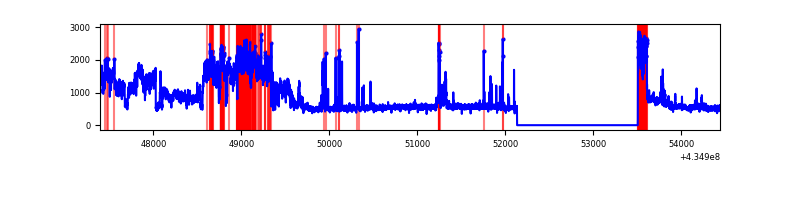 |
| B | 7043 | 5672 | 5 | 5 | 0.07% | 0.09% | 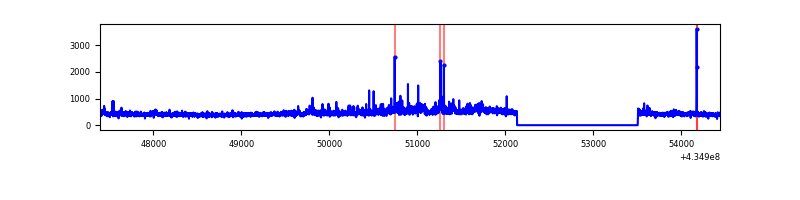 |
| C | 7043 | 5672 | 4 | 4 | 0.06% | 0.07% | 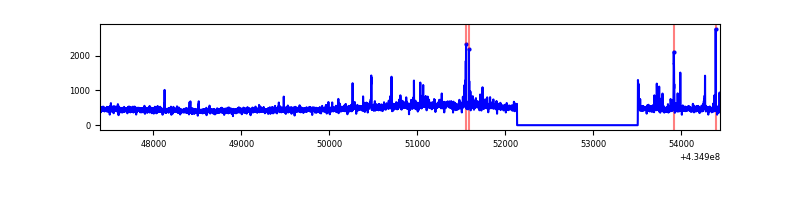 |
| D | 7042 | 5671 | 825 | 825 | 11.72% | 14.55% | 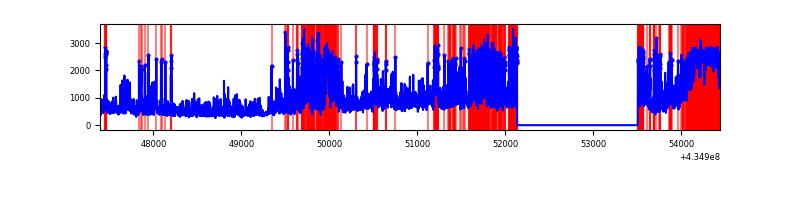 |
Top three noisy pixels from each quadrant. If the there are fewer than three noisy pixels in the level2.evt file, extra rows are filled as -1
| Pixel properties | Quadrant properties | ||||||
|---|---|---|---|---|---|---|---|
| Quadrant | DetID | PixID | Counts | Sigma | Mean | Median | Sigma |
| A | 15 | 237 | 2260772 | 18522.68 | 590 | 577 | 122.0 |
| A | 10 | 83 | 578347 | 4734.92 | 590 | 577 | 122.0 |
| A | 13 | 6 | 15426 | 121.69 | 590 | 577 | 122.0 |
| B | 0 | 245 | 102141 | 869.63 | 596 | 578 | 116.8 |
| B | 0 | 189 | 101940 | 867.91 | 596 | 578 | 116.8 |
| B | 5 | 255 | 17409 | 144.12 | 596 | 578 | 116.8 |
| C | 15 | 214 | 234109 | 1716.68 | 585 | 588 | 136.0 |
| C | 3 | 233 | 160744 | 1177.35 | 585 | 588 | 136.0 |
| C | 5 | 250 | 78549 | 573.11 | 585 | 588 | 136.0 |
| D | 2 | 16 | 1016610 | 7524.87 | 549 | 532 | 135.0 |
| D | 1 | 52 | 894773 | 6622.57 | 549 | 532 | 135.0 |
| D | 1 | 20 | 804998 | 5957.71 | 549 | 532 | 135.0 |
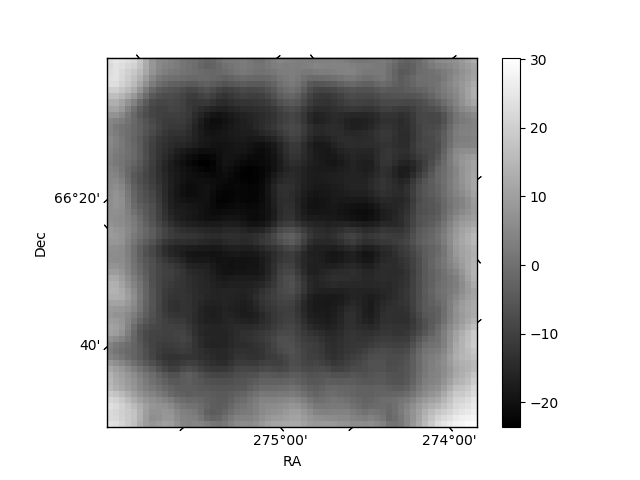
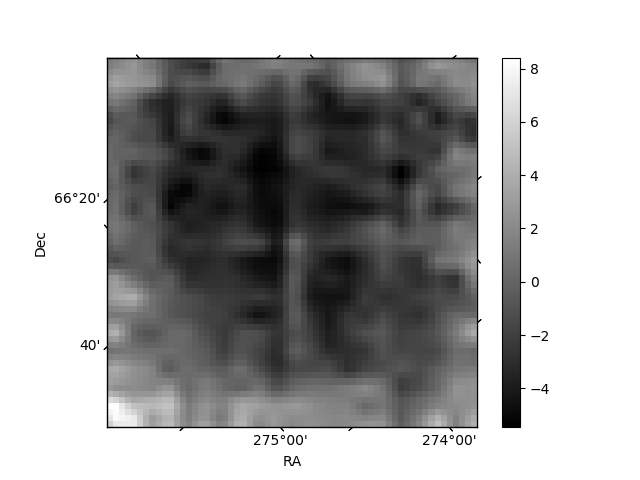
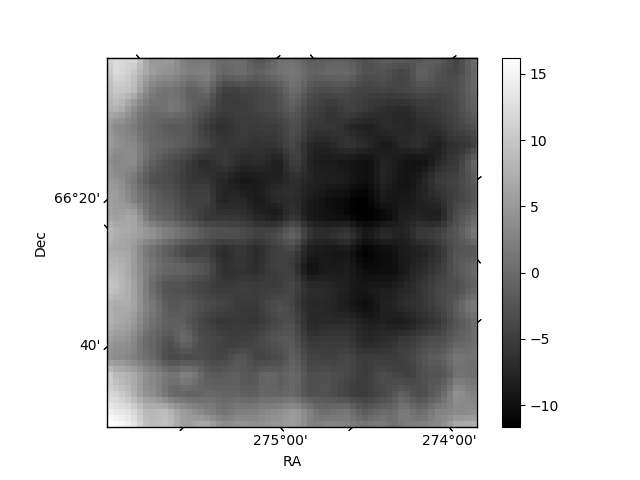
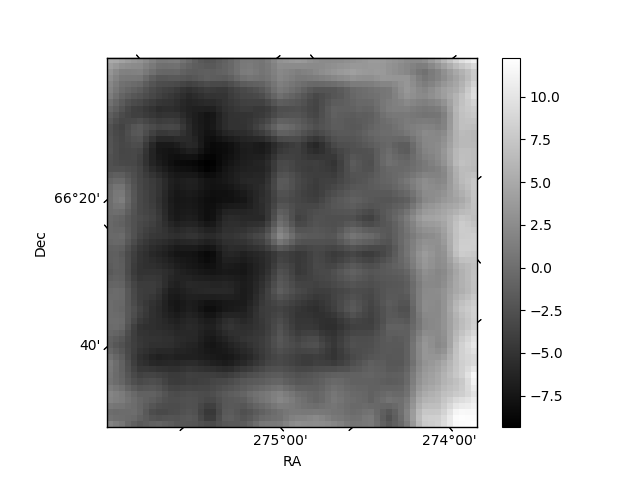
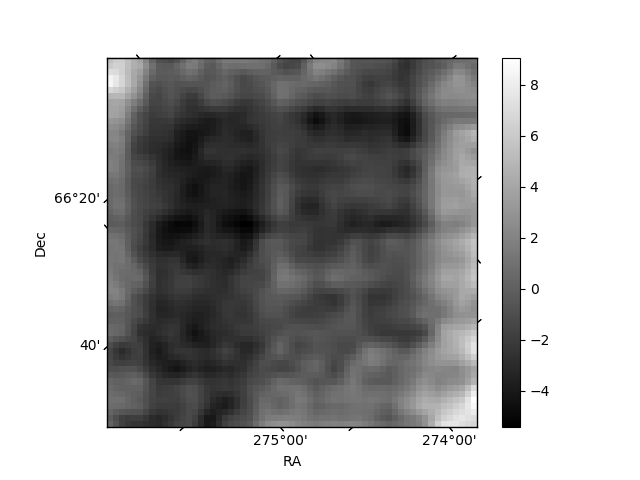
Histogram calculated using DETX and DETY for each event in the final _common_clean file
| Quadrant A | 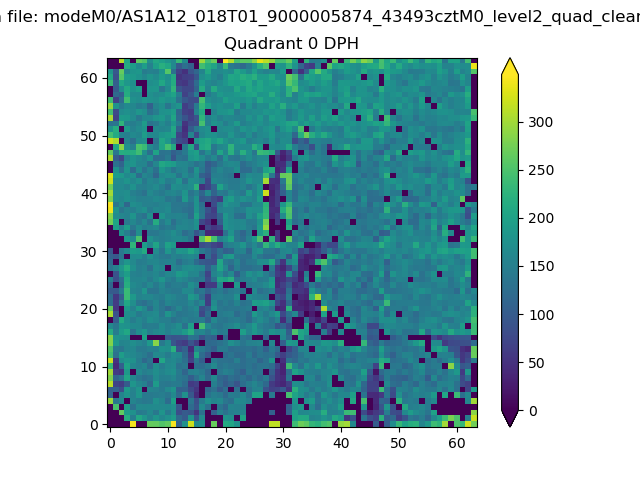 |
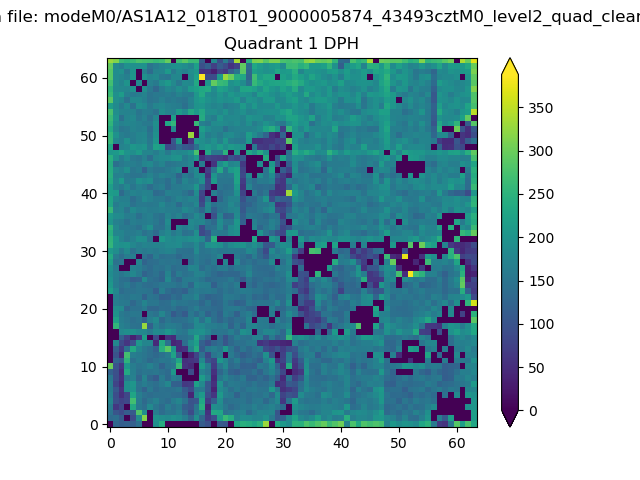 |
Quadrant B |
|---|---|---|---|
| Quadrant D | 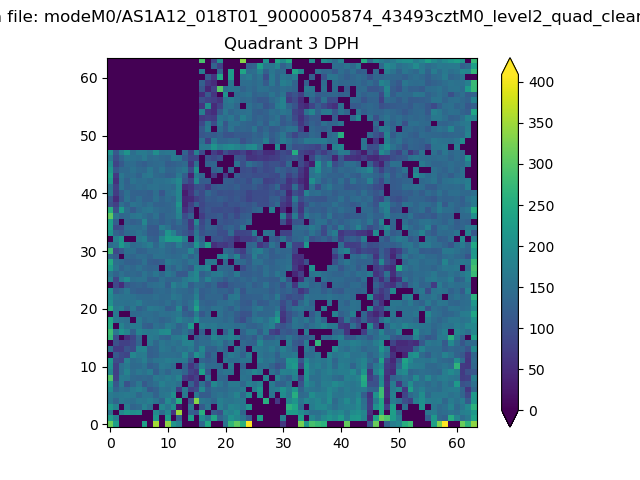 |
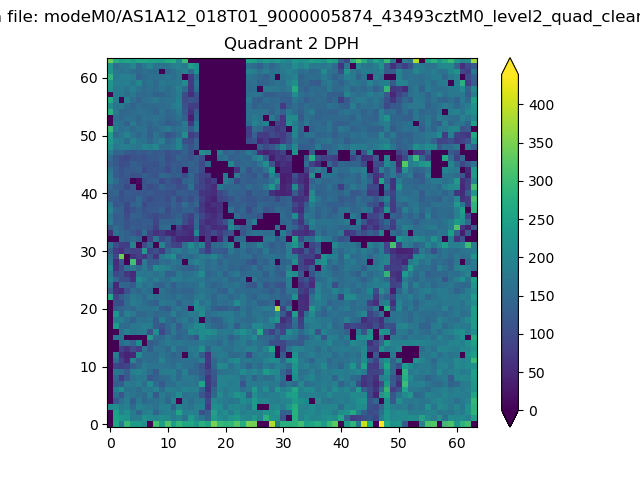 |
Quadrant C |
| Plot type | Count rate plots | Images |
|---|---|---|
| Comparison with Poisson distribution Blue bars denote a histogram of data divided into 1 sec bins. Red curve is a Poisson curve with rate = median count rate of data. |
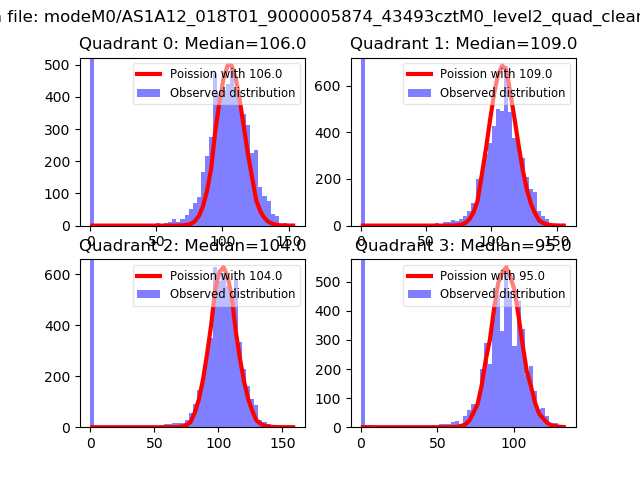 |
 |
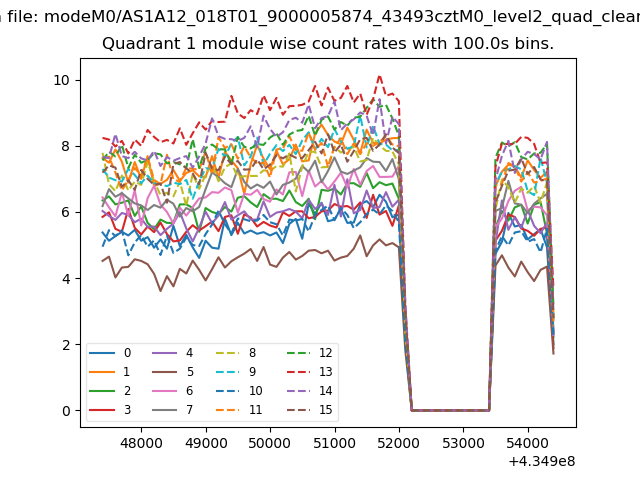
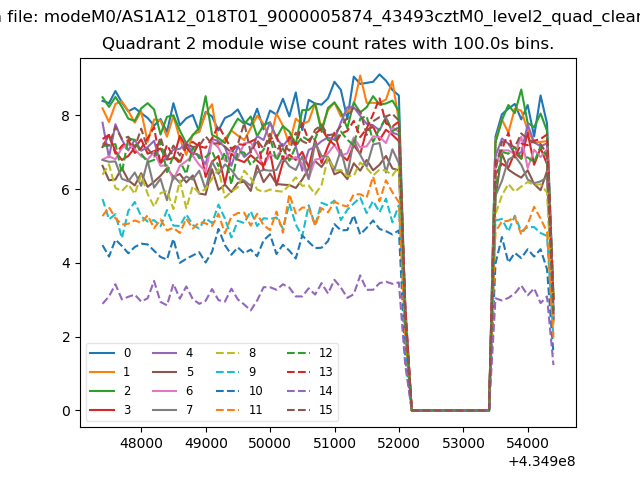
| Quadrant-wise count rates Data is divided into 100 sec bins |
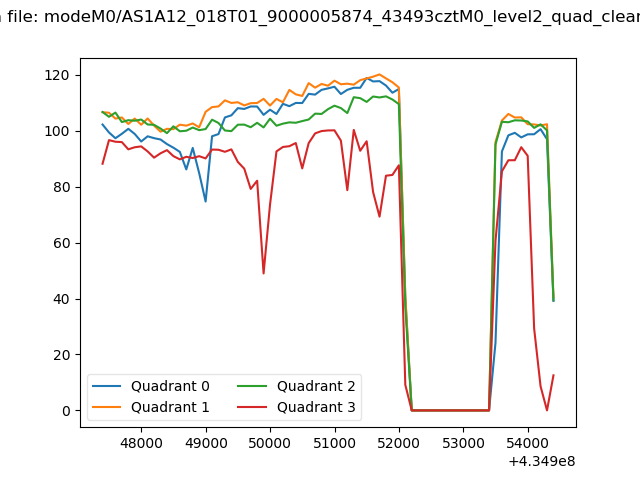 |
|
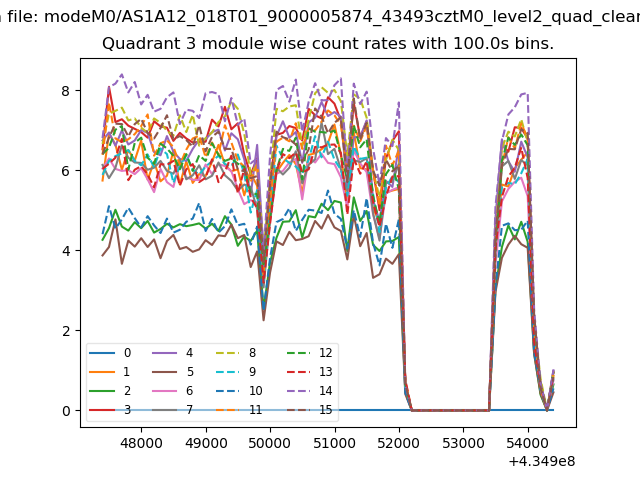
| Module-wise count rates for Quadrant A Data is divided into 100 sec bins |
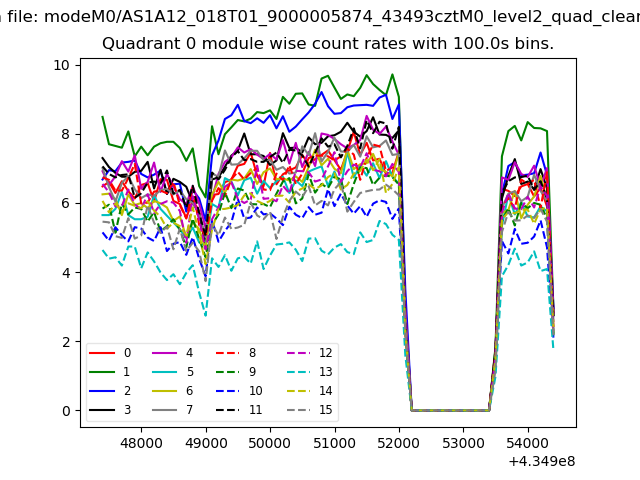 |
 |
| Module-wise count rates for Quadrant B Data is divided into 100 sec bins |
 |
 |
| Module-wise count rates for Quadrant C Data is divided into 100 sec bins |
 |
 |
| Module-wise count rates for Quadrant D Data is divided into 100 sec bins |
 |
 |
| Parameter | Plot |
|---|---|
| CZT HV Monitor |  |
| D_VDD | 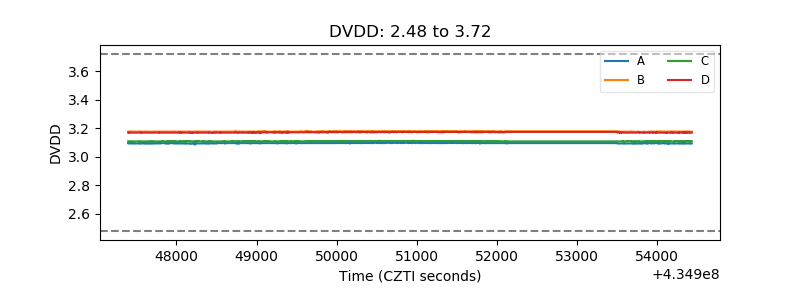 |
| Temperature 1 | 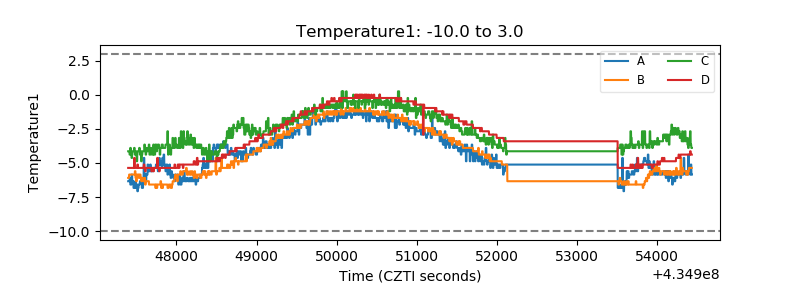 |
| Veto HV Monitor | 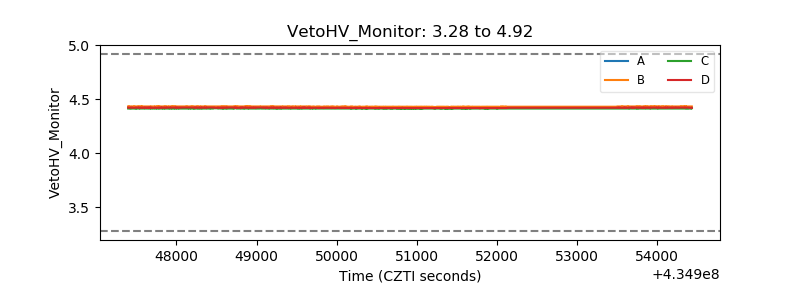 |
| Veto LLD | 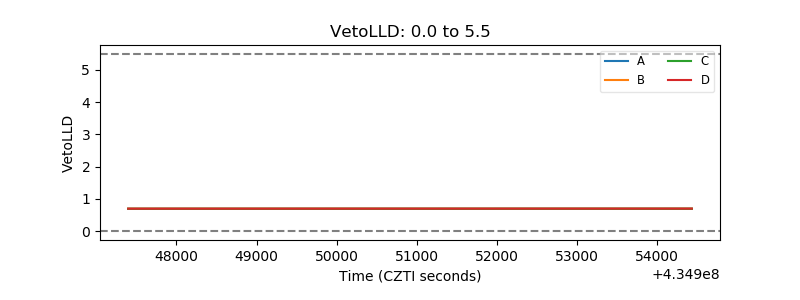 |
| Alpha Counter | 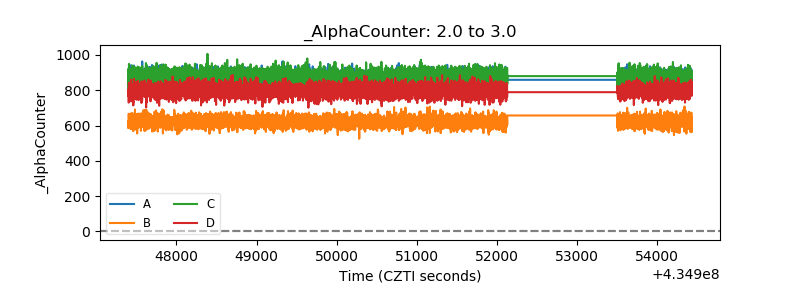 |
| _CPM_Rate | 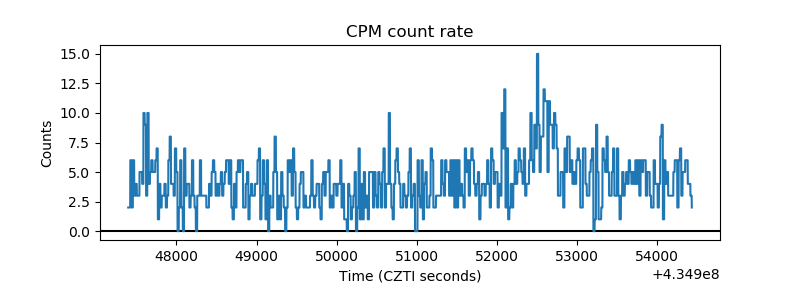 |
| CZT Counter | 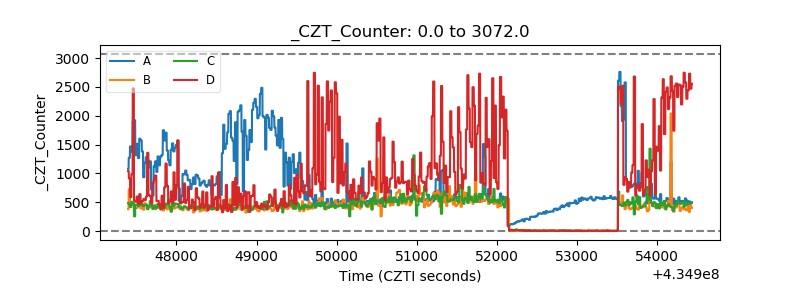 |
| +2.5 Volts monitor | 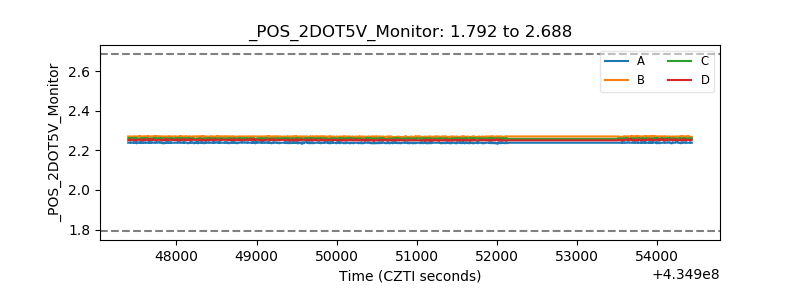 |
| +5 Volts monitor | 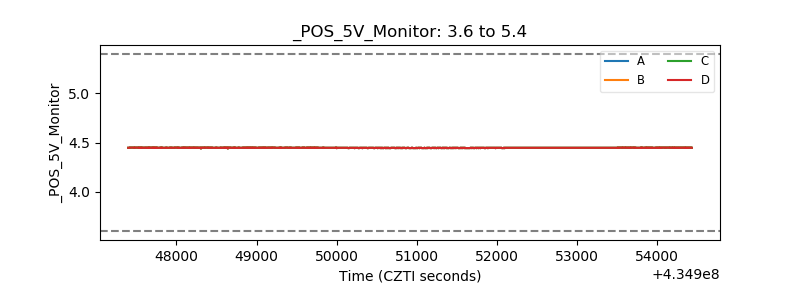 |
| _ROLL_ROT | 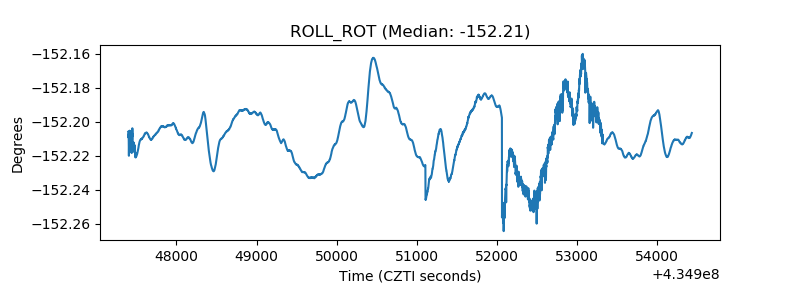 |
| _Roll_DEC | 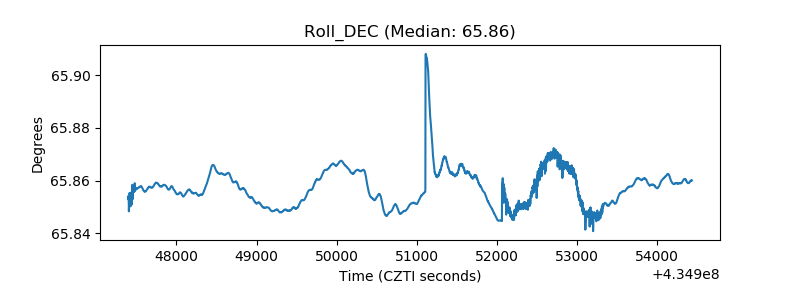 |
| _Roll_RA |  |
| Veto Counter | 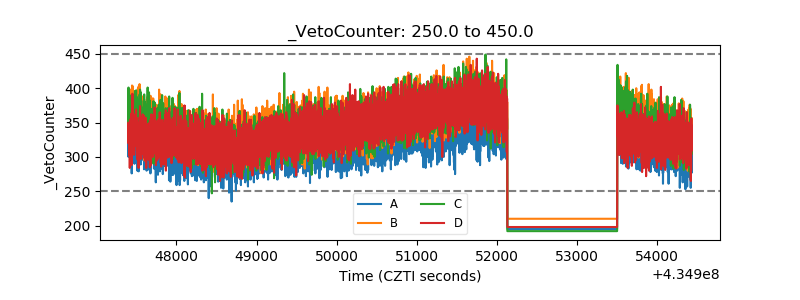 |