| Param | Original file | Final file |
|---|---|---|
| Filename | modeM0/AS1A12_018T01_9000005874_43498cztM0_level2.fits | modeM0/AS1A12_018T01_9000005874_43498cztM0_level2_quad_clean.evt |
| Size (bytes) | 372,769,920 | 89,366,400 |
| Size | 355.5 MB | 85.2 MB |
| Events in quadrant A | 2,941,615 | 605,084 |
| Events in quadrant B | 2,780,823 | 612,203 |
| Events in quadrant C | 2,586,230 | 576,759 |
| Events in quadrant D | 5,059,121 | 523,679 |
| Mode M0 | |||
|---|---|---|---|
| Quadrant | BADHDUFLAG | Total packets | Discarded packets |
| A | 0 | 12010 | 1 |
| B | 0 | 11949 | 1 |
| C | 0 | 11202 | 1 |
| D | 0 | 18948 | 1 |
| Mode M9 | |||
|---|---|---|---|
| Quadrant | BADHDUFLAG | Total packets | Discarded packets |
| A | 0 | 16 | 0 |
| B | 0 | 16 | 0 |
| C | 0 | 16 | 0 |
| D | 0 | 16 | 0 |
| Mode SS | |||
|---|---|---|---|
| Quadrant | BADHDUFLAG | Total packets | Discarded packets |
| A | 0 | 114 | 0 |
| B | 0 | 114 | 0 |
| C | 0 | 114 | 0 |
| D | 0 | 114 | 0 |
| Quadrant | Total seconds | Saturated seconds | Saturation percentage |
|---|---|---|---|
| A | 5542 | 13 | 0.234572% |
| B | 5542 | 37 | 0.667629% |
| C | 5542 | 3 | 0.054132% |
| D | 5542 | 180 | 3.247925% |
Noise dominated data is calculated using 1-second bins in cleaned event files. If a bin has >2000 counts, and if more than 50% of those come from <1% of pixels, then it is considered to be noise-dominated and hence unusable.
| Quadrant | # 1 sec bins | Bins with >0 counts | Bins with >2000 counts | High rate bins dominated by noise | Noise dominated (total time) | Noise dominated (detector-on time) | Marked lightcurve |
|---|---|---|---|---|---|---|---|
| A | 7155 | 5543 | 2 | 2 | 0.03% | 0.04% | 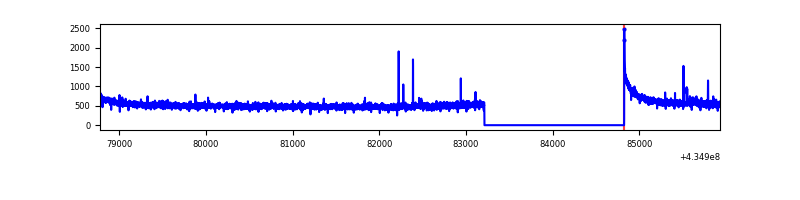 |
| B | 7155 | 5543 | 33 | 33 | 0.46% | 0.60% | 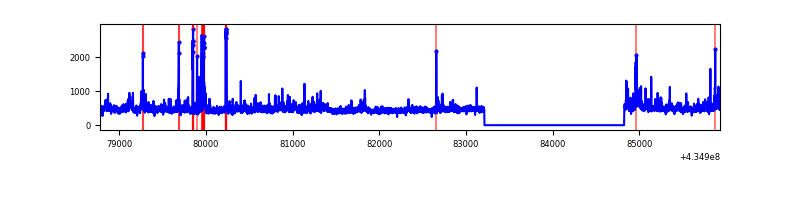 |
| C | 7155 | 5543 | 0 | 0 | 0.00% | 0.00% | 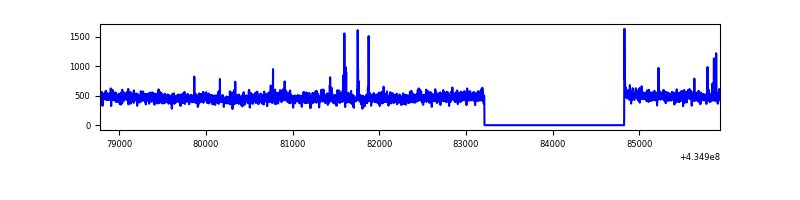 |
| D | 7155 | 5543 | 187 | 187 | 2.61% | 3.37% | 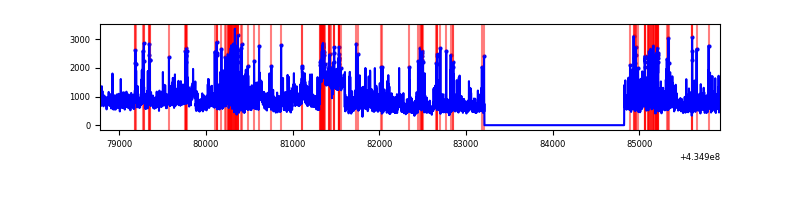 |
Top three noisy pixels from each quadrant. If the there are fewer than three noisy pixels in the level2.evt file, extra rows are filled as -1
| Pixel properties | Quadrant properties | ||||||
|---|---|---|---|---|---|---|---|
| Quadrant | DetID | PixID | Counts | Sigma | Mean | Median | Sigma |
| A | 10 | 83 | 603916 | 4983.11 | 592 | 581 | 121.1 |
| A | 15 | 222 | 30947 | 250.8 | 592 | 581 | 121.1 |
| A | 7 | 3 | 9627 | 74.71 | 592 | 581 | 121.1 |
| B | 0 | 189 | 129529 | 1137.94 | 587 | 570 | 113.3 |
| B | 0 | 245 | 65664 | 574.39 | 587 | 570 | 113.3 |
| B | 15 | 36 | 54992 | 480.22 | 587 | 570 | 113.3 |
| C | 15 | 214 | 225839 | 1679.12 | 576 | 579 | 134.2 |
| C | 3 | 233 | 105252 | 780.25 | 576 | 579 | 134.2 |
| C | 15 | 208 | 6088 | 41.06 | 576 | 579 | 134.2 |
| D | 2 | 16 | 1390868 | 9976.49 | 570 | 552 | 139.4 |
| D | 1 | 52 | 889376 | 6377.94 | 570 | 552 | 139.4 |
| D | 10 | 118 | 86377 | 615.85 | 570 | 552 | 139.4 |
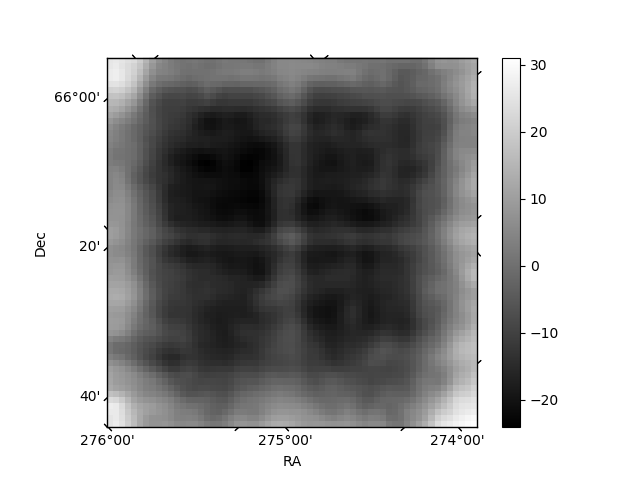
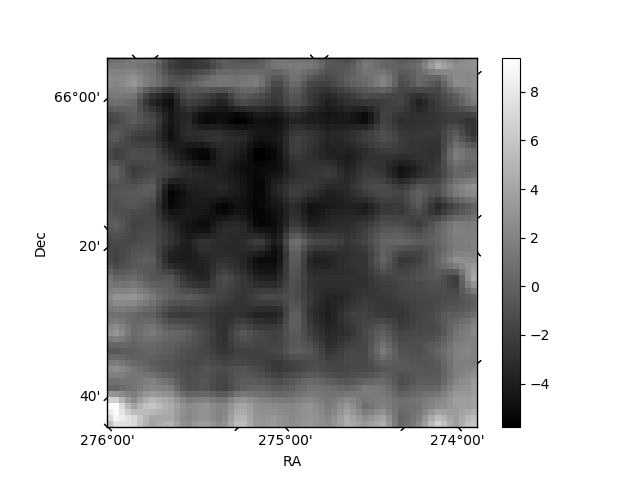
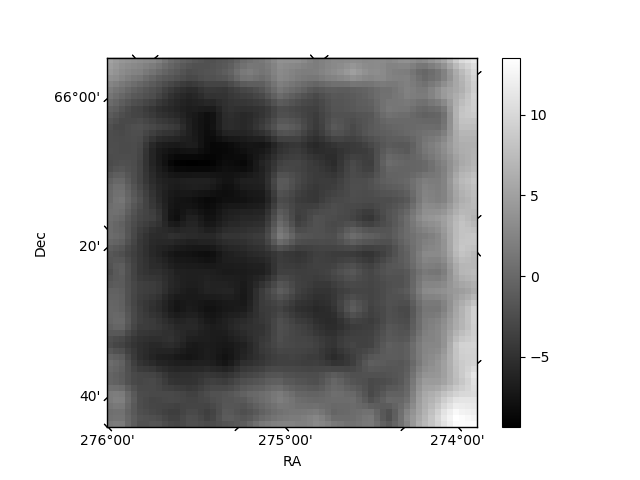
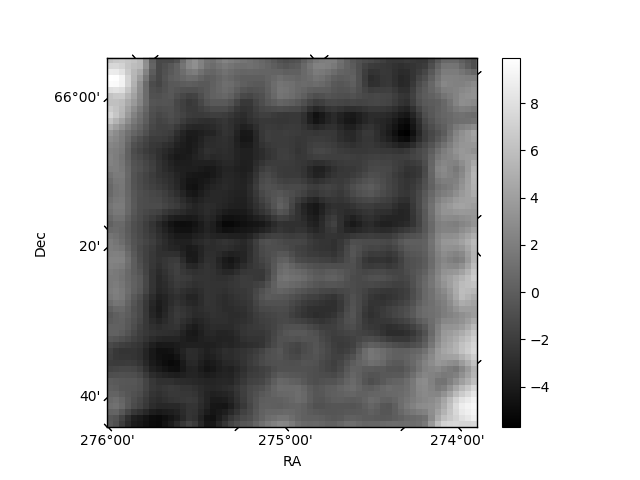
Histogram calculated using DETX and DETY for each event in the final _common_clean file
| Quadrant A | 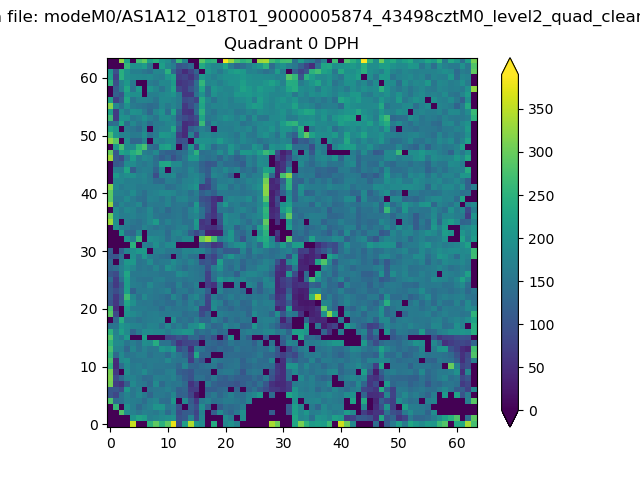 |
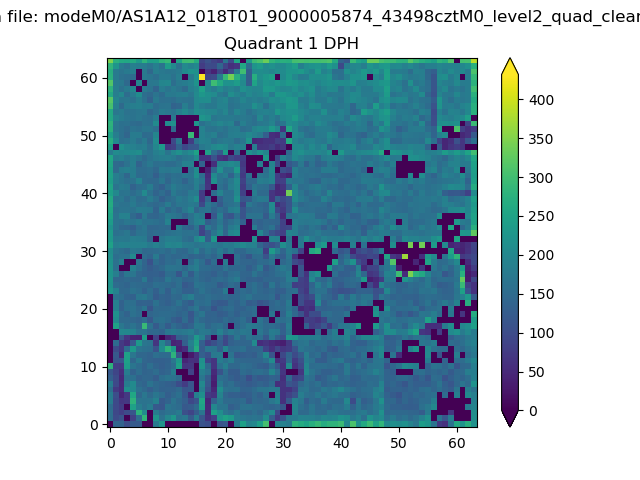 |
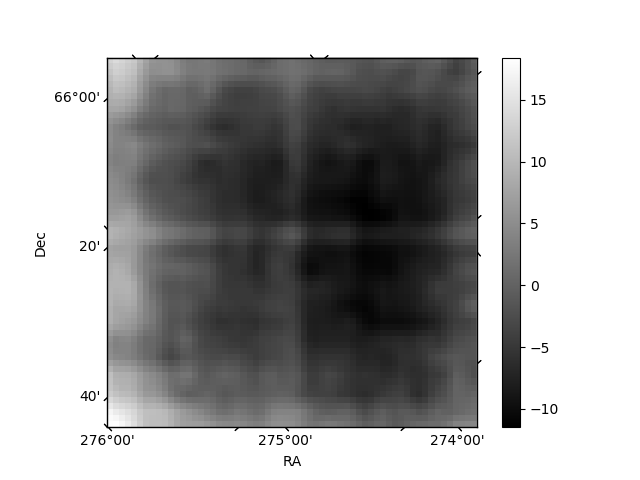
Quadrant B |
|---|---|---|---|
| Quadrant D | 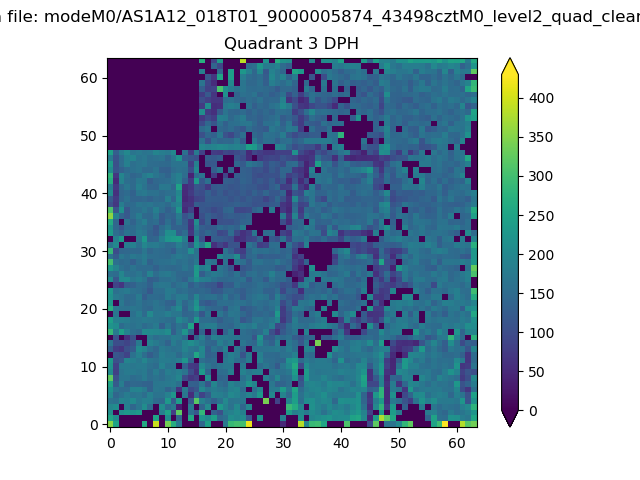 |
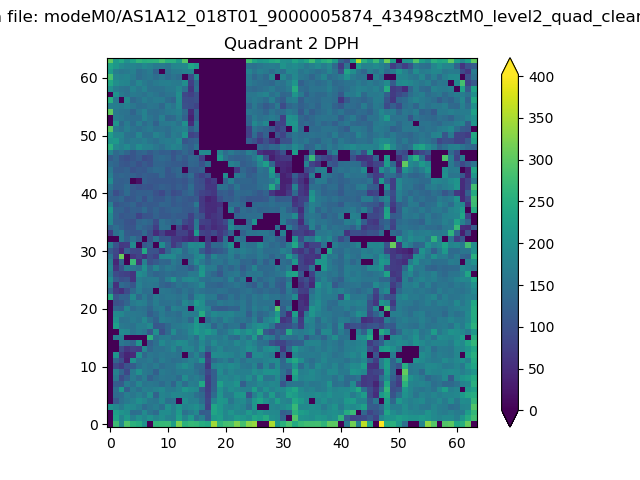 |
Quadrant C |
| Plot type | Count rate plots | Images |
|---|---|---|
| Comparison with Poisson distribution Blue bars denote a histogram of data divided into 1 sec bins. Red curve is a Poisson curve with rate = median count rate of data. |
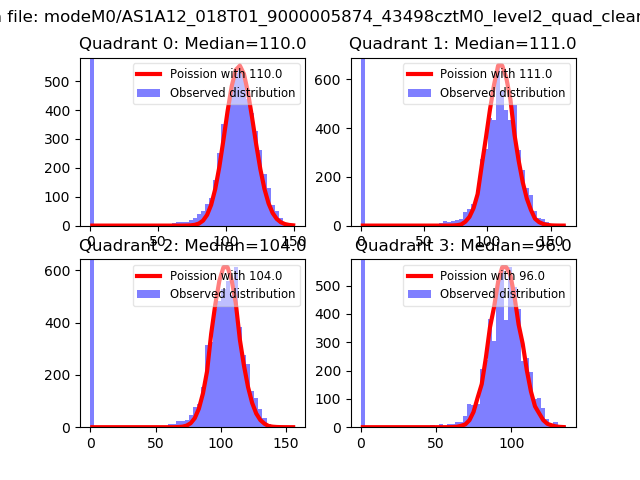 |
 |
| Quadrant-wise count rates Data is divided into 100 sec bins |
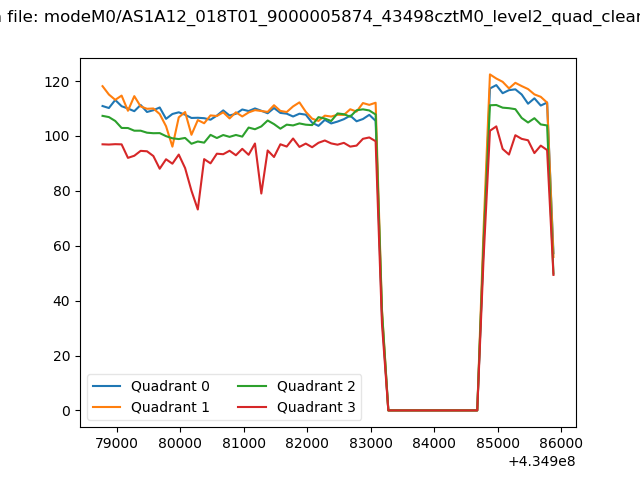 |
|
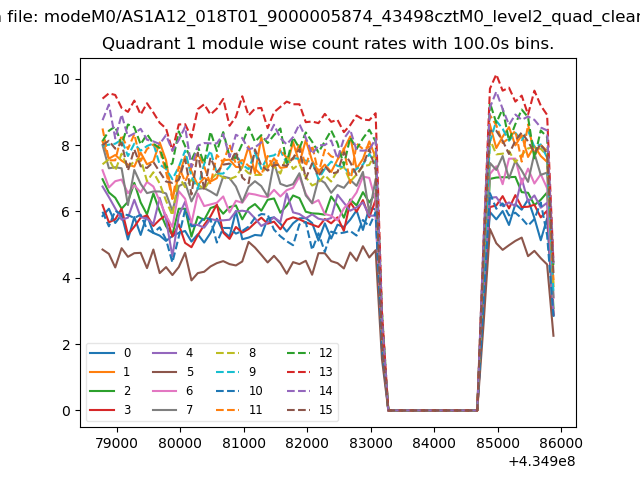
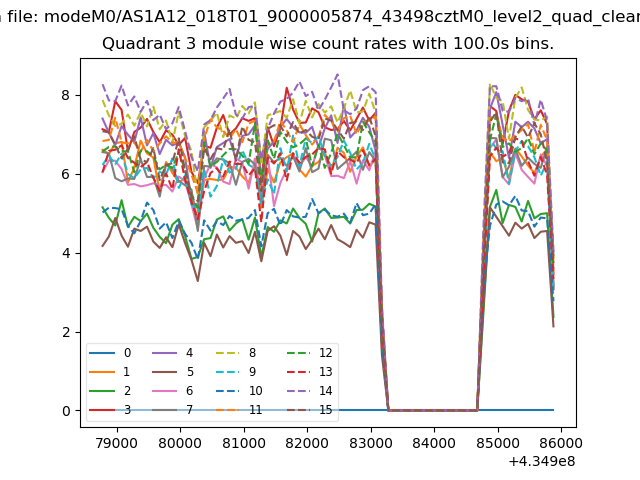
| Module-wise count rates for Quadrant A Data is divided into 100 sec bins |
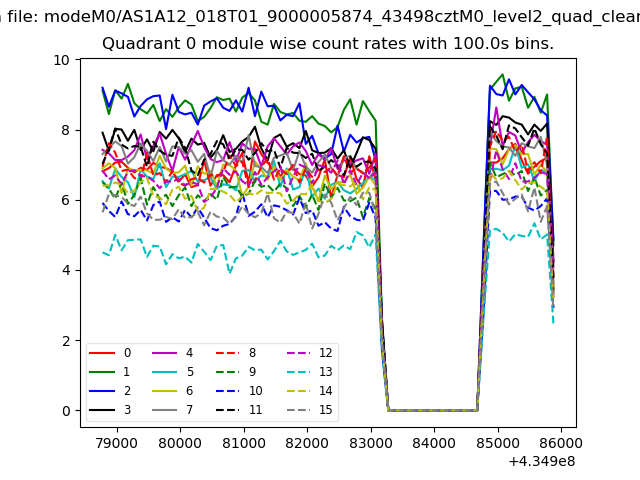 |
 |
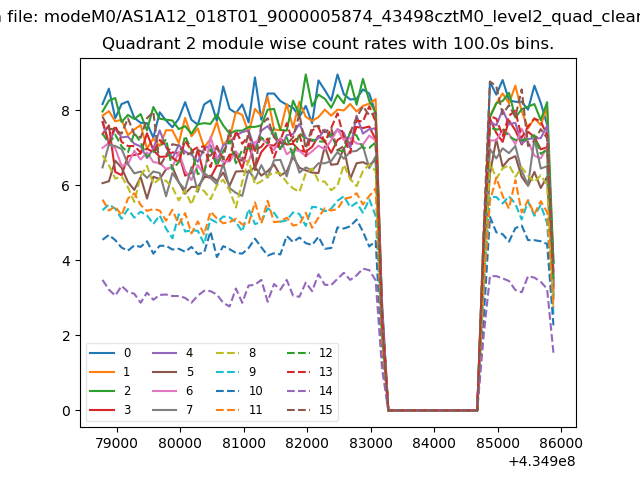
| Module-wise count rates for Quadrant B Data is divided into 100 sec bins |
 |
 |
| Module-wise count rates for Quadrant C Data is divided into 100 sec bins |
 |
 |
| Module-wise count rates for Quadrant D Data is divided into 100 sec bins |
 |
 |
| Parameter | Plot |
|---|---|
| CZT HV Monitor |  |
| D_VDD | 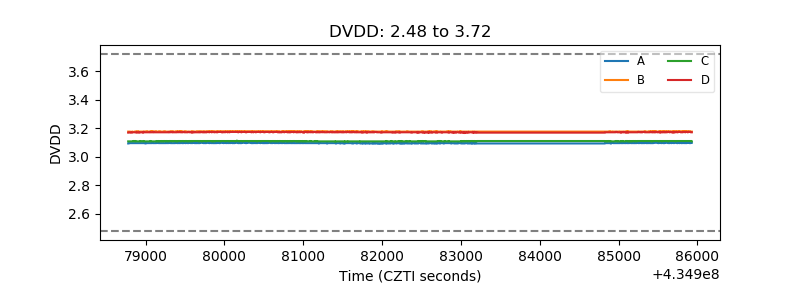 |
| Temperature 1 | 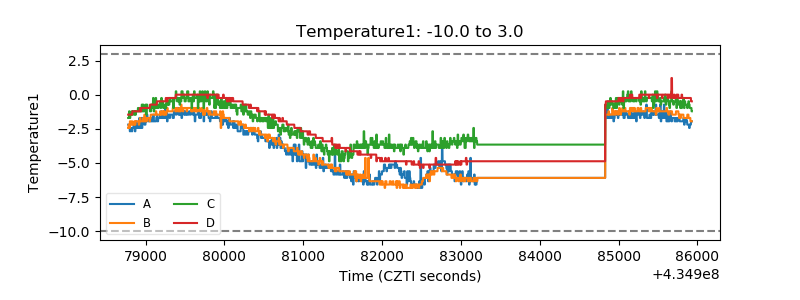 |
| Veto HV Monitor | 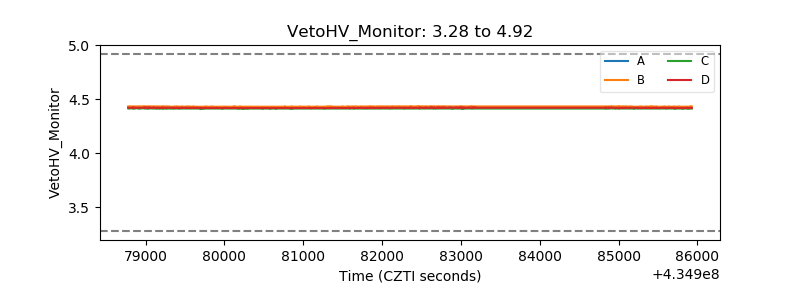 |
| Veto LLD | 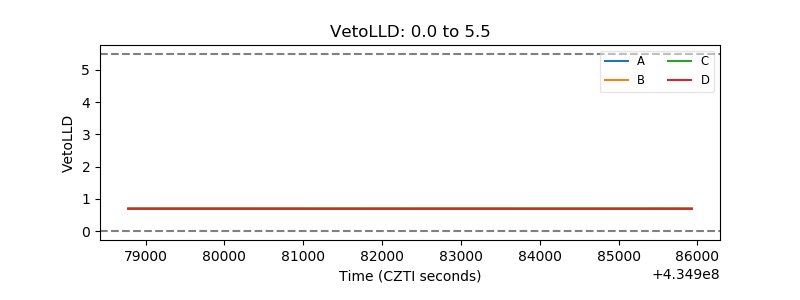 |
| Alpha Counter | 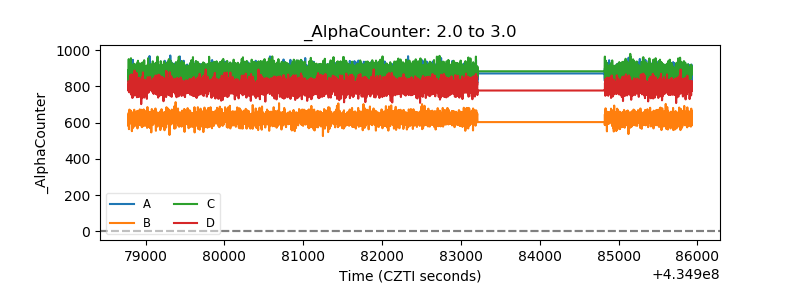 |
| _CPM_Rate | 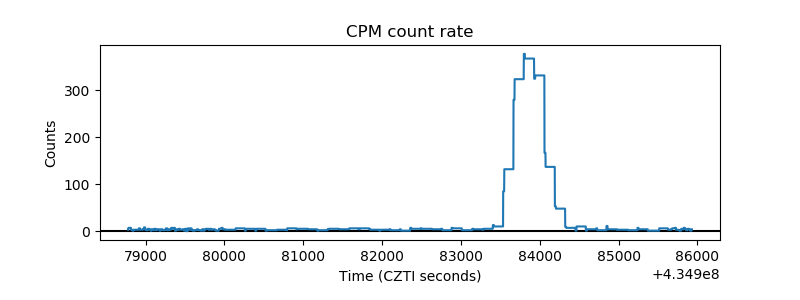 |
| CZT Counter | 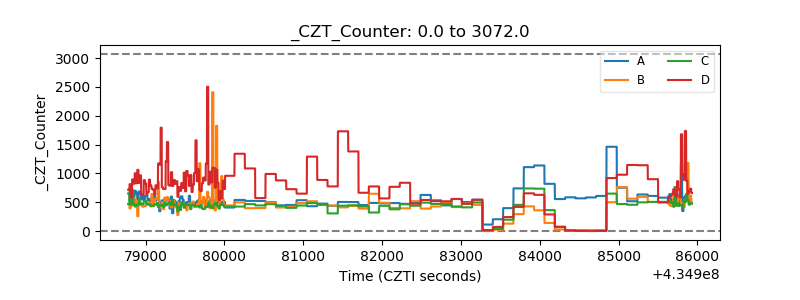 |
| +2.5 Volts monitor | 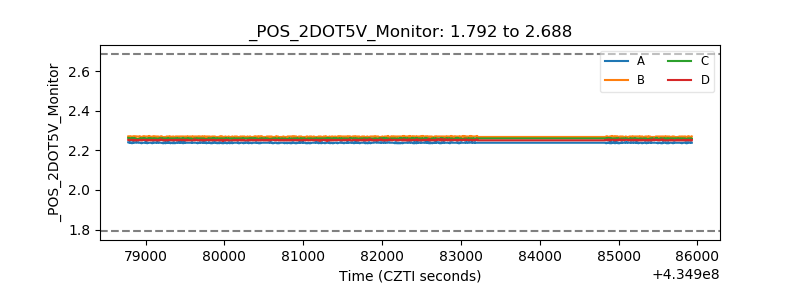 |
| +5 Volts monitor | 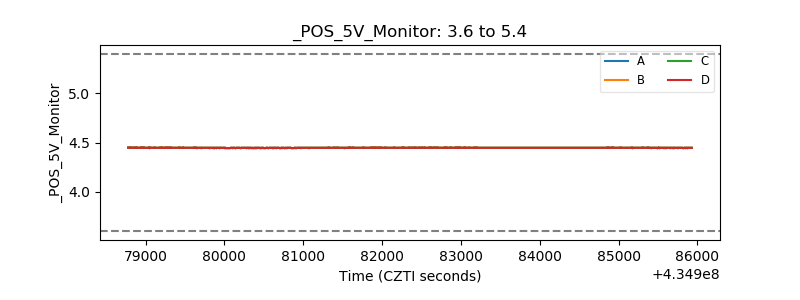 |
| _ROLL_ROT | 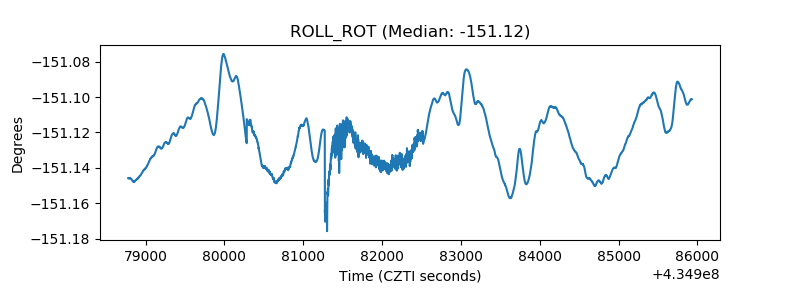 |
| _Roll_DEC | 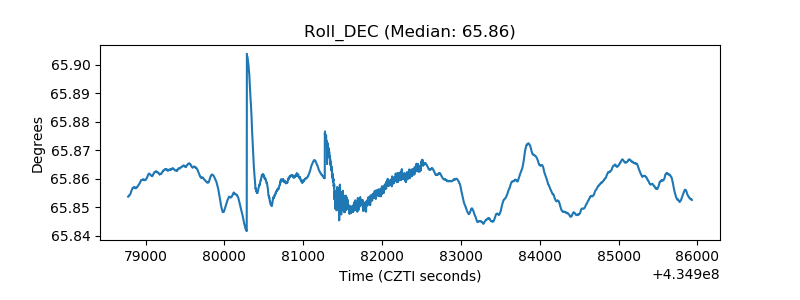 |
| _Roll_RA | 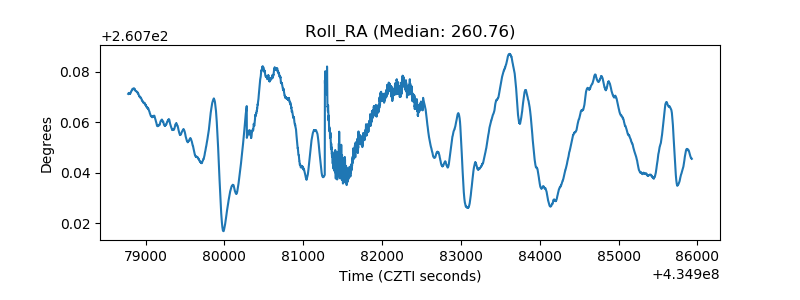 |
| Veto Counter | 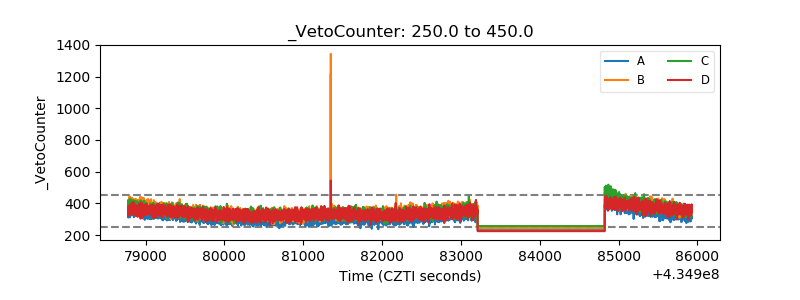 |