| Param | Original file | Final file |
|---|---|---|
| Filename | modeM0/AS1A12_018T01_9000005874_43515cztM0_level2.fits | modeM0/AS1A12_018T01_9000005874_43515cztM0_level2_quad_clean.evt |
| Size (bytes) | 904,417,920 | 60,465,600 |
| Size | 862.5 MB | 57.7 MB |
| Events in quadrant A | 11,742,962 | 583,876 |
| Events in quadrant B | 6,100,481 | 713,502 |
| Events in quadrant C | 12,447,094 | 85,917 |
| Events in quadrant D | 2,700,334 | 4,532 |
| Mode M0 | |||
|---|---|---|---|
| Quadrant | BADHDUFLAG | Total packets | Discarded packets |
| A | 0 | 39177 | 0 |
| B | 0 | 22444 | 0 |
| C | 0 | 41251 | 0 |
| D | 0 | 12245 | 0 |
| Mode M9 | |||
|---|---|---|---|
| Quadrant | BADHDUFLAG | Total packets | Discarded packets |
| A | 0 | 11 | 0 |
| B | 0 | 11 | 0 |
| C | 0 | 11 | 0 |
| D | 0 | 11 | 0 |
| Mode SS | |||
|---|---|---|---|
| Quadrant | BADHDUFLAG | Total packets | Discarded packets |
| A | 0 | 126 | 0 |
| B | 0 | 126 | 0 |
| C | 0 | 126 | 0 |
| D | 0 | 126 | 0 |
| Quadrant | Total seconds | Saturated seconds | Saturation percentage |
|---|---|---|---|
| A | 6235 | 3541 | 56.792302% |
| B | 6235 | 722 | 11.579791% |
| C | 6236 | 6217 | 99.695318% |
| D | 6236 | 6236 | 100.000000% |
Noise dominated data is calculated using 1-second bins in cleaned event files. If a bin has >2000 counts, and if more than 50% of those come from <1% of pixels, then it is considered to be noise-dominated and hence unusable.
| Quadrant | # 1 sec bins | Bins with >0 counts | Bins with >2000 counts | High rate bins dominated by noise | Noise dominated (total time) | Noise dominated (detector-on time) | Marked lightcurve |
|---|---|---|---|---|---|---|---|
| A | 7350 | 6235 | 2626 | 2626 | 35.73% | 42.12% | 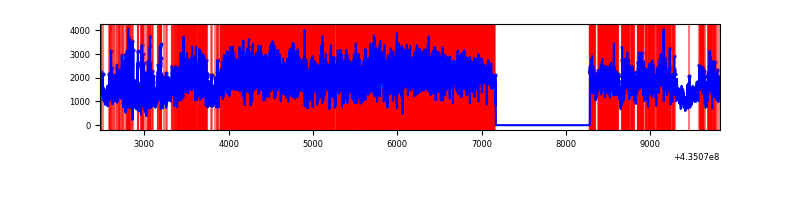 |
| B | 7350 | 6236 | 511 | 511 | 6.95% | 8.19% | 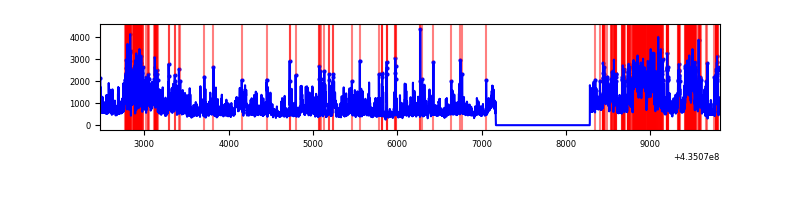 |
| C | 7351 | 6236 | 2883 | 2883 | 39.22% | 46.23% | 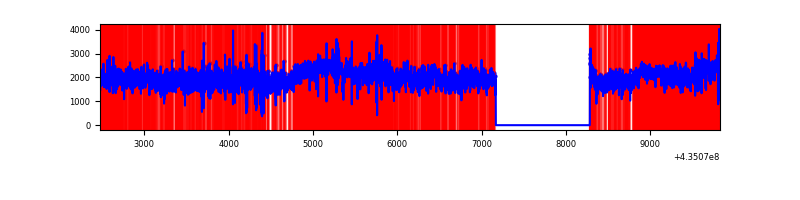 |
| D | 7350 | 6235 | 26 | 26 | 0.35% | 0.42% | 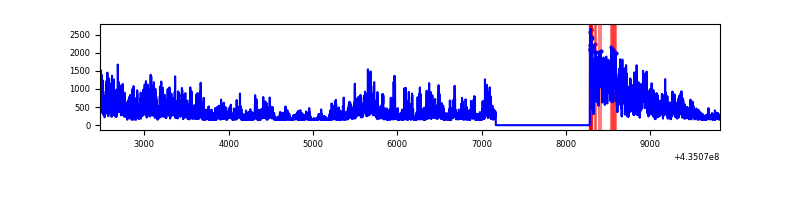 |
Top three noisy pixels from each quadrant. If the there are fewer than three noisy pixels in the level2.evt file, extra rows are filled as -1
| Pixel properties | Quadrant properties | ||||||
|---|---|---|---|---|---|---|---|
| Quadrant | DetID | PixID | Counts | Sigma | Mean | Median | Sigma |
| A | 0 | 228 | 3046243 | 26231.9 | 565 | 555 | 116.1 |
| A | 0 | 229 | 2680272 | 23079.86 | 565 | 555 | 116.1 |
| A | 14 | 235 | 1141959 | 9830.68 | 565 | 555 | 116.1 |
| B | 3 | 42 | 2563733 | 20043.37 | 678 | 660 | 127.9 |
| B | 3 | 25 | 296518 | 2313.63 | 678 | 660 | 127.9 |
| B | 3 | 34 | 111544 | 867.12 | 678 | 660 | 127.9 |
| C | 15 | 158 | 10646046 | 433004.34 | 98 | 98 | 24.6 |
| C | 5 | 80 | 147343 | 5988.92 | 98 | 98 | 24.6 |
| C | 15 | 191 | 140901 | 5726.9 | 98 | 98 | 24.6 |
| D | 4 | 201 | 409961 | 59560.17 | 5 | 4 | 6.9 |
| D | 4 | 124 | 327349 | 47557.97 | 5 | 4 | 6.9 |
| D | 4 | 215 | 318013 | 46201.6 | 5 | 4 | 6.9 |
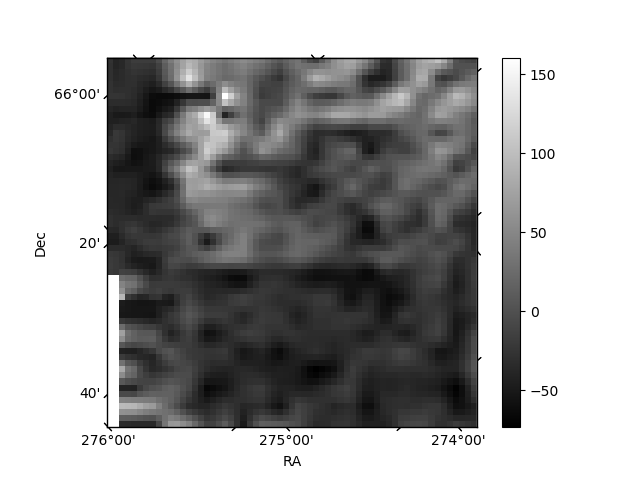
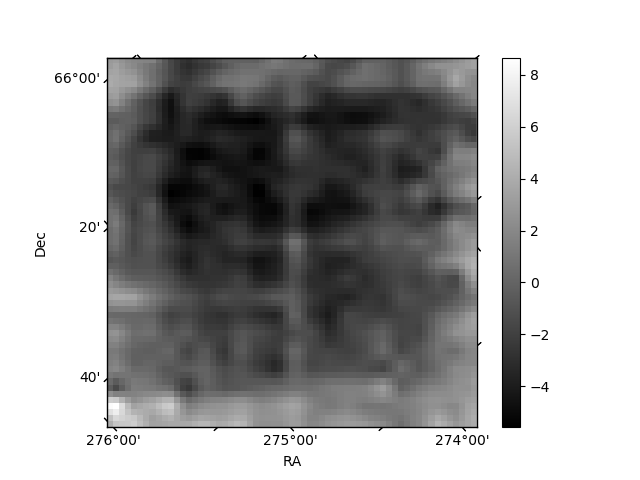
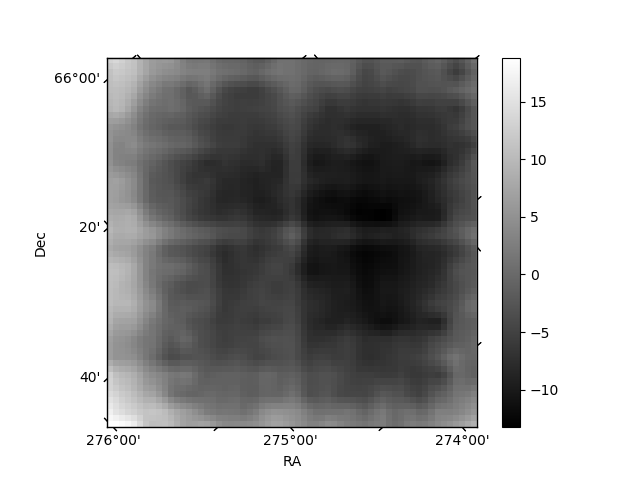
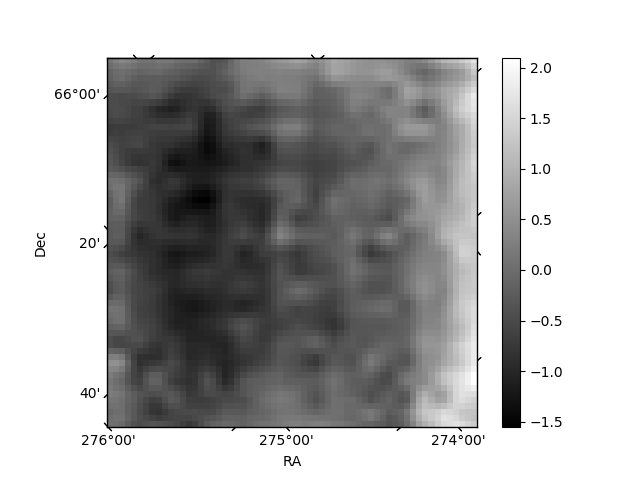
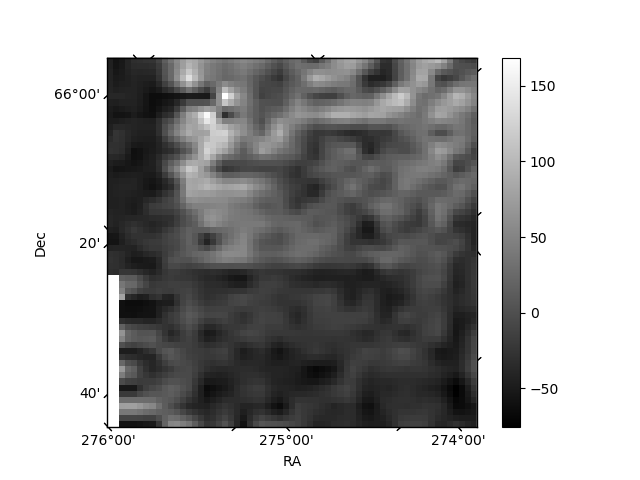
Histogram calculated using DETX and DETY for each event in the final _common_clean file
| Quadrant A | 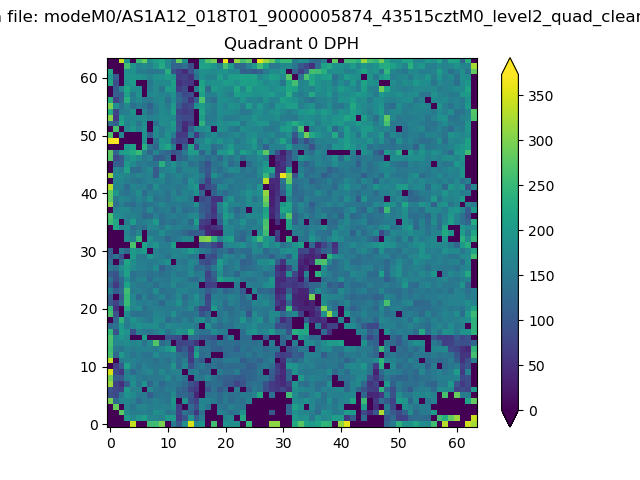 |
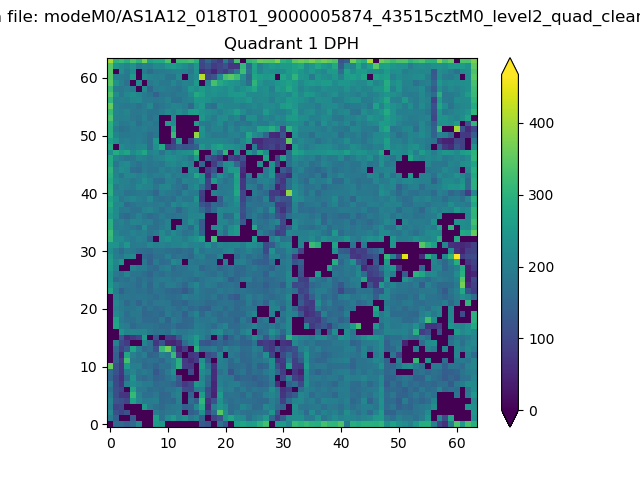 |
Quadrant B |
|---|---|---|---|
| Quadrant D | 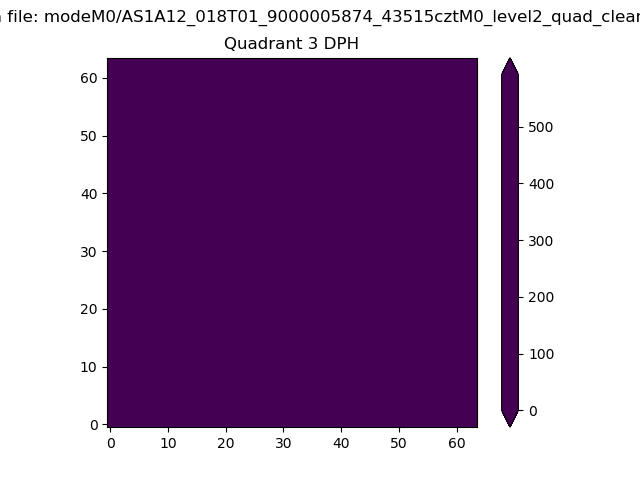 |
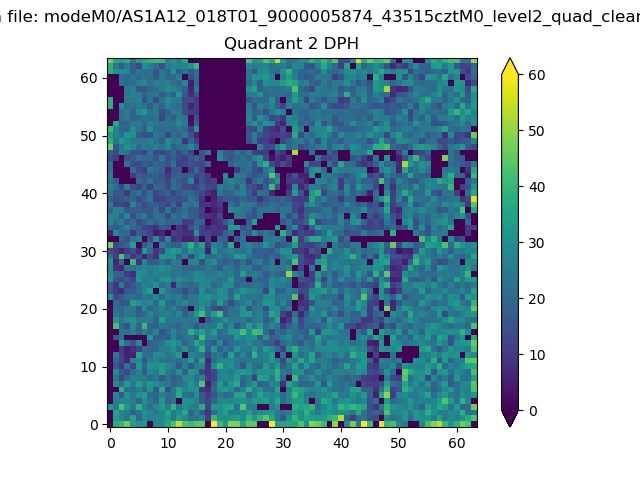 |
Quadrant C |
| Plot type | Count rate plots | Images |
|---|---|---|
| Comparison with Poisson distribution Blue bars denote a histogram of data divided into 1 sec bins. Red curve is a Poisson curve with rate = median count rate of data. |
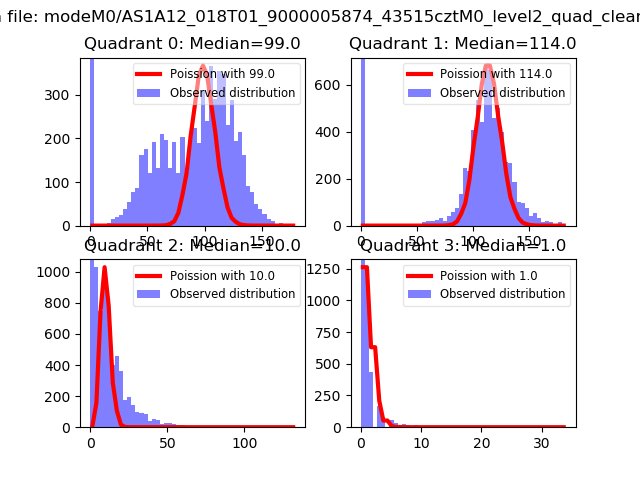 |
 |
| Quadrant-wise count rates Data is divided into 100 sec bins |
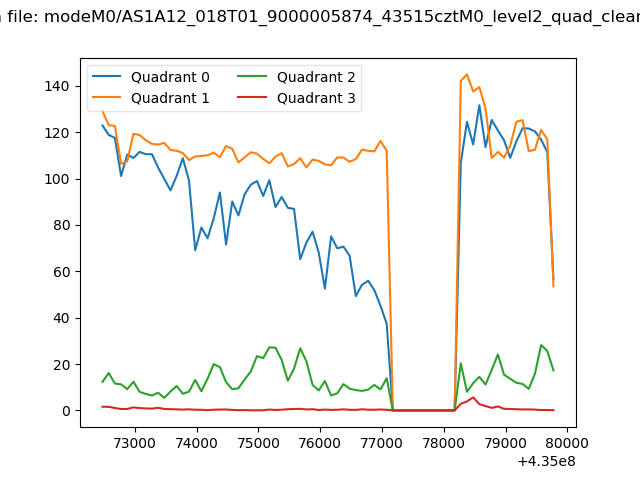 |
|
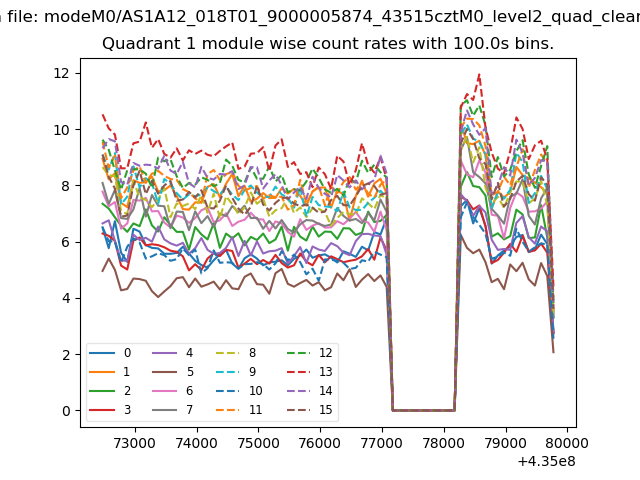
| Module-wise count rates for Quadrant A Data is divided into 100 sec bins |
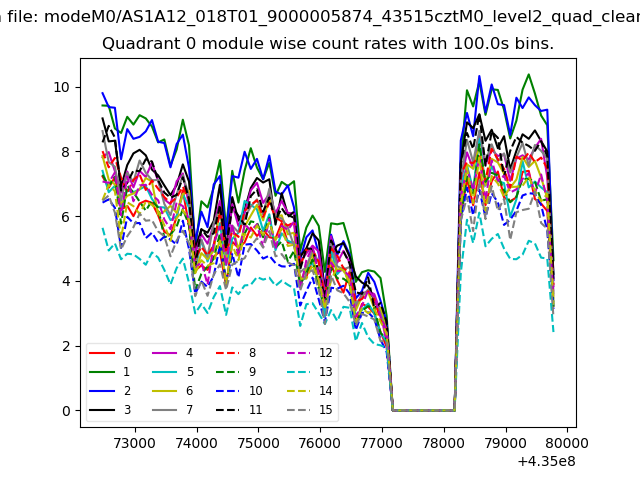 |
 |
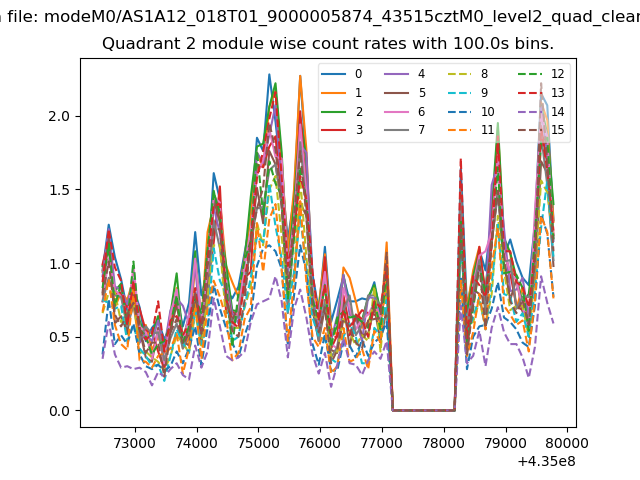
| Module-wise count rates for Quadrant B Data is divided into 100 sec bins |
 |
 |
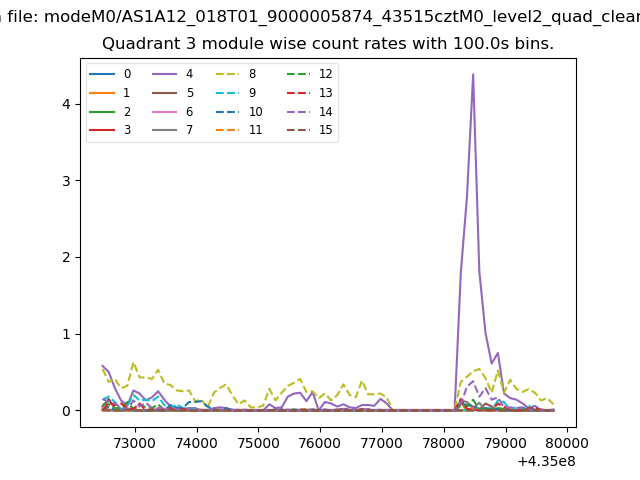
| Module-wise count rates for Quadrant C Data is divided into 100 sec bins |
 |
 |
| Module-wise count rates for Quadrant D Data is divided into 100 sec bins |
 |
 |
| Parameter | Plot |
|---|---|
| CZT HV Monitor |  |
| D_VDD | 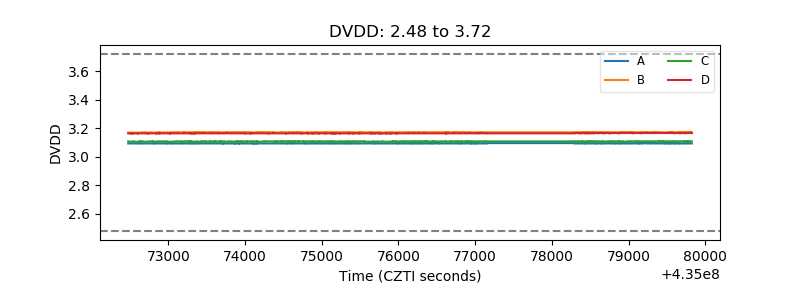 |
| Temperature 1 | 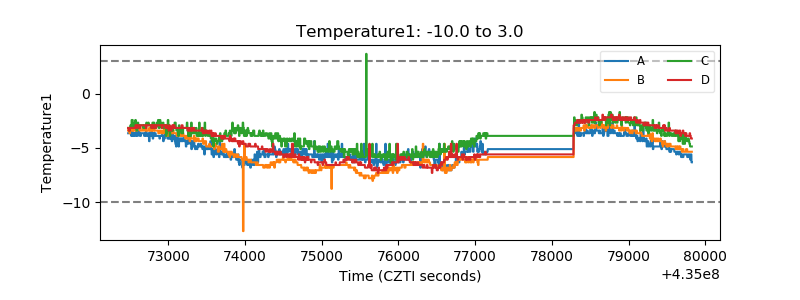 |
| Veto HV Monitor | 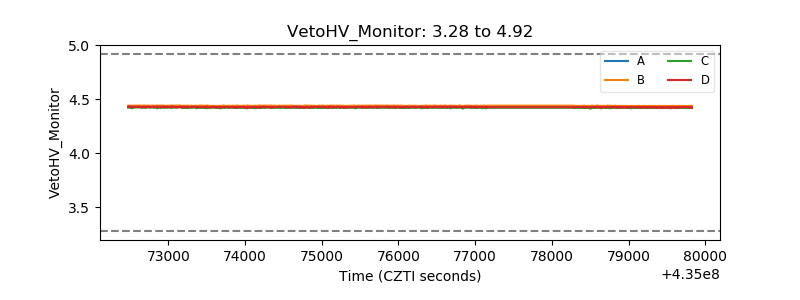 |
| Veto LLD | 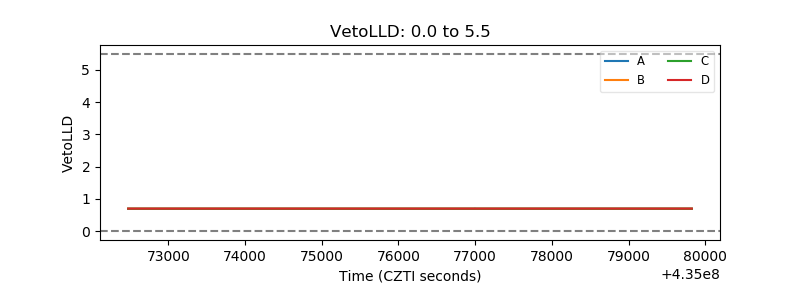 |
| Alpha Counter | 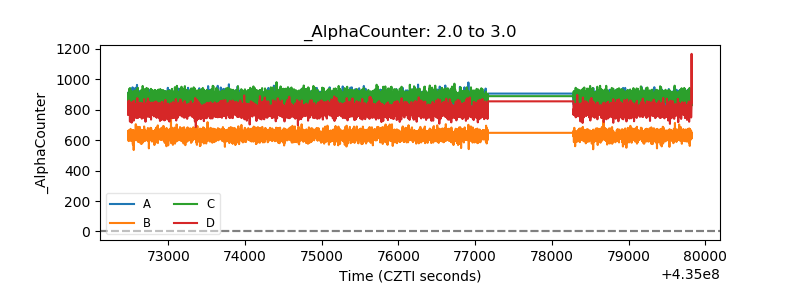 |
| _CPM_Rate | 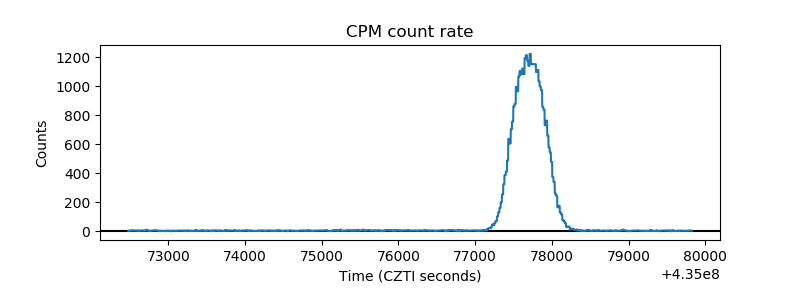 |
| CZT Counter | 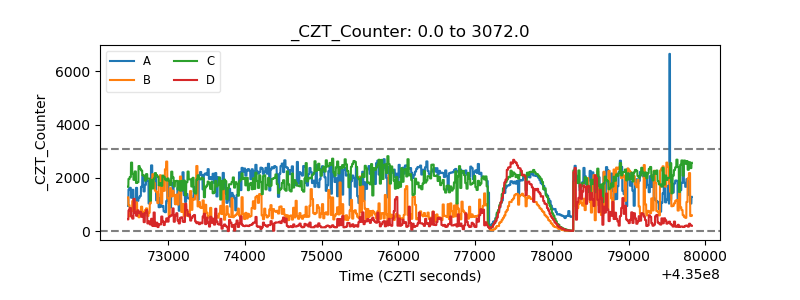 |
| +2.5 Volts monitor | 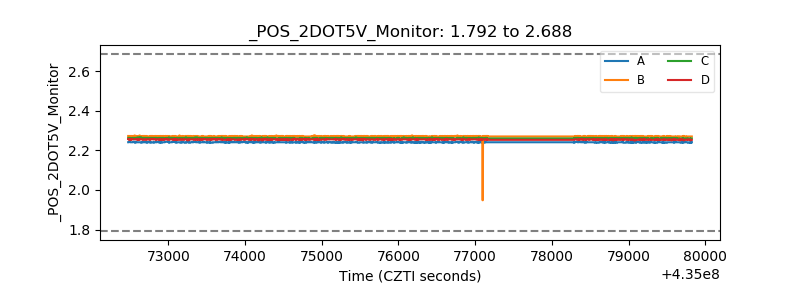 |
| +5 Volts monitor | 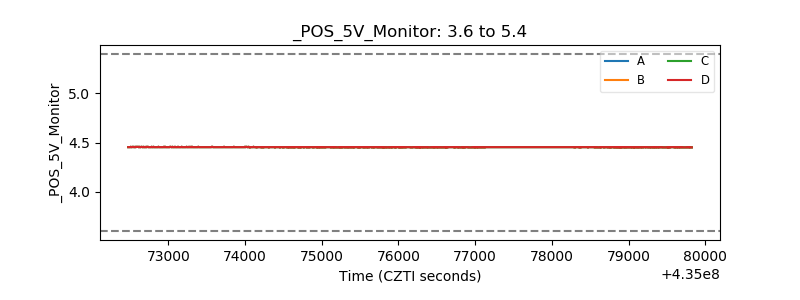 |
| _ROLL_ROT | 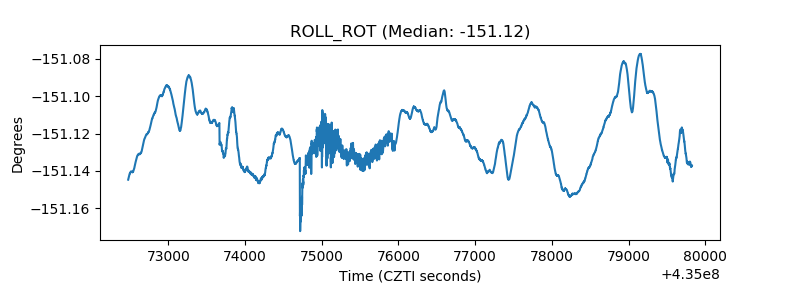 |
| _Roll_DEC | 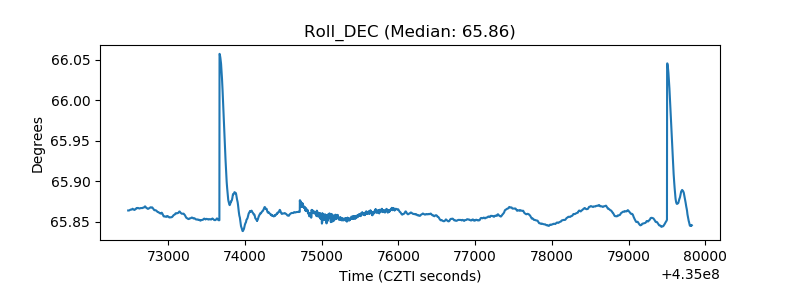 |
| _Roll_RA | 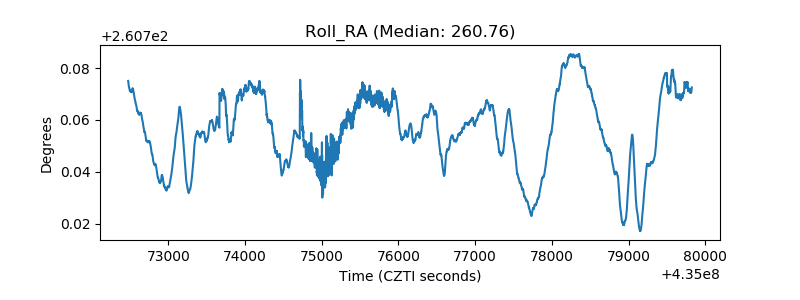 |
| Veto Counter | 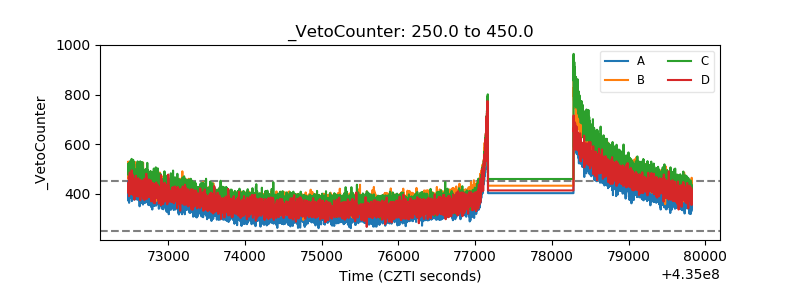 |