| Param | Original file | Final file |
|---|---|---|
| Filename | modeM0/AS1A12_018T01_9000005874_43516cztM0_level2.fits | modeM0/AS1A12_018T01_9000005874_43516cztM0_level2_quad_clean.evt |
| Size (bytes) | 942,318,720 | 58,680,000 |
| Size | 898.7 MB | 56.0 MB |
| Events in quadrant A | 11,240,460 | 581,388 |
| Events in quadrant B | 7,525,777 | 667,631 |
| Events in quadrant C | 13,297,642 | 104,826 |
| Events in quadrant D | 2,358,953 | 4,330 |
| Mode M0 | |||
|---|---|---|---|
| Quadrant | BADHDUFLAG | Total packets | Discarded packets |
| A | 0 | 37434 | 0 |
| B | 0 | 26423 | 0 |
| C | 0 | 43488 | 0 |
| D | 0 | 10959 | 0 |
| Mode M9 | |||
|---|---|---|---|
| Quadrant | BADHDUFLAG | Total packets | Discarded packets |
| A | 0 | 12 | 0 |
| B | 0 | 12 | 0 |
| C | 0 | 12 | 0 |
| D | 0 | 12 | 0 |
| Mode SS | |||
|---|---|---|---|
| Quadrant | BADHDUFLAG | Total packets | Discarded packets |
| A | 0 | 120 | 0 |
| B | 0 | 120 | 0 |
| C | 0 | 120 | 0 |
| D | 0 | 120 | 0 |
| Quadrant | Total seconds | Saturated seconds | Saturation percentage |
|---|---|---|---|
| A | 5878 | 3256 | 55.392991% |
| B | 5879 | 1432 | 24.357884% |
| C | 5879 | 5868 | 99.812893% |
| D | 5879 | 5879 | 100.000000% |
Noise dominated data is calculated using 1-second bins in cleaned event files. If a bin has >2000 counts, and if more than 50% of those come from <1% of pixels, then it is considered to be noise-dominated and hence unusable.
| Quadrant | # 1 sec bins | Bins with >0 counts | Bins with >2000 counts | High rate bins dominated by noise | Noise dominated (total time) | Noise dominated (detector-on time) | Marked lightcurve |
|---|---|---|---|---|---|---|---|
| A | 7053 | 5879 | 2501 | 2501 | 35.46% | 42.54% | 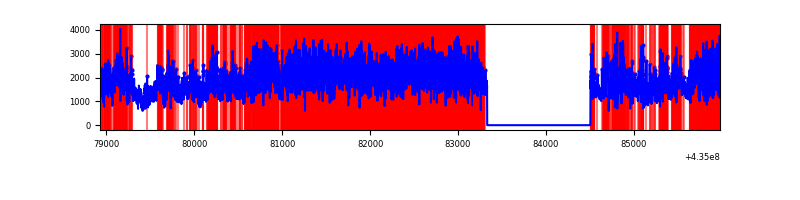 |
| B | 7054 | 5880 | 1116 | 1116 | 15.82% | 18.98% | 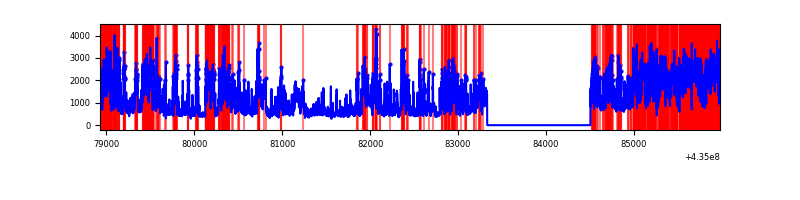 |
| C | 7053 | 5878 | 4863 | 4863 | 68.95% | 82.73% | 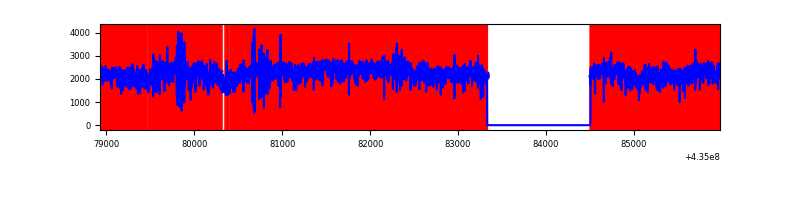 |
| D | 7053 | 5878 | 24 | 24 | 0.34% | 0.41% | 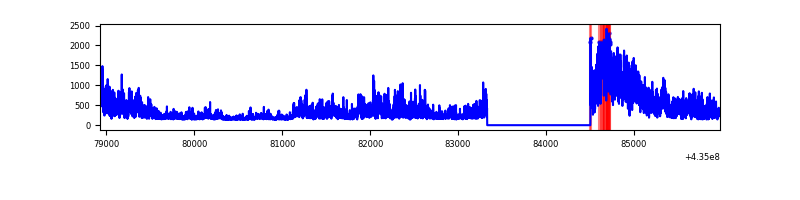 |
Top three noisy pixels from each quadrant. If the there are fewer than three noisy pixels in the level2.evt file, extra rows are filled as -1
| Pixel properties | Quadrant properties | ||||||
|---|---|---|---|---|---|---|---|
| Quadrant | DetID | PixID | Counts | Sigma | Mean | Median | Sigma |
| A | 0 | 228 | 3677815 | 32834.02 | 551 | 539 | 112.0 |
| A | 0 | 229 | 1697002 | 15147.54 | 551 | 539 | 112.0 |
| A | 14 | 235 | 1224474 | 10928.39 | 551 | 539 | 112.0 |
| B | 3 | 42 | 2342295 | 20101.44 | 620 | 603 | 116.5 |
| B | 3 | 25 | 1480963 | 12707.64 | 620 | 603 | 116.5 |
| B | 4 | 206 | 552341 | 4736.2 | 620 | 603 | 116.5 |
| C | 15 | 158 | 10366493 | 363973.54 | 115 | 115 | 28.5 |
| C | 15 | 191 | 821331 | 28833.69 | 115 | 115 | 28.5 |
| C | 3 | 233 | 217678 | 7638.85 | 115 | 115 | 28.5 |
| D | 4 | 201 | 285208 | 61654.73 | 4 | 4 | 4.6 |
| D | 4 | 124 | 270921 | 58566.2 | 4 | 4 | 4.6 |
| D | 4 | 215 | 249791 | 53998.37 | 4 | 4 | 4.6 |
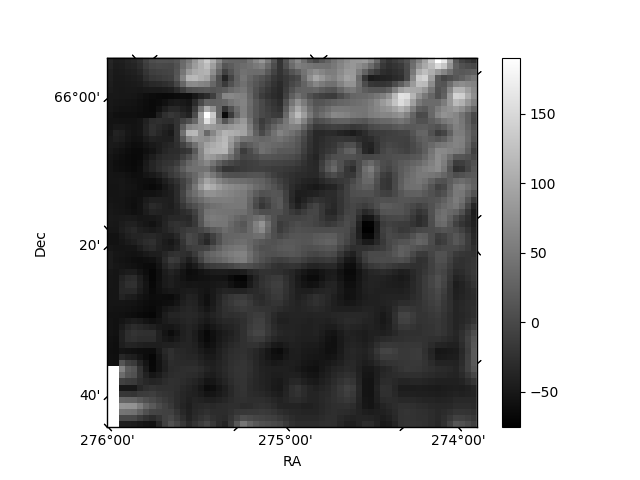
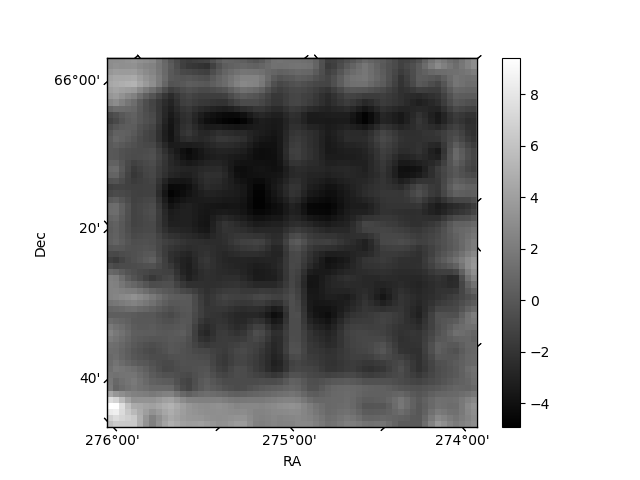
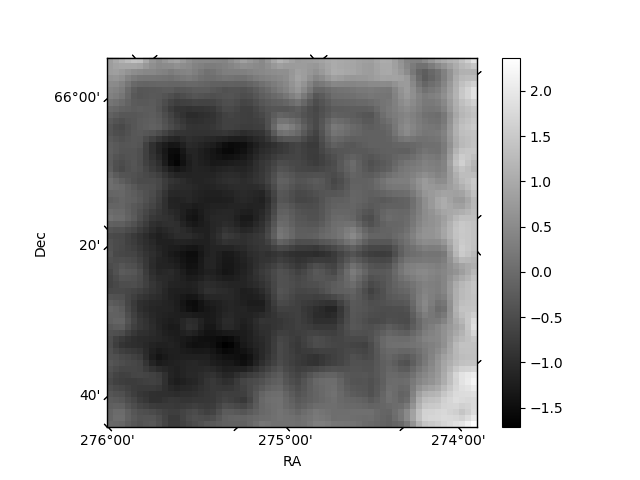
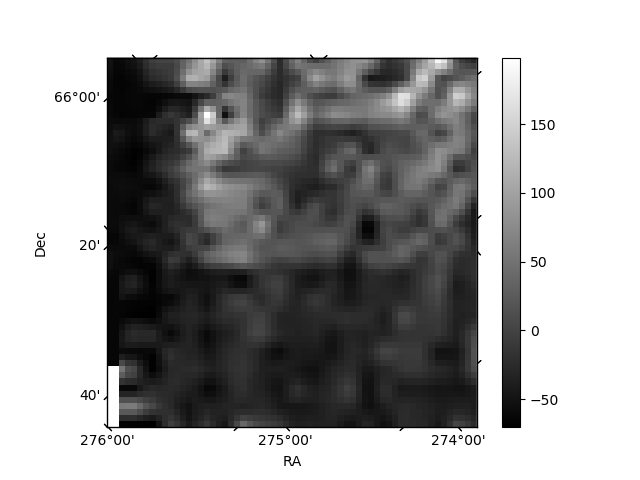
Histogram calculated using DETX and DETY for each event in the final _common_clean file
| Quadrant A | 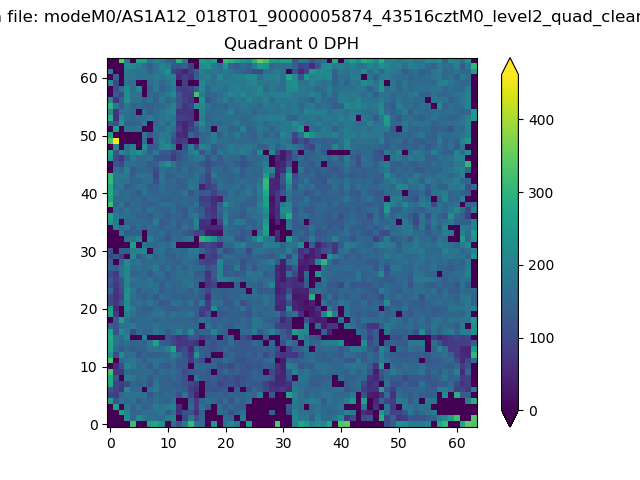 |
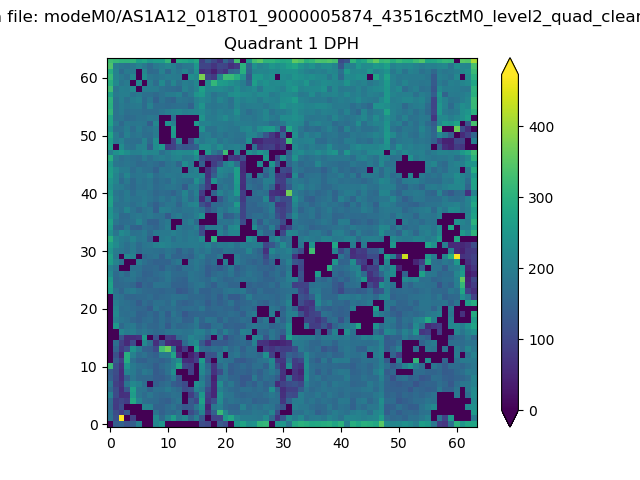 |
Quadrant B |
|---|---|---|---|
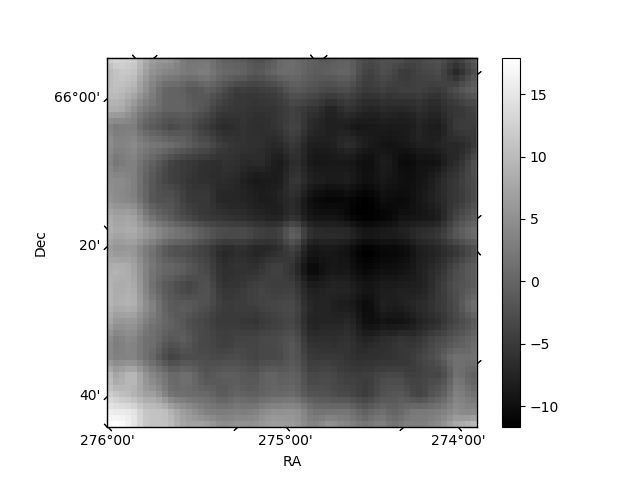
| Quadrant D | 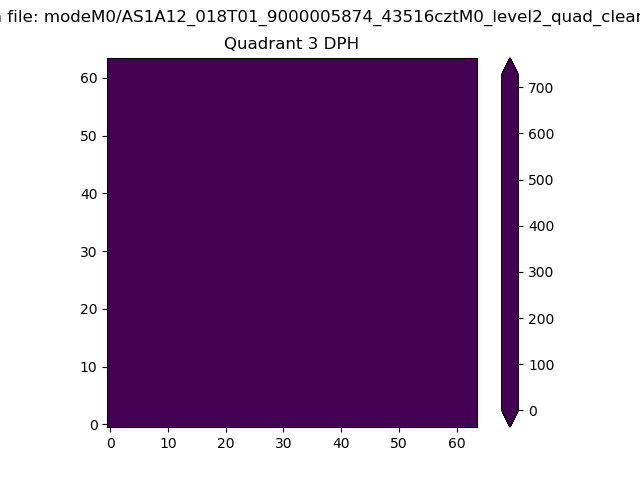 |
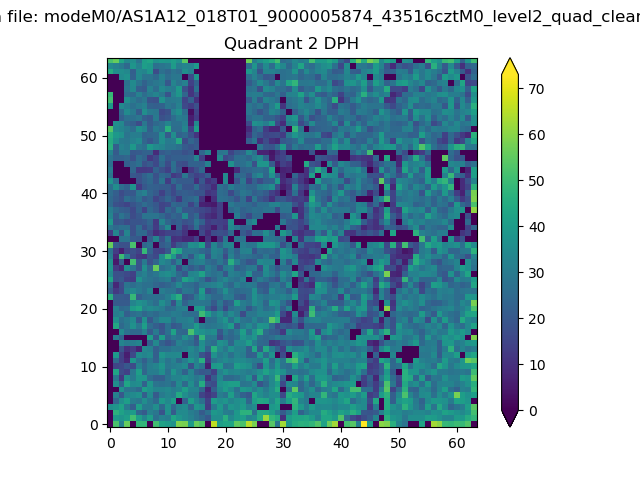 |
Quadrant C |
| Plot type | Count rate plots | Images |
|---|---|---|
| Comparison with Poisson distribution Blue bars denote a histogram of data divided into 1 sec bins. Red curve is a Poisson curve with rate = median count rate of data. |
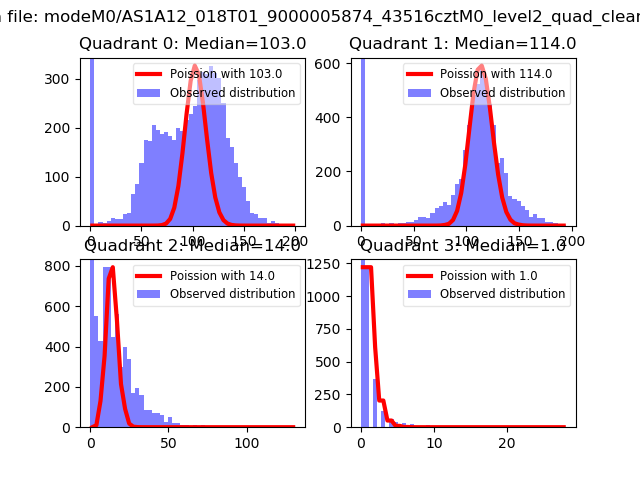 |
 |
| Quadrant-wise count rates Data is divided into 100 sec bins |
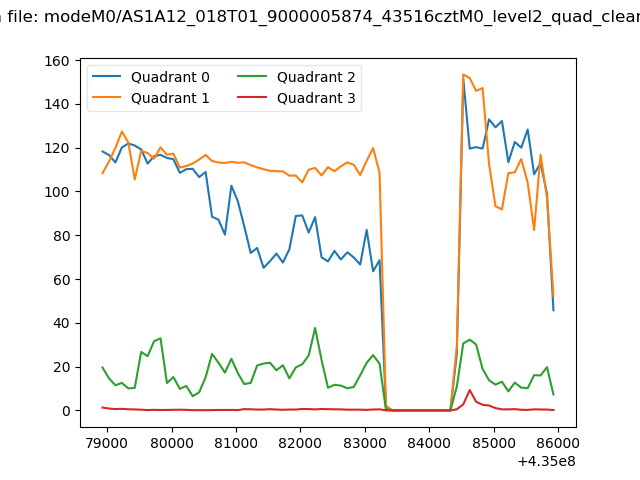 |
|
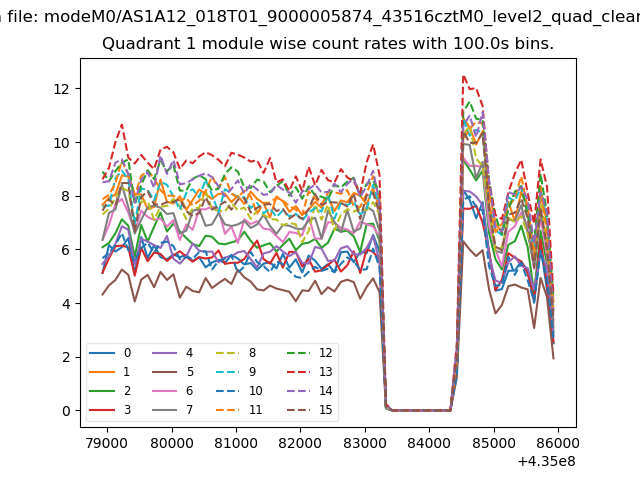
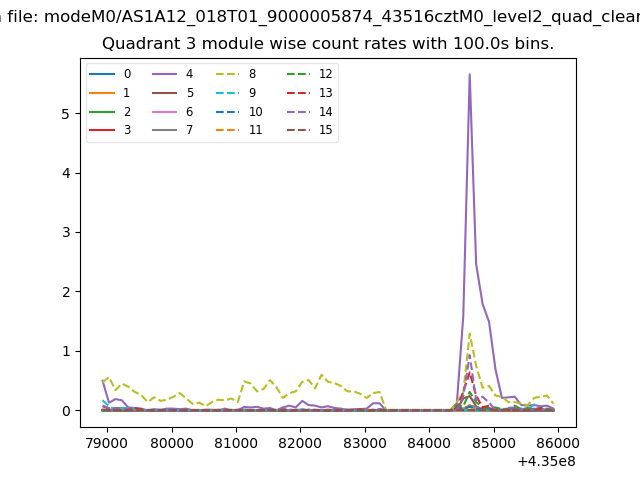
| Module-wise count rates for Quadrant A Data is divided into 100 sec bins |
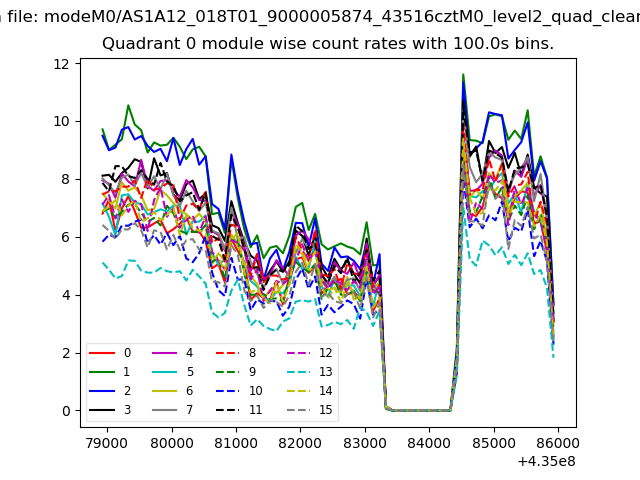 |
 |
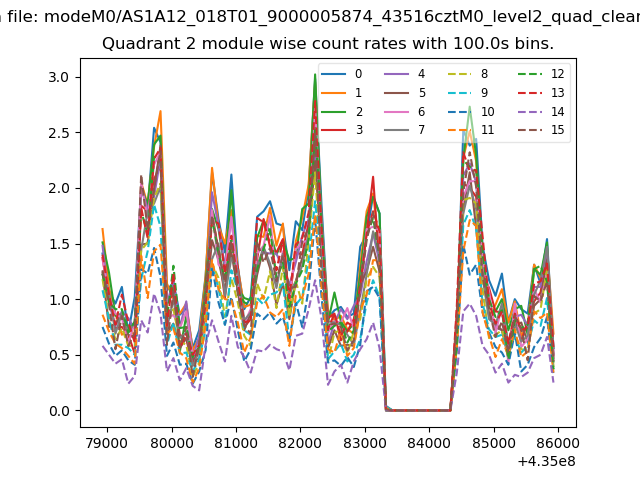
| Module-wise count rates for Quadrant B Data is divided into 100 sec bins |
 |
 |
| Module-wise count rates for Quadrant C Data is divided into 100 sec bins |
 |
 |
| Module-wise count rates for Quadrant D Data is divided into 100 sec bins |
 |
 |
| Parameter | Plot |
|---|---|
| CZT HV Monitor | 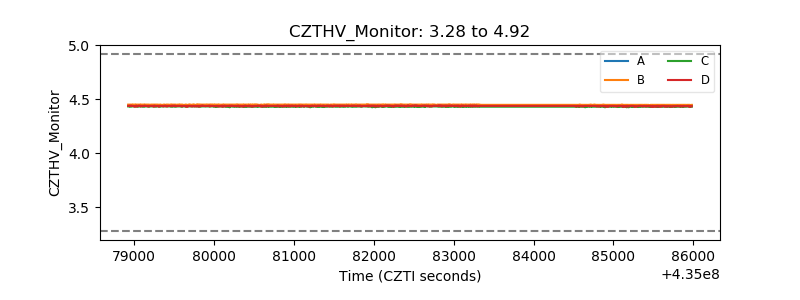 |
| D_VDD | 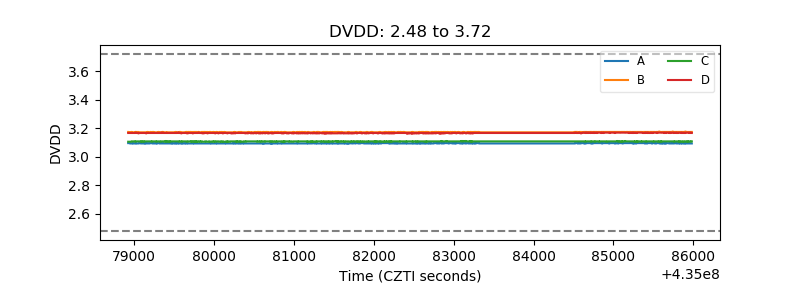 |
| Temperature 1 | 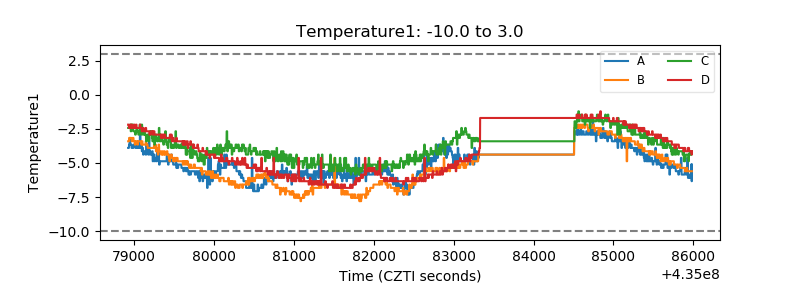 |
| Veto HV Monitor | 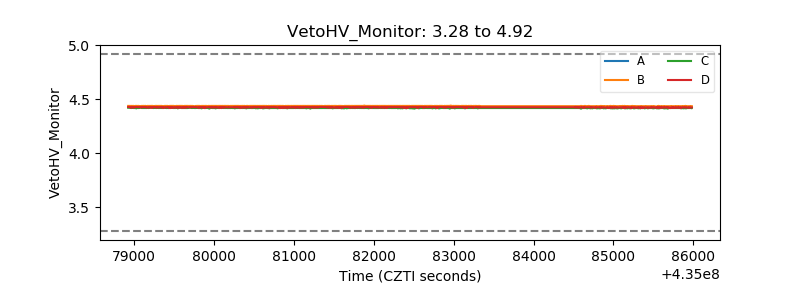 |
| Veto LLD | 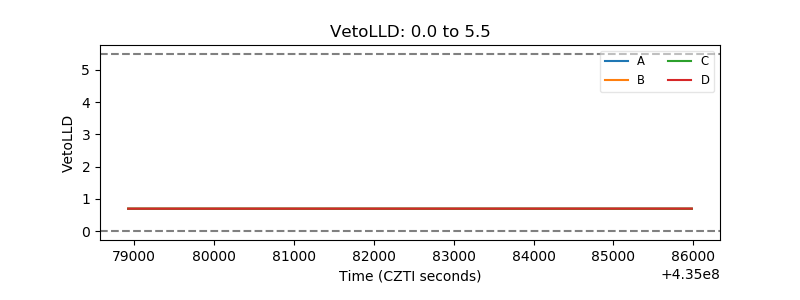 |
| Alpha Counter | 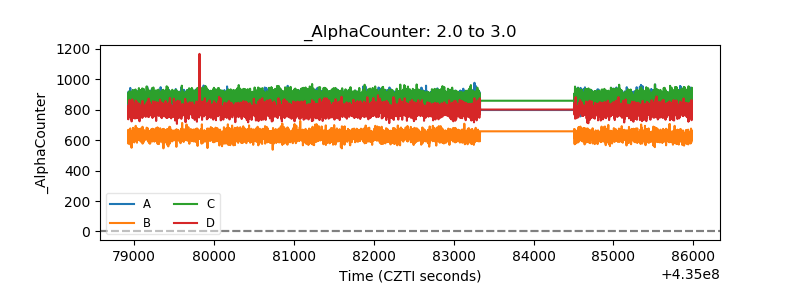 |
| _CPM_Rate | 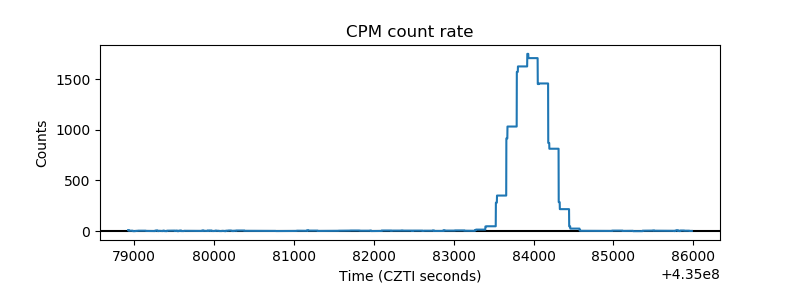 |
| CZT Counter | 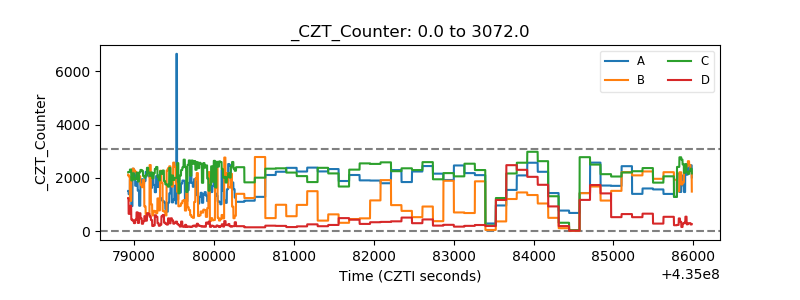 |
| +2.5 Volts monitor | 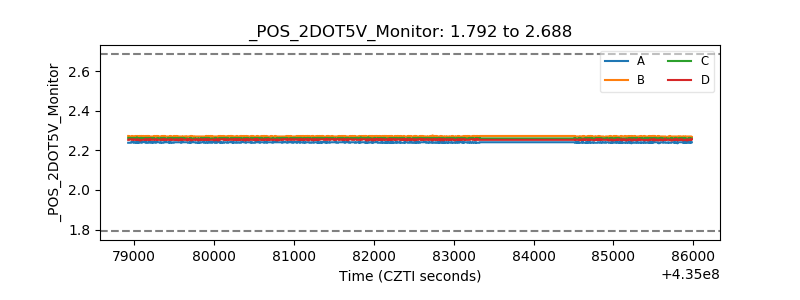 |
| +5 Volts monitor | 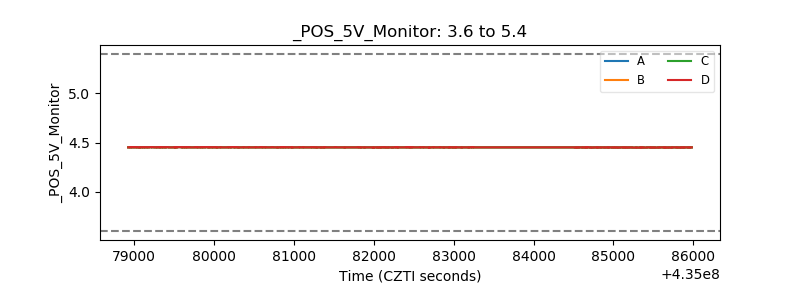 |
| _ROLL_ROT | 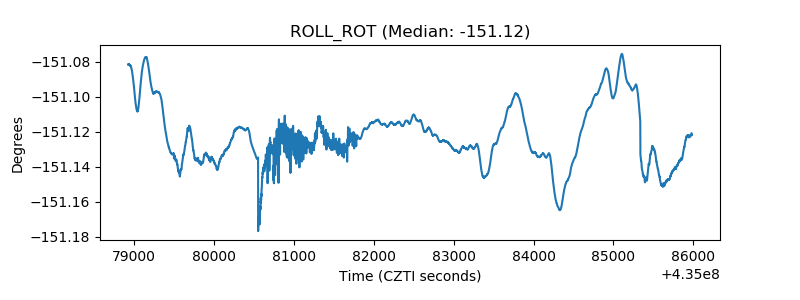 |
| _Roll_DEC | 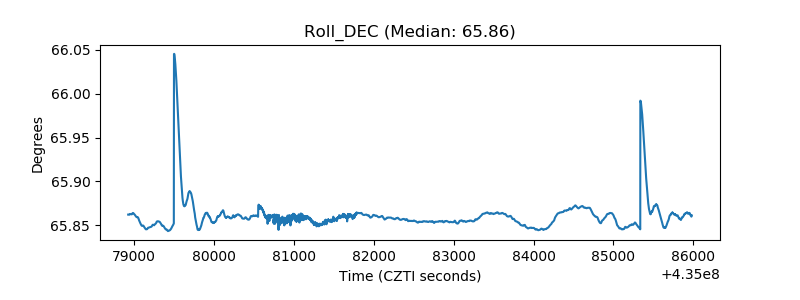 |
| _Roll_RA | 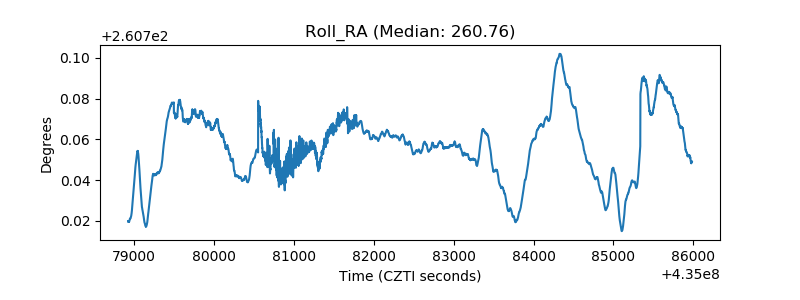 |
| Veto Counter | 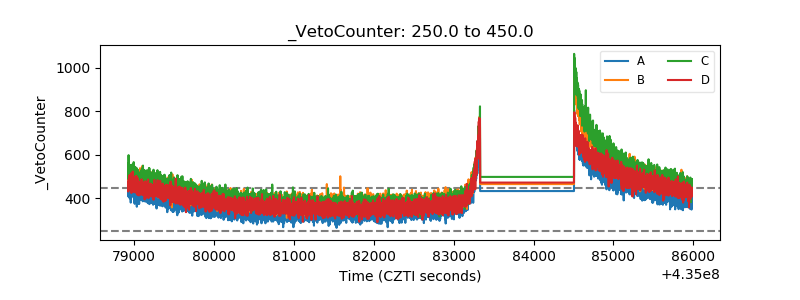 |