| Param | Original file | Final file |
|---|---|---|
| Filename | modeM0/AS1A12_018T01_9000005874_43517cztM0_level2.fits | modeM0/AS1A12_018T01_9000005874_43517cztM0_level2_quad_clean.evt |
| Size (bytes) | 976,279,680 | 55,759,680 |
| Size | 931.1 MB | 53.2 MB |
| Events in quadrant A | 10,643,667 | 517,249 |
| Events in quadrant B | 8,718,871 | 647,057 |
| Events in quadrant C | 13,601,122 | 114,670 |
| Events in quadrant D | 2,732,564 | 4,068 |
| Mode M0 | |||
|---|---|---|---|
| Quadrant | BADHDUFLAG | Total packets | Discarded packets |
| A | 0 | 35589 | 1 |
| B | 0 | 29841 | 1 |
| C | 0 | 44294 | 4 |
| D | 0 | 12115 | 1 |
| Mode M9 | |||
|---|---|---|---|
| Quadrant | BADHDUFLAG | Total packets | Discarded packets |
| A | 0 | 12 | 0 |
| B | 0 | 12 | 0 |
| C | 0 | 12 | 0 |
| D | 0 | 12 | 0 |
| Mode SS | |||
|---|---|---|---|
| Quadrant | BADHDUFLAG | Total packets | Discarded packets |
| A | 0 | 116 | 0 |
| B | 0 | 116 | 0 |
| C | 0 | 116 | 0 |
| D | 0 | 116 | 0 |
| Quadrant | Total seconds | Saturated seconds | Saturation percentage |
|---|---|---|---|
| A | 5687 | 2763 | 48.584491% |
| B | 5688 | 1874 | 32.946554% |
| C | 5687 | 5685 | 99.964832% |
| D | 5687 | 5687 | 100.000000% |
Noise dominated data is calculated using 1-second bins in cleaned event files. If a bin has >2000 counts, and if more than 50% of those come from <1% of pixels, then it is considered to be noise-dominated and hence unusable.
| Quadrant | # 1 sec bins | Bins with >0 counts | Bins with >2000 counts | High rate bins dominated by noise | Noise dominated (total time) | Noise dominated (detector-on time) | Marked lightcurve |
|---|---|---|---|---|---|---|---|
| A | 6912 | 5688 | 2453 | 2453 | 35.49% | 43.13% | 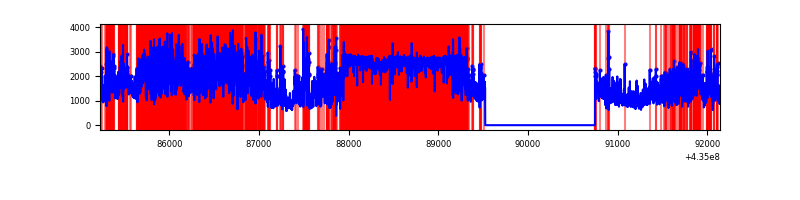 |
| B | 6913 | 5689 | 1451 | 1451 | 20.99% | 25.51% | 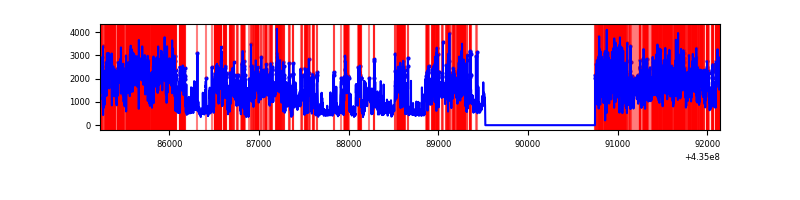 |
| C | 6911 | 5686 | 5211 | 5211 | 75.40% | 91.65% | 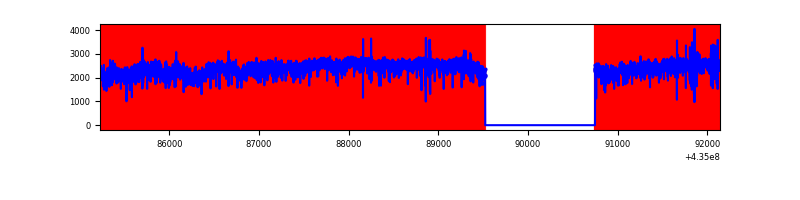 |
| D | 6911 | 5686 | 25 | 25 | 0.36% | 0.44% | 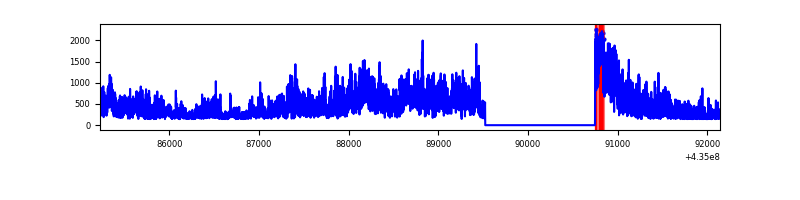 |
Top three noisy pixels from each quadrant. If the there are fewer than three noisy pixels in the level2.evt file, extra rows are filled as -1
| Pixel properties | Quadrant properties | ||||||
|---|---|---|---|---|---|---|---|
| Quadrant | DetID | PixID | Counts | Sigma | Mean | Median | Sigma |
| A | 15 | 223 | 3129373 | 30728.18 | 500 | 491 | 101.8 |
| A | 0 | 228 | 2589276 | 25423.99 | 500 | 491 | 101.8 |
| A | 14 | 235 | 1044605 | 10254.05 | 500 | 491 | 101.8 |
| B | 3 | 42 | 3439930 | 30550.03 | 595 | 580 | 112.6 |
| B | 3 | 25 | 1554507 | 13802.76 | 595 | 580 | 112.6 |
| B | 4 | 206 | 537462 | 4768.85 | 595 | 580 | 112.6 |
| C | 15 | 158 | 10105613 | 324102.2 | 125 | 125 | 31.2 |
| C | 15 | 191 | 1095165 | 35120.01 | 125 | 125 | 31.2 |
| C | 5 | 80 | 374698 | 12013.27 | 125 | 125 | 31.2 |
| D | 4 | 124 | 384323 | 48974.03 | 5 | 4 | 7.8 |
| D | 4 | 215 | 341080 | 43463.54 | 5 | 4 | 7.8 |
| D | 4 | 201 | 231712 | 29526.7 | 5 | 4 | 7.8 |
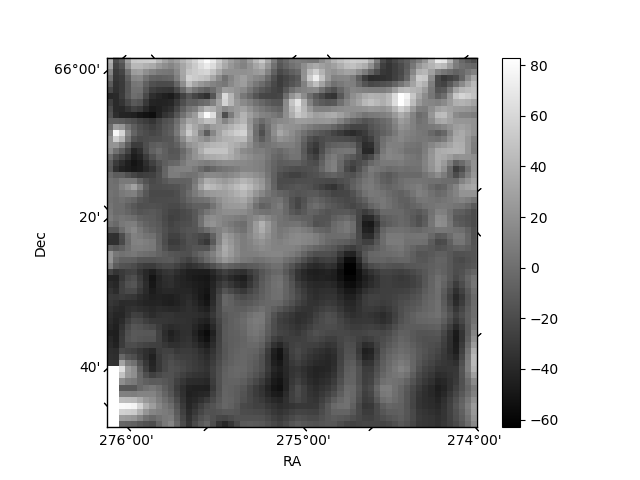
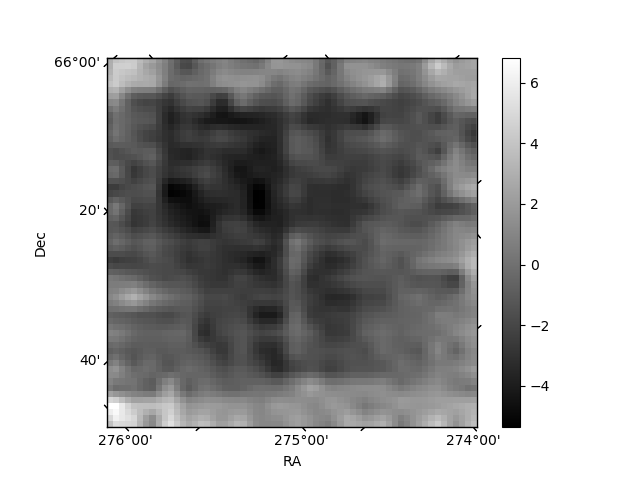
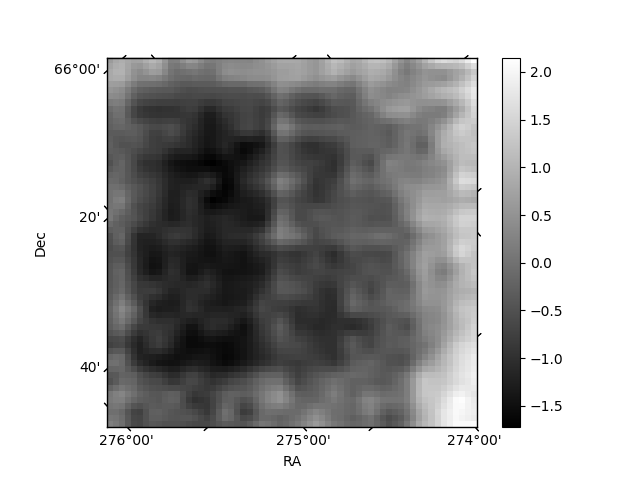
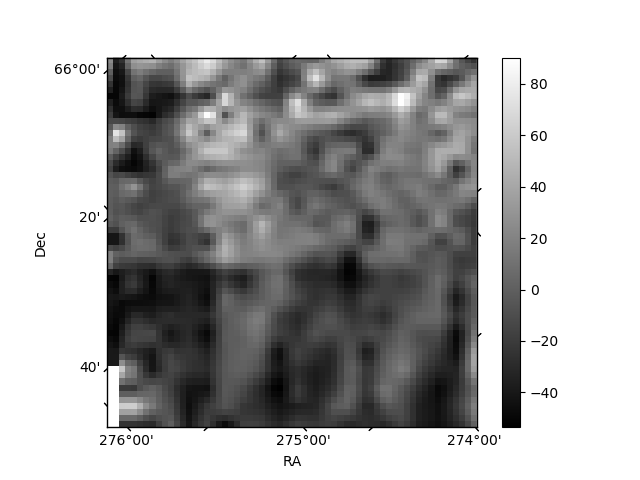
Histogram calculated using DETX and DETY for each event in the final _common_clean file
| Quadrant A | 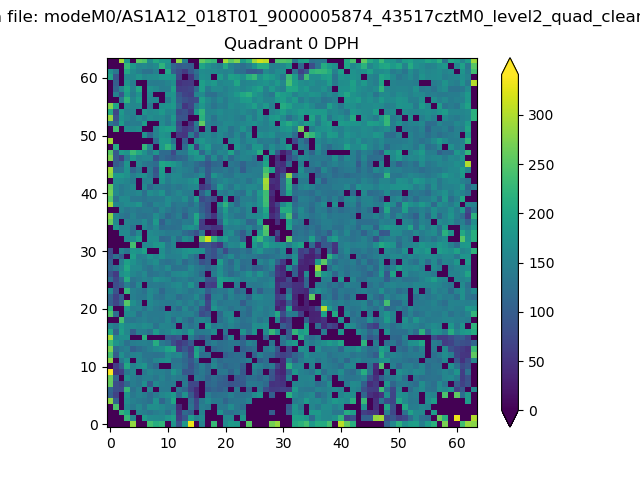 |
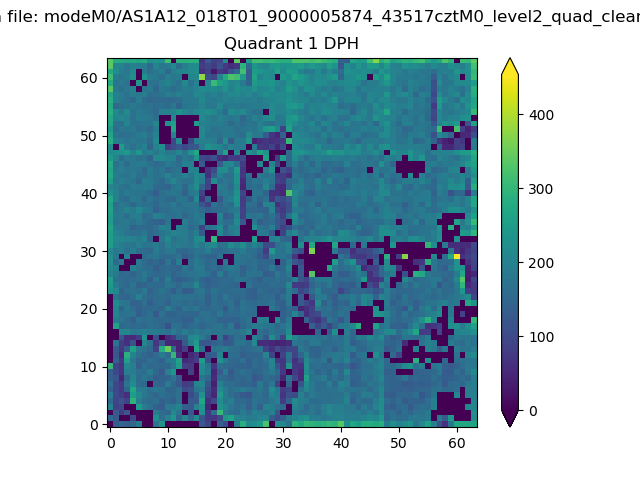 |
Quadrant B |
|---|---|---|---|
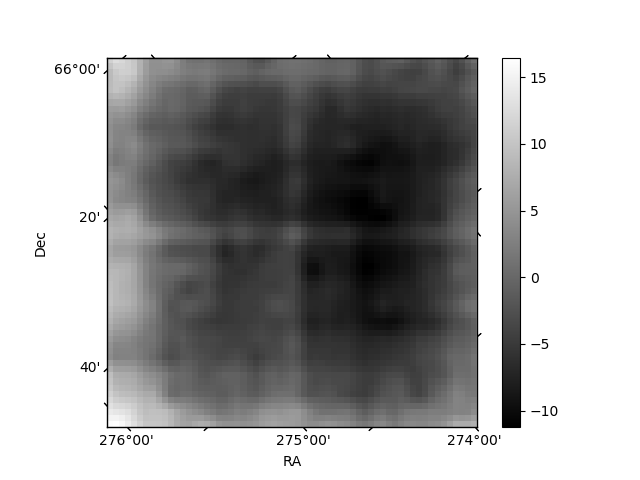
| Quadrant D | 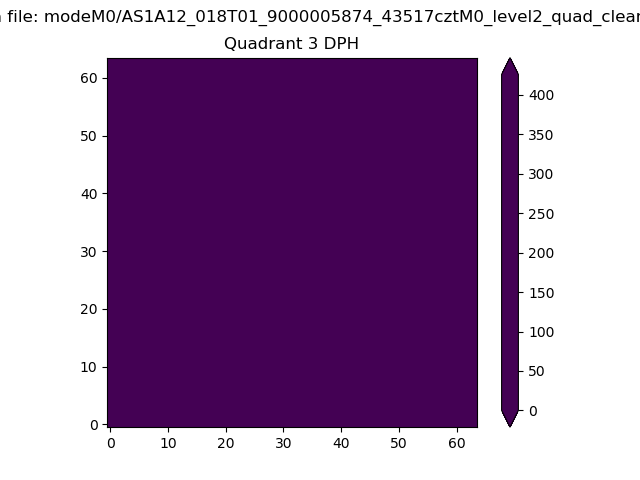 |
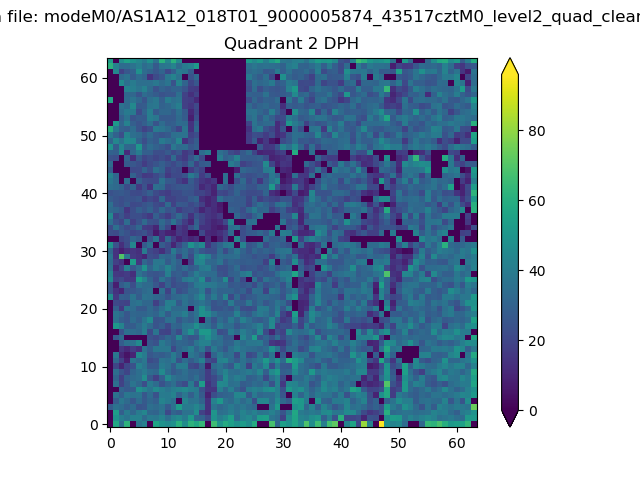 |
Quadrant C |
| Plot type | Count rate plots | Images |
|---|---|---|
| Comparison with Poisson distribution Blue bars denote a histogram of data divided into 1 sec bins. Red curve is a Poisson curve with rate = median count rate of data. |
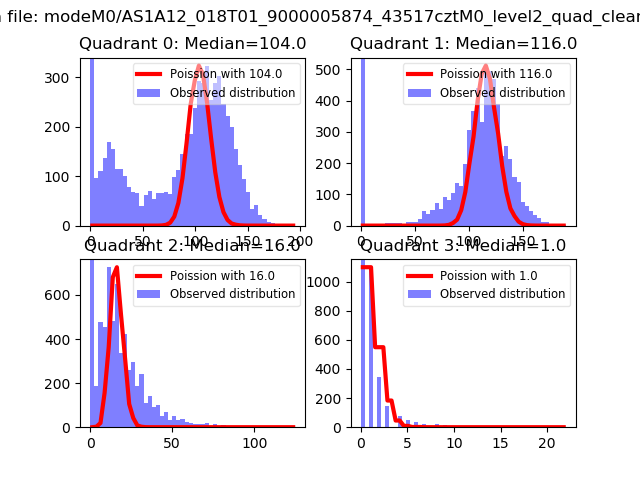 |
 |
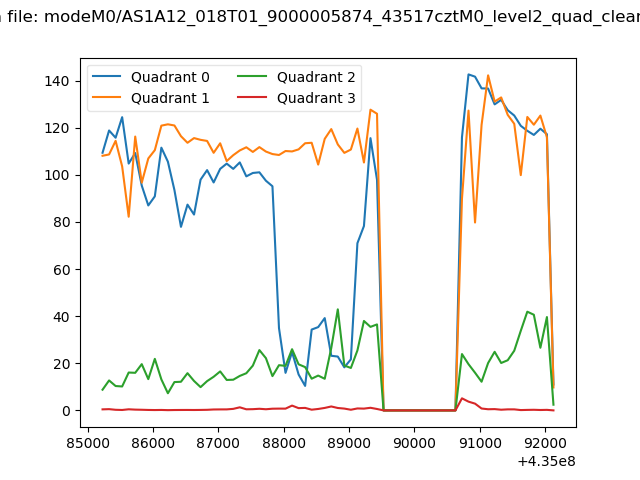
| Quadrant-wise count rates Data is divided into 100 sec bins |
 |
|
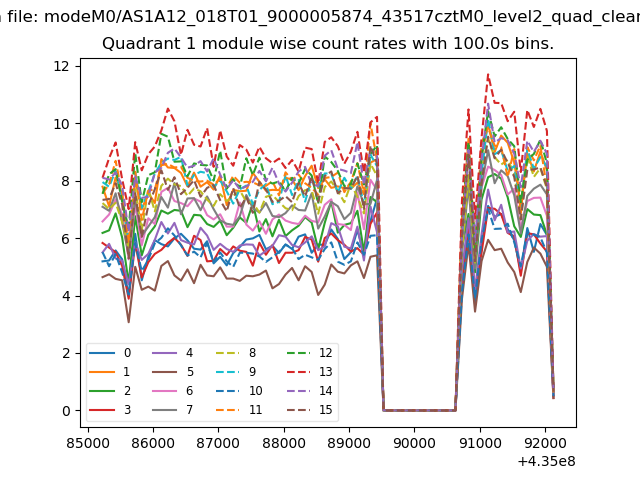
| Module-wise count rates for Quadrant A Data is divided into 100 sec bins |
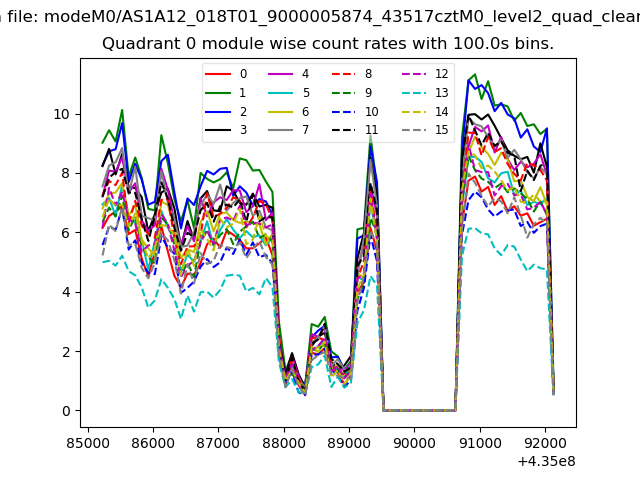 |
 |
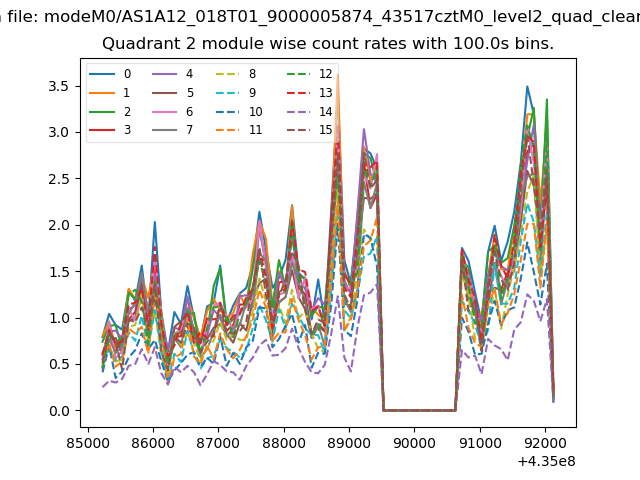
| Module-wise count rates for Quadrant B Data is divided into 100 sec bins |
 |
 |
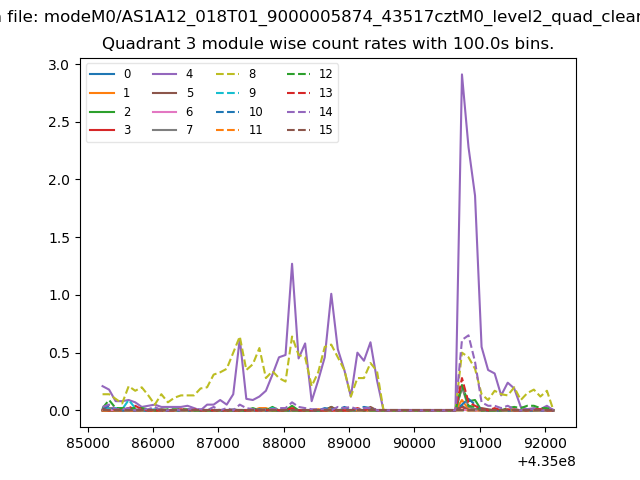
| Module-wise count rates for Quadrant C Data is divided into 100 sec bins |
 |
 |
| Module-wise count rates for Quadrant D Data is divided into 100 sec bins |
 |
 |
| Parameter | Plot |
|---|---|
| CZT HV Monitor | 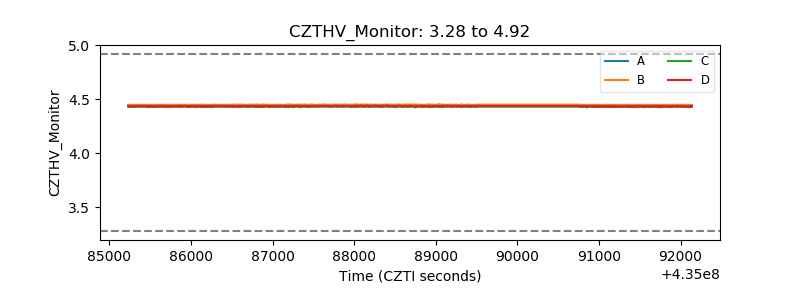 |
| D_VDD | 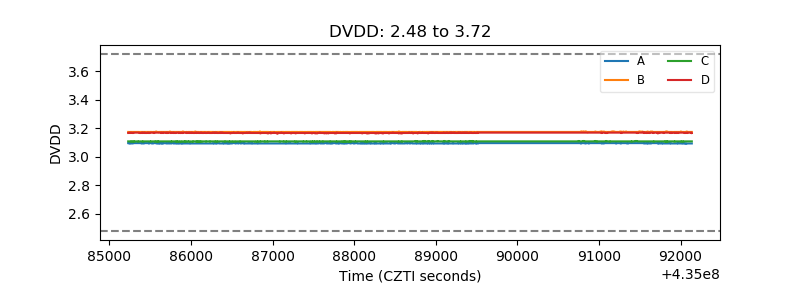 |
| Temperature 1 | 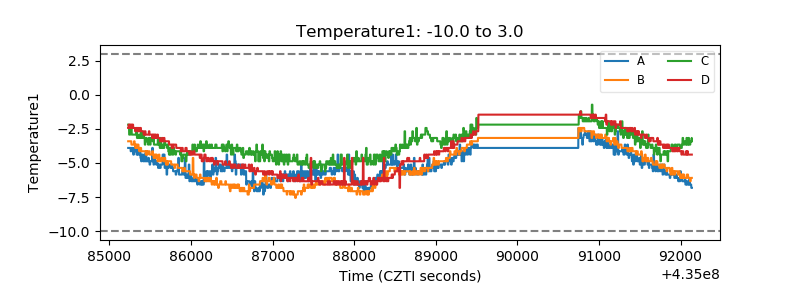 |
| Veto HV Monitor | 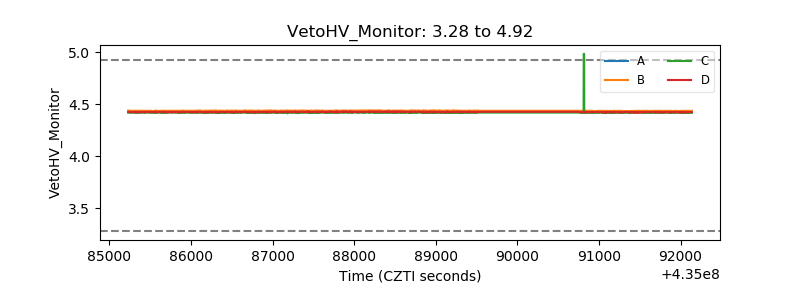 |
| Veto LLD | 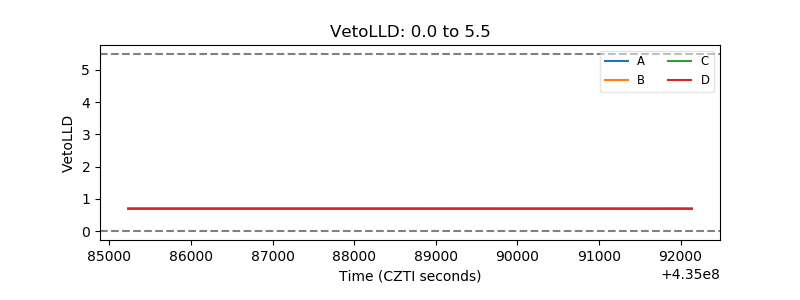 |
| Alpha Counter | 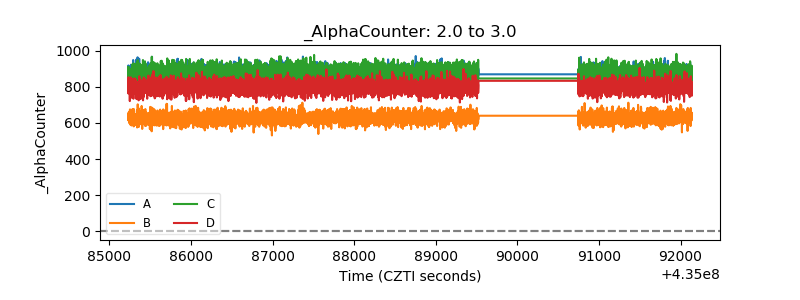 |
| _CPM_Rate | 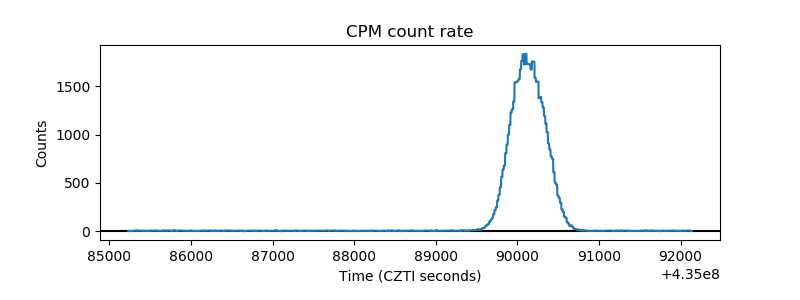 |
| CZT Counter | 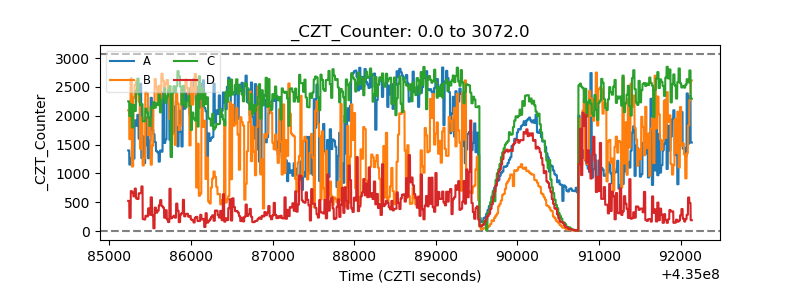 |
| +2.5 Volts monitor | 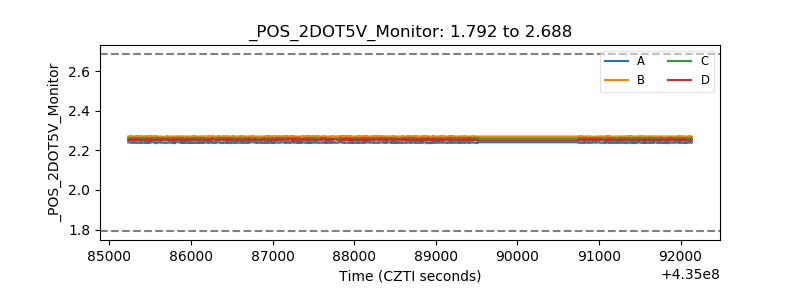 |
| +5 Volts monitor | 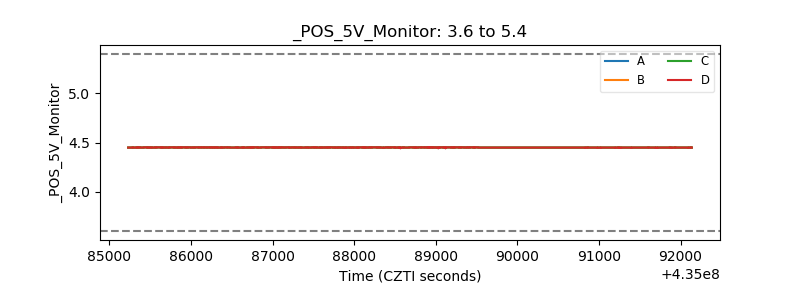 |
| _ROLL_ROT | 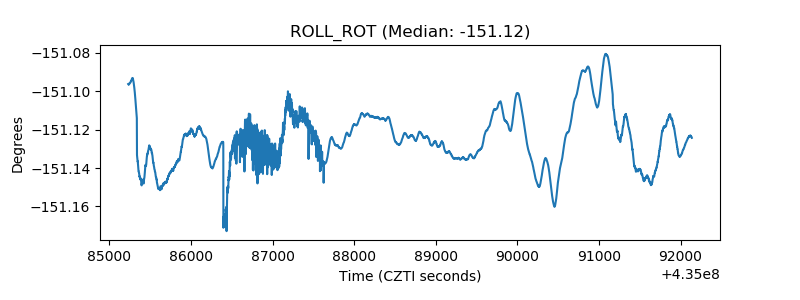 |
| _Roll_DEC | 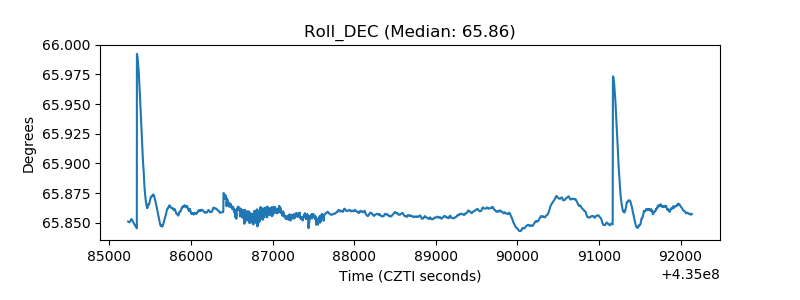 |
| _Roll_RA | 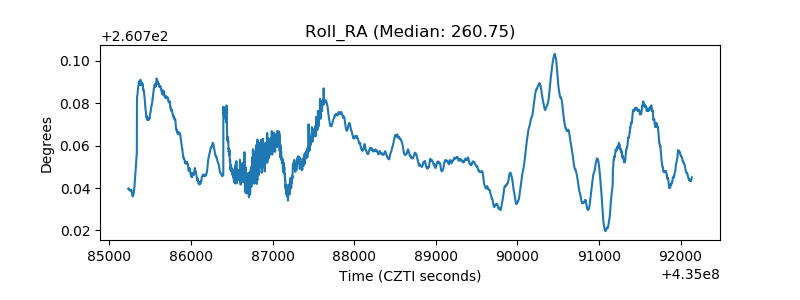 |
| Veto Counter | 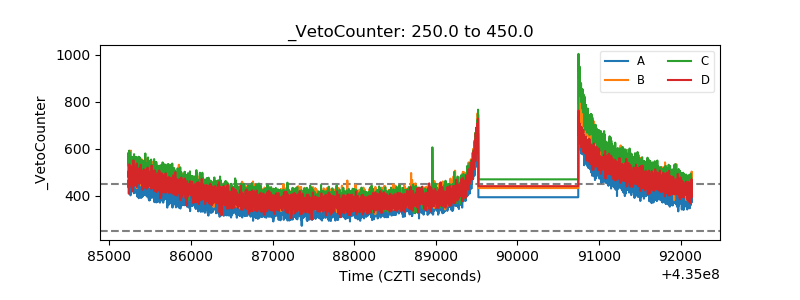 |