| Param | Original file | Final file |
|---|---|---|
| Filename | modeM0/AS1A12_018T01_9000005874_43518cztM0_level2.fits | modeM0/AS1A12_018T01_9000005874_43518cztM0_level2_quad_clean.evt |
| Size (bytes) | 1,000,293,120 | 59,460,480 |
| Size | 954.0 MB | 56.7 MB |
| Events in quadrant A | 9,463,669 | 618,804 |
| Events in quadrant B | 10,131,692 | 603,544 |
| Events in quadrant C | 14,567,695 | 165,593 |
| Events in quadrant D | 2,417,471 | 3,263 |
| Mode M0 | |||
|---|---|---|---|
| Quadrant | BADHDUFLAG | Total packets | Discarded packets |
| A | 0 | 32133 | 1 |
| B | 0 | 34078 | 1 |
| C | 0 | 47151 | 1 |
| D | 0 | 11096 | 2 |
| Mode M9 | |||
|---|---|---|---|
| Quadrant | BADHDUFLAG | Total packets | Discarded packets |
| A | 0 | 13 | 0 |
| B | 0 | 13 | 0 |
| C | 0 | 13 | 0 |
| D | 0 | 13 | 0 |
| Mode SS | |||
|---|---|---|---|
| Quadrant | BADHDUFLAG | Total packets | Discarded packets |
| A | 0 | 114 | 0 |
| B | 0 | 114 | 0 |
| C | 0 | 114 | 0 |
| D | 0 | 114 | 0 |
| Quadrant | Total seconds | Saturated seconds | Saturation percentage |
|---|---|---|---|
| A | 5752 | 2007 | 34.892211% |
| B | 5752 | 2630 | 45.723227% |
| C | 5752 | 5747 | 99.913074% |
| D | 5752 | 5752 | 100.000000% |
Noise dominated data is calculated using 1-second bins in cleaned event files. If a bin has >2000 counts, and if more than 50% of those come from <1% of pixels, then it is considered to be noise-dominated and hence unusable.
| Quadrant | # 1 sec bins | Bins with >0 counts | Bins with >2000 counts | High rate bins dominated by noise | Noise dominated (total time) | Noise dominated (detector-on time) | Marked lightcurve |
|---|---|---|---|---|---|---|---|
| A | 6972 | 5753 | 1580 | 1580 | 22.66% | 27.46% | 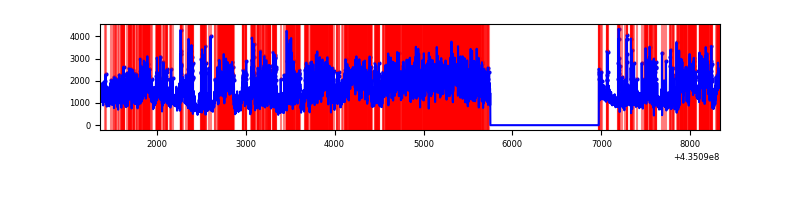 |
| B | 6972 | 5752 | 2178 | 2178 | 31.24% | 37.87% | 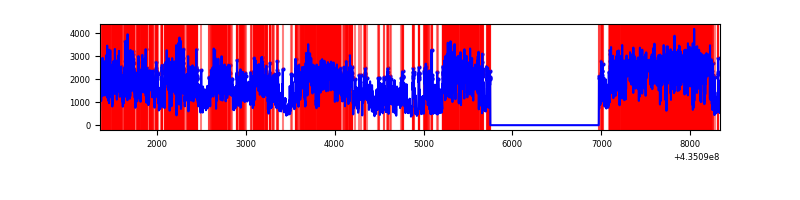 |
| C | 6971 | 5751 | 5579 | 5579 | 80.03% | 97.01% | 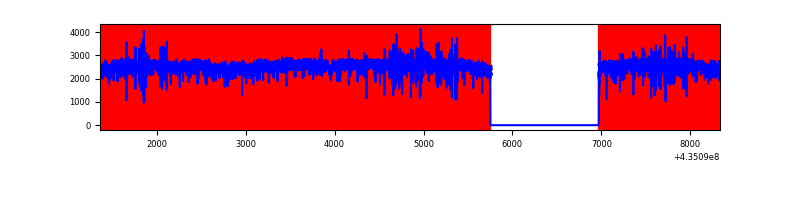 |
| D | 6971 | 5751 | 17 | 17 | 0.24% | 0.30% | 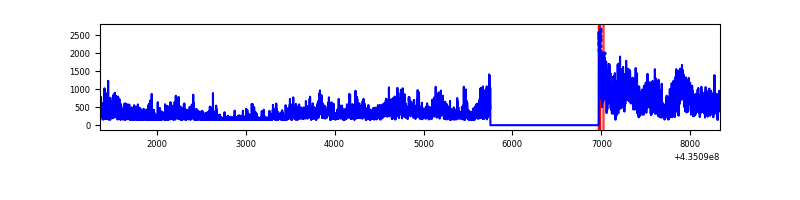 |
Top three noisy pixels from each quadrant. If the there are fewer than three noisy pixels in the level2.evt file, extra rows are filled as -1
| Pixel properties | Quadrant properties | ||||||
|---|---|---|---|---|---|---|---|
| Quadrant | DetID | PixID | Counts | Sigma | Mean | Median | Sigma |
| A | 0 | 228 | 3288709 | 27399.83 | 585 | 575 | 120.0 |
| A | 14 | 235 | 1319150 | 10987.61 | 585 | 575 | 120.0 |
| A | 0 | 229 | 601214 | 5005.09 | 585 | 575 | 120.0 |
| B | 3 | 42 | 5209699 | 49551.54 | 555 | 541 | 105.1 |
| B | 3 | 25 | 1719409 | 16350.54 | 555 | 541 | 105.1 |
| B | 4 | 206 | 308634 | 2930.7 | 555 | 541 | 105.1 |
| C | 15 | 158 | 10311581 | 241185.18 | 173 | 173 | 42.8 |
| C | 15 | 174 | 667737 | 15614.41 | 173 | 173 | 42.8 |
| C | 15 | 142 | 640755 | 14983.3 | 173 | 173 | 42.8 |
| D | 4 | 216 | 306332 | 59512.16 | 5 | 4 | 5.1 |
| D | 4 | 215 | 213301 | 41438.48 | 5 | 4 | 5.1 |
| D | 4 | 214 | 200113 | 38876.37 | 5 | 4 | 5.1 |
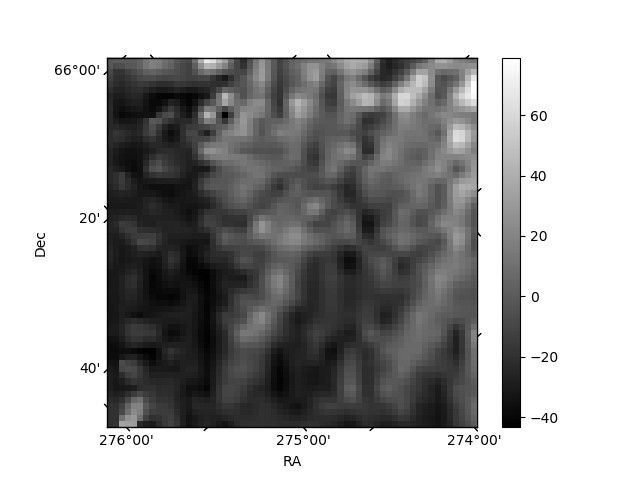
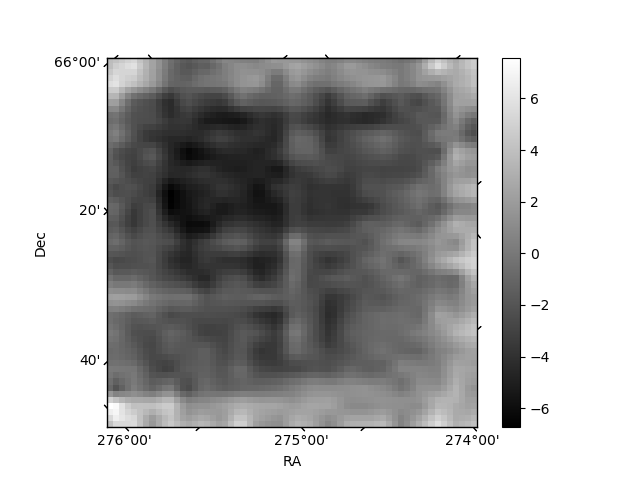
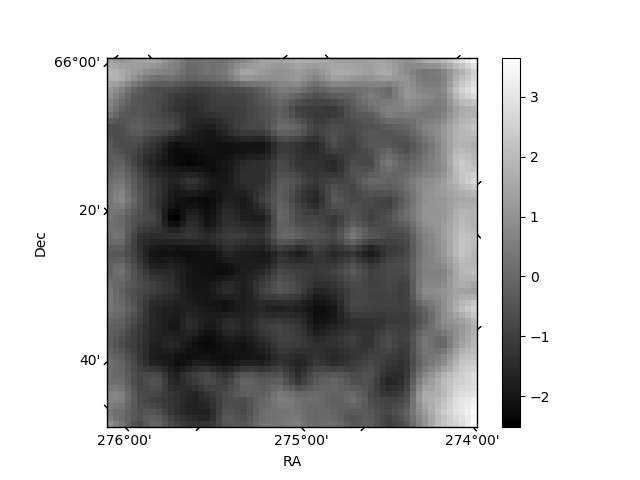
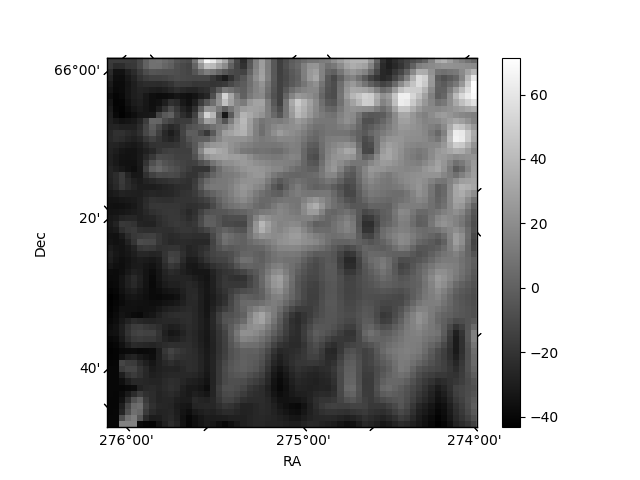
Histogram calculated using DETX and DETY for each event in the final _common_clean file
| Quadrant A | 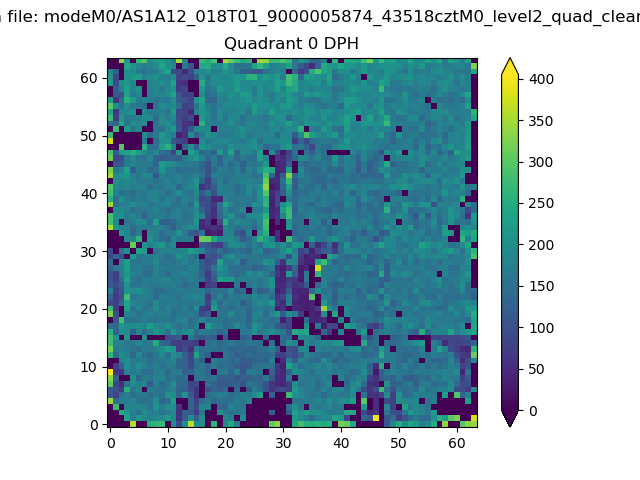 |
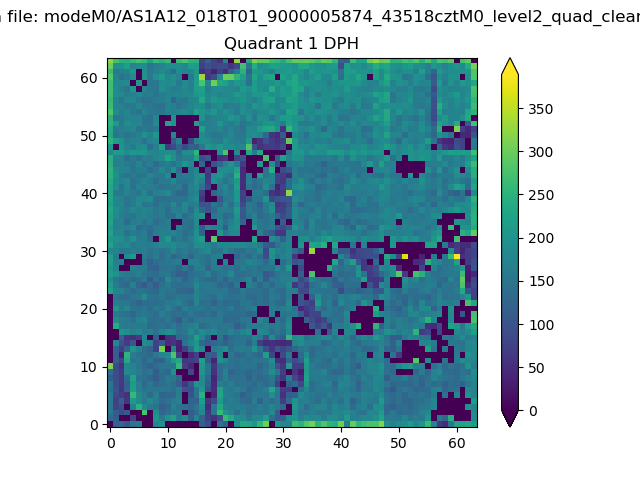 |
Quadrant B |
|---|---|---|---|
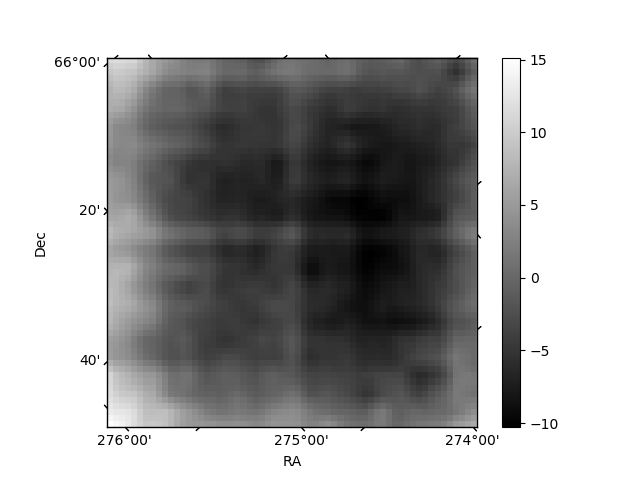
| Quadrant D | 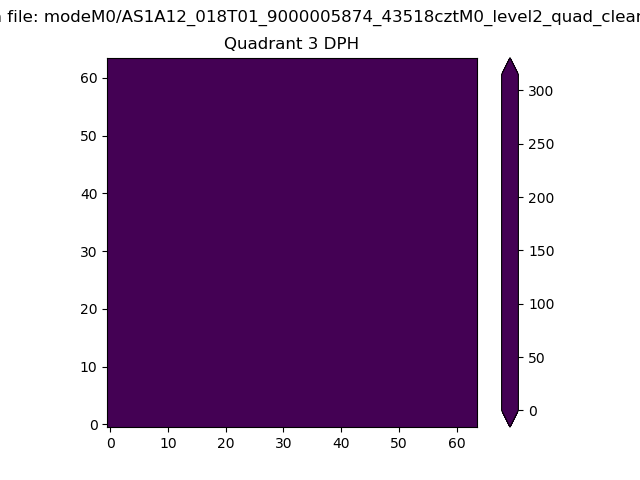 |
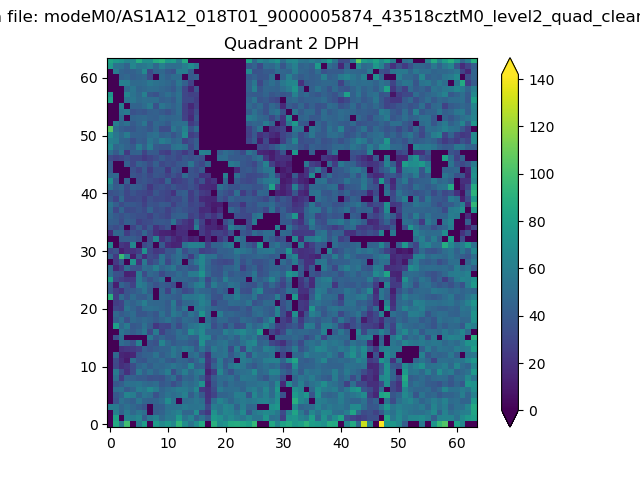 |
Quadrant C |
| Plot type | Count rate plots | Images |
|---|---|---|
| Comparison with Poisson distribution Blue bars denote a histogram of data divided into 1 sec bins. Red curve is a Poisson curve with rate = median count rate of data. |
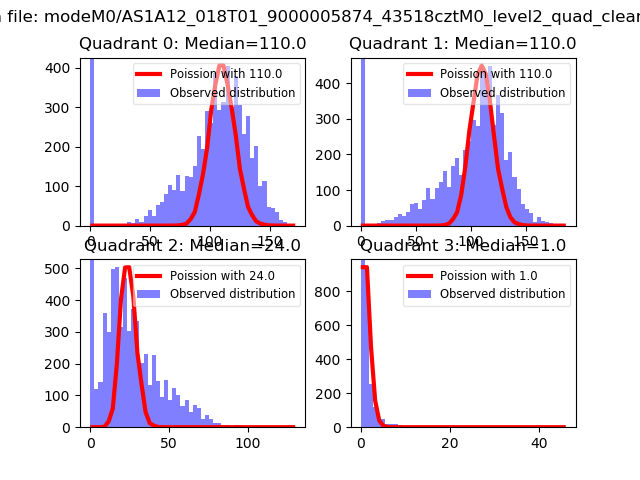 |
 |
| Quadrant-wise count rates Data is divided into 100 sec bins |
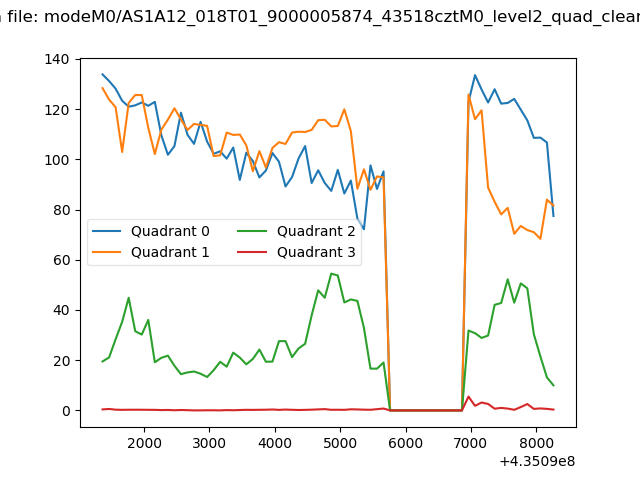 |
|
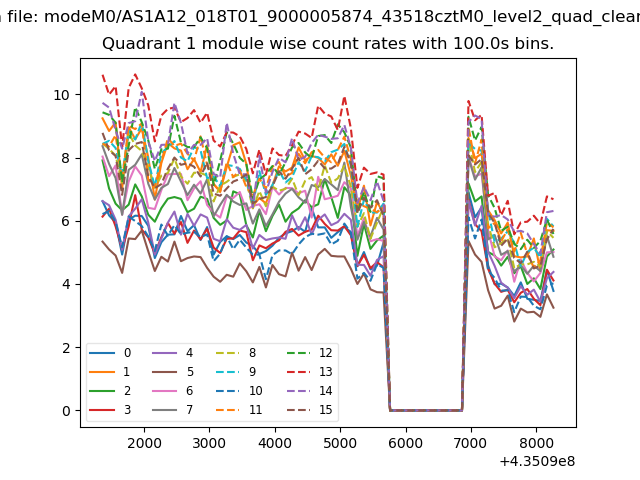
| Module-wise count rates for Quadrant A Data is divided into 100 sec bins |
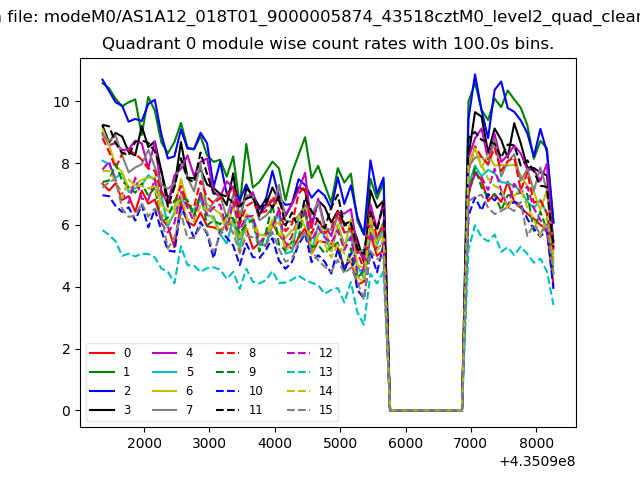 |
 |
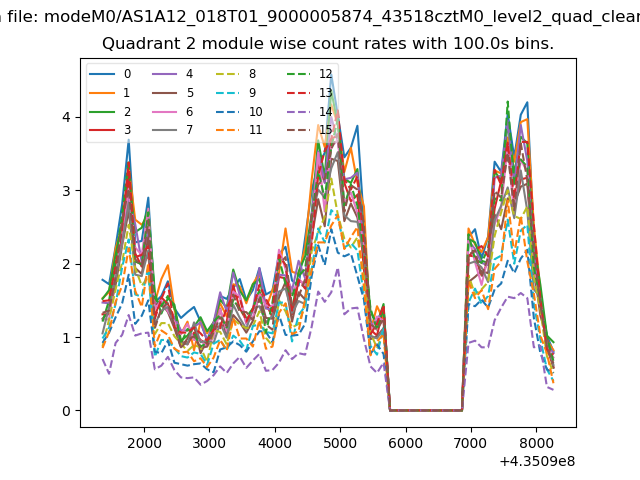
| Module-wise count rates for Quadrant B Data is divided into 100 sec bins |
 |
 |
| Module-wise count rates for Quadrant C Data is divided into 100 sec bins |
 |
 |
| Module-wise count rates for Quadrant D Data is divided into 100 sec bins |
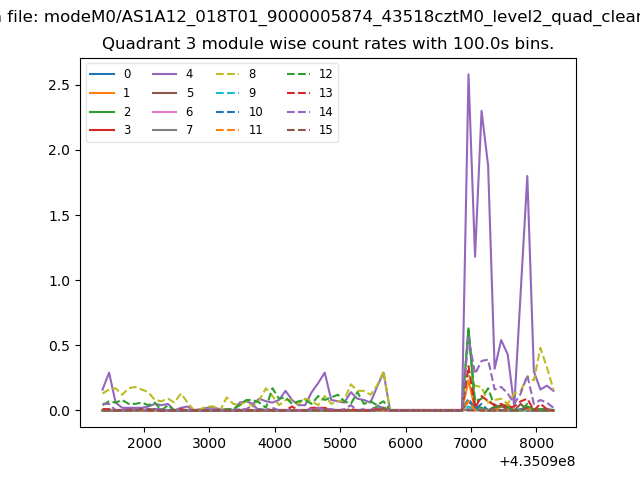 |
 |
| Parameter | Plot |
|---|---|
| CZT HV Monitor | 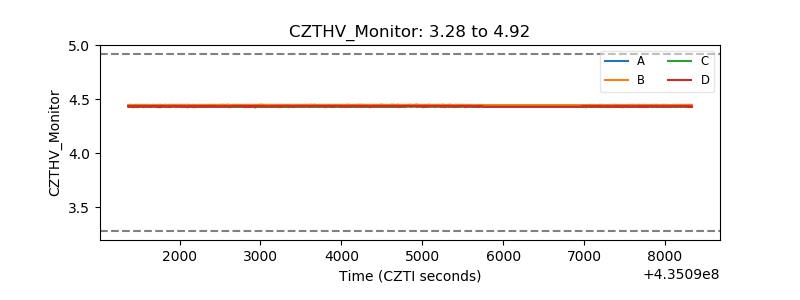 |
| D_VDD | 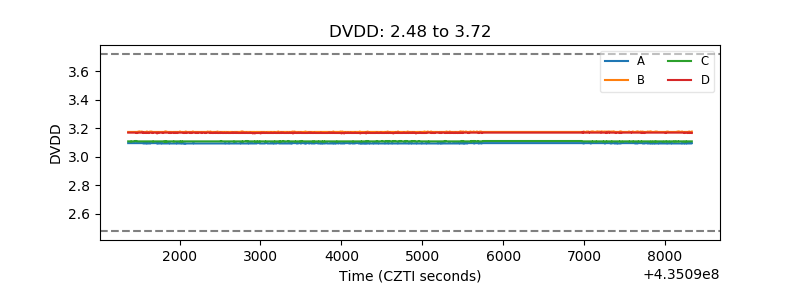 |
| Temperature 1 | 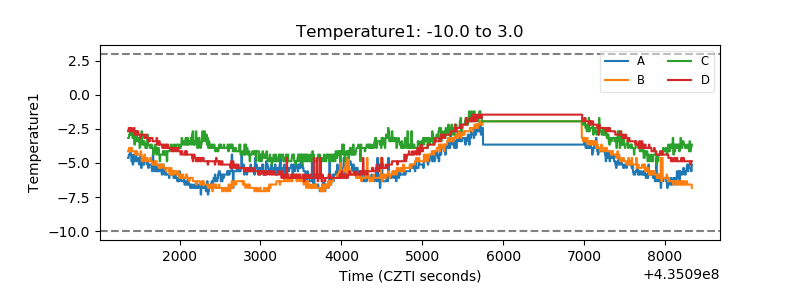 |
| Veto HV Monitor | 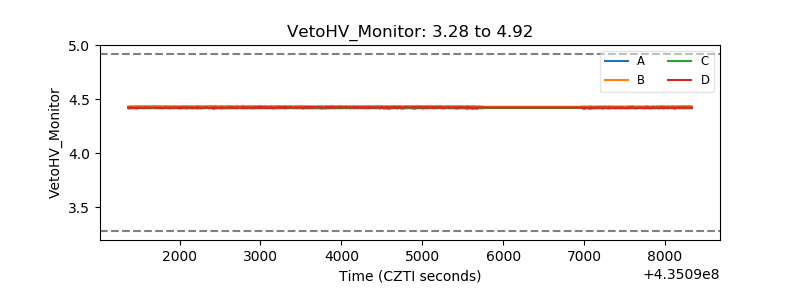 |
| Veto LLD | 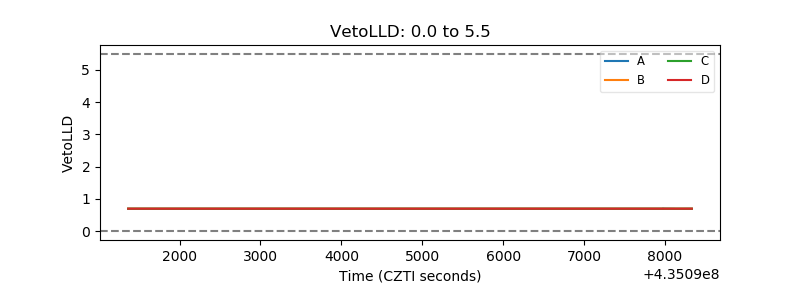 |
| Alpha Counter | 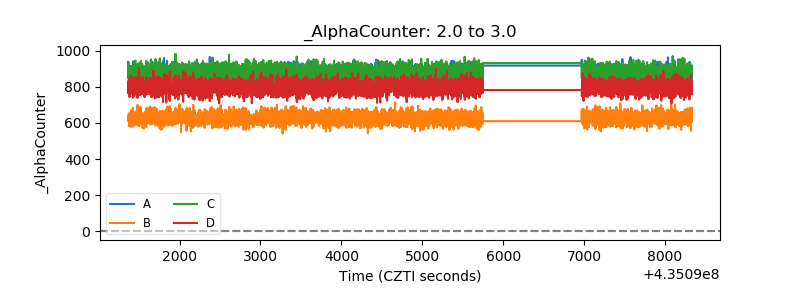 |
| _CPM_Rate | 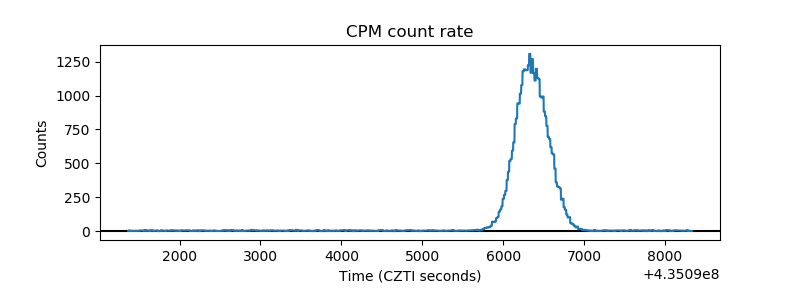 |
| CZT Counter | 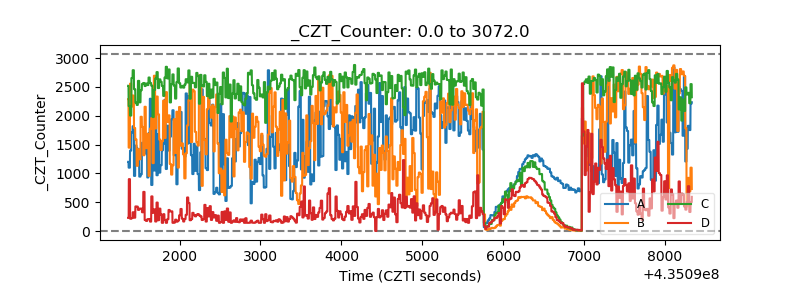 |
| +2.5 Volts monitor | 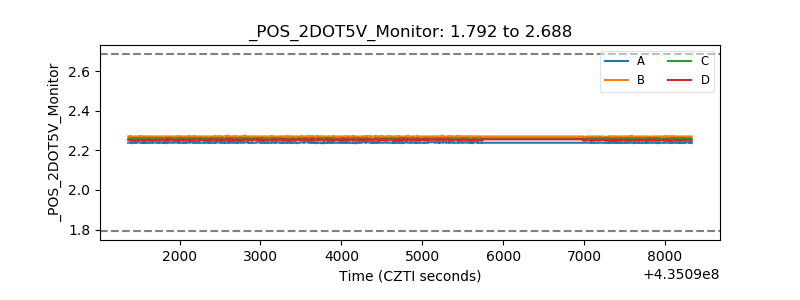 |
| +5 Volts monitor | 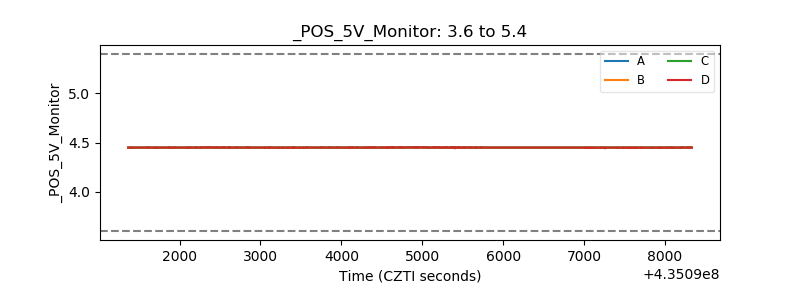 |
| _ROLL_ROT |  |
| _Roll_DEC | 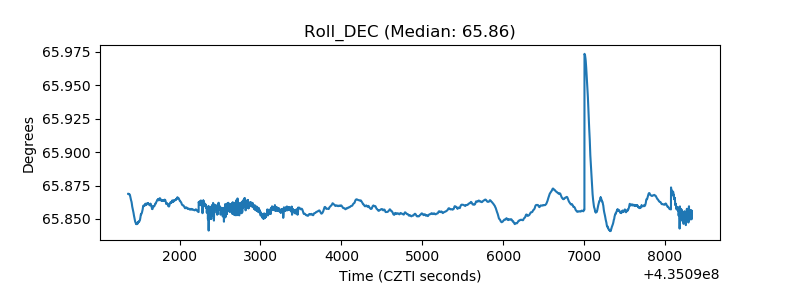 |
| _Roll_RA | 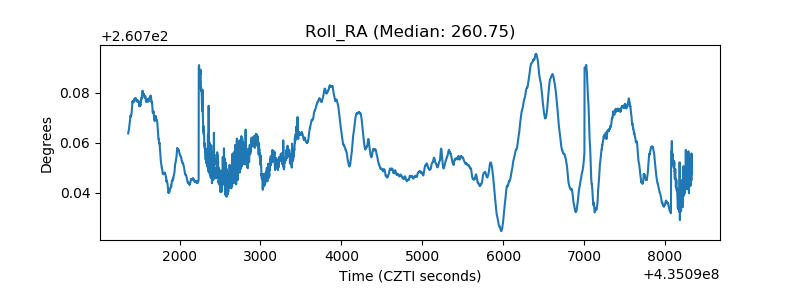 |
| Veto Counter | 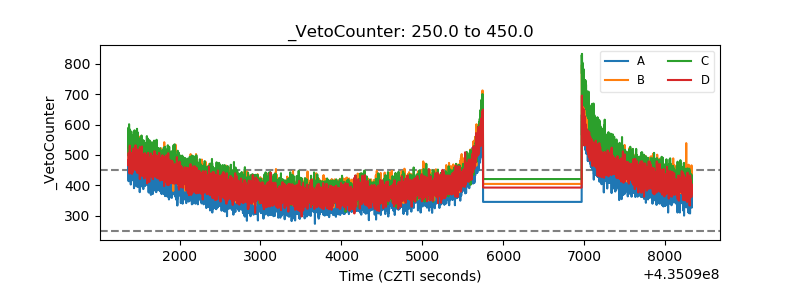 |