| Param | Original file | Final file |
|---|---|---|
| Filename | modeM0/AS1A12_018T01_9000005874_43521cztM0_level2.fits | modeM0/AS1A12_018T01_9000005874_43521cztM0_level2_quad_clean.evt |
| Size (bytes) | 1,224,627,840 | 67,412,160 |
| Size | 1.1 GB | 64.3 MB |
| Events in quadrant A | 10,905,819 | 657,033 |
| Events in quadrant B | 9,871,238 | 650,460 |
| Events in quadrant C | 17,815,433 | 238,154 |
| Events in quadrant D | 6,206,537 | 7,889 |
| Mode M0 | |||
|---|---|---|---|
| Quadrant | BADHDUFLAG | Total packets | Discarded packets |
| A | 0 | 37204 | 3 |
| B | 0 | 34093 | 2 |
| C | 0 | 57651 | 2 |
| D | 0 | 23260 | 2 |
| Mode M9 | |||
|---|---|---|---|
| Quadrant | BADHDUFLAG | Total packets | Discarded packets |
| A | 0 | 3 | 0 |
| B | 0 | 3 | 0 |
| C | 0 | 3 | 0 |
| D | 0 | 3 | 0 |
| Mode SS | |||
|---|---|---|---|
| Quadrant | BADHDUFLAG | Total packets | Discarded packets |
| A | 0 | 140 | 0 |
| B | 0 | 140 | 0 |
| C | 0 | 140 | 0 |
| D | 0 | 140 | 0 |
| Quadrant | Total seconds | Saturated seconds | Saturation percentage |
|---|---|---|---|
| A | 6874 | 2608 | 37.940064% |
| B | 6874 | 2410 | 35.059645% |
| C | 6875 | 6859 | 99.767273% |
| D | 6875 | 6875 | 100.000000% |
Noise dominated data is calculated using 1-second bins in cleaned event files. If a bin has >2000 counts, and if more than 50% of those come from <1% of pixels, then it is considered to be noise-dominated and hence unusable.
| Quadrant | # 1 sec bins | Bins with >0 counts | Bins with >2000 counts | High rate bins dominated by noise | Noise dominated (total time) | Noise dominated (detector-on time) | Marked lightcurve |
|---|---|---|---|---|---|---|---|
| A | 7099 | 6877 | 1817 | 1817 | 25.60% | 26.42% | 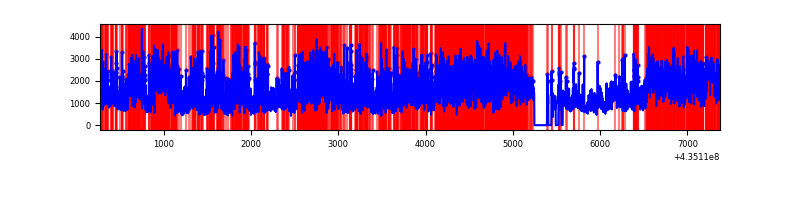 |
| B | 7099 | 6876 | 1856 | 1856 | 26.14% | 26.99% | 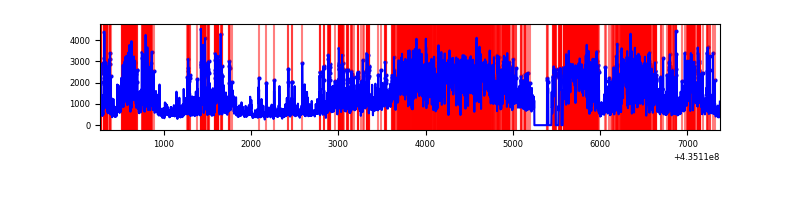 |
| C | 7099 | 6874 | 6625 | 6625 | 93.32% | 96.38% | 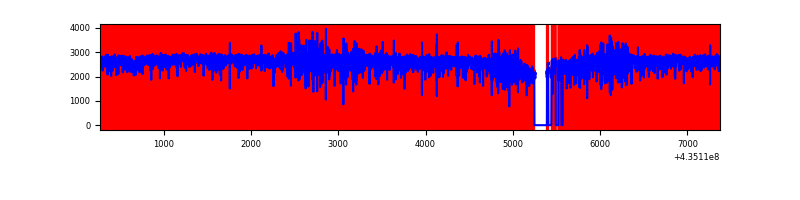 |
| D | 7099 | 6874 | 172 | 172 | 2.42% | 2.50% | 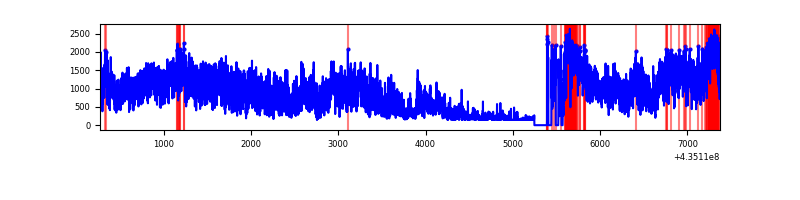 |
Top three noisy pixels from each quadrant. If the there are fewer than three noisy pixels in the level2.evt file, extra rows are filled as -1
| Pixel properties | Quadrant properties | ||||||
|---|---|---|---|---|---|---|---|
| Quadrant | DetID | PixID | Counts | Sigma | Mean | Median | Sigma |
| A | 0 | 228 | 3546767 | 25714.98 | 667 | 653 | 137.9 |
| A | 0 | 175 | 1504041 | 10901.96 | 667 | 653 | 137.9 |
| A | 14 | 235 | 1059929 | 7681.44 | 667 | 653 | 137.9 |
| B | 3 | 25 | 5462365 | 44155.35 | 642 | 625 | 123.7 |
| B | 3 | 42 | 1040774 | 8409.07 | 642 | 625 | 123.7 |
| B | 4 | 206 | 154570 | 1244.57 | 642 | 625 | 123.7 |
| C | 15 | 158 | 11231671 | 183913.97 | 255 | 256 | 61.1 |
| C | 15 | 142 | 2142838 | 35084.69 | 255 | 256 | 61.1 |
| C | 5 | 80 | 1565464 | 25630.22 | 255 | 256 | 61.1 |
| D | 4 | 214 | 1540663 | 100814.17 | 11 | 10 | 15.3 |
| D | 4 | 216 | 986711 | 64565.77 | 11 | 10 | 15.3 |
| D | 4 | 215 | 570900 | 37356.76 | 11 | 10 | 15.3 |
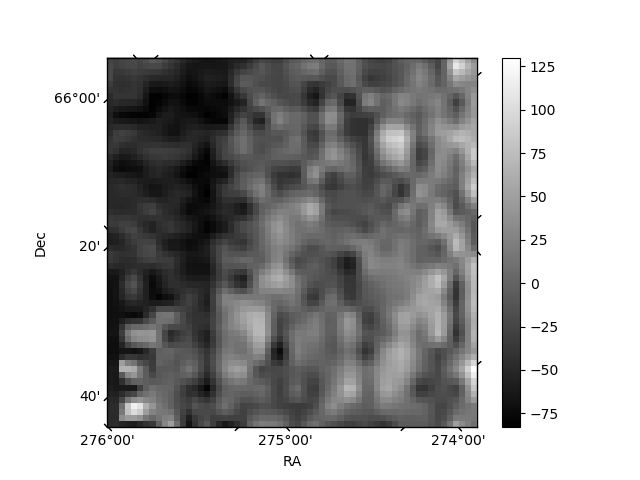
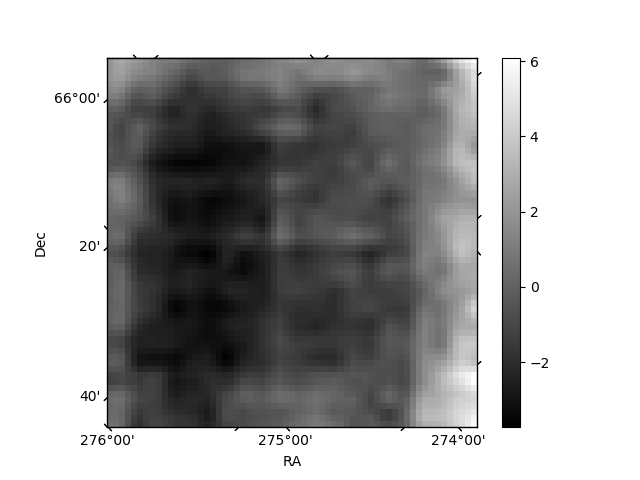
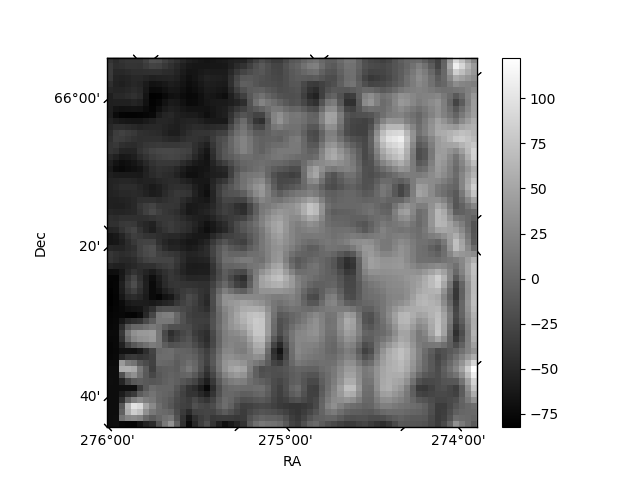
Histogram calculated using DETX and DETY for each event in the final _common_clean file
| Quadrant A | 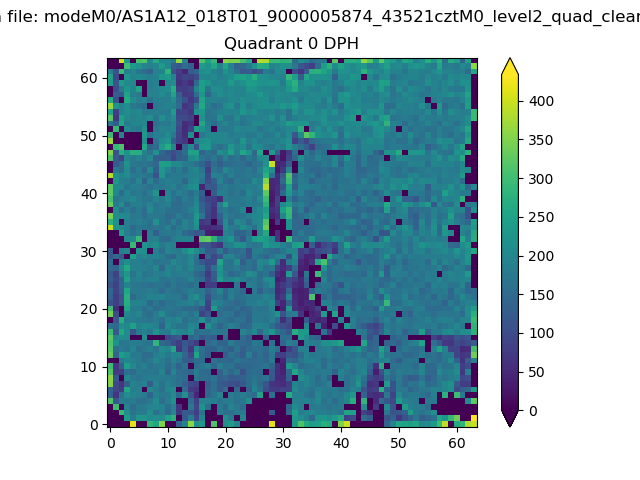 |
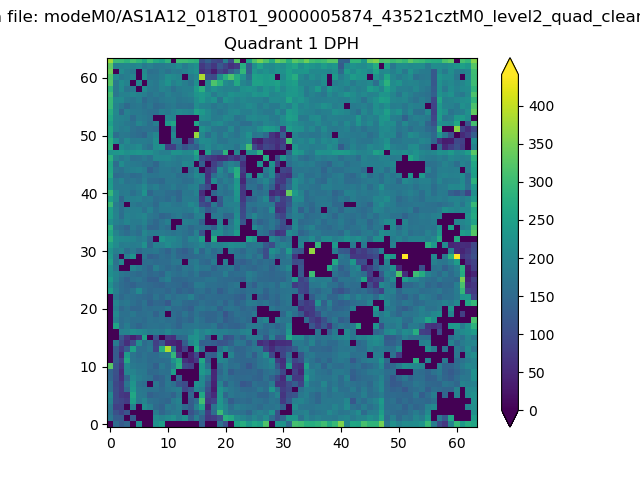 |
Quadrant B |
|---|---|---|---|
| Quadrant D | 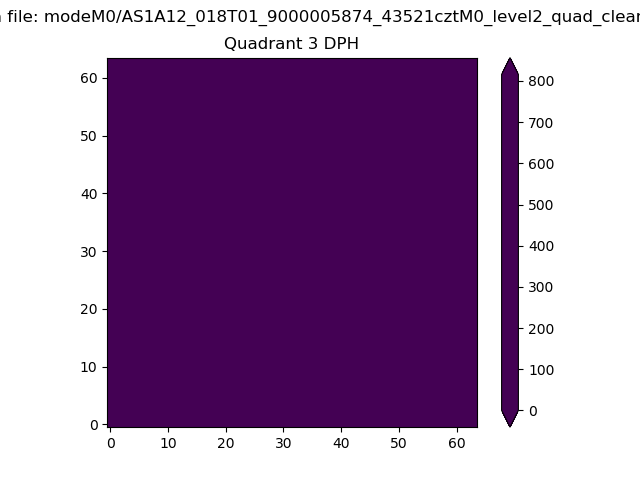 |
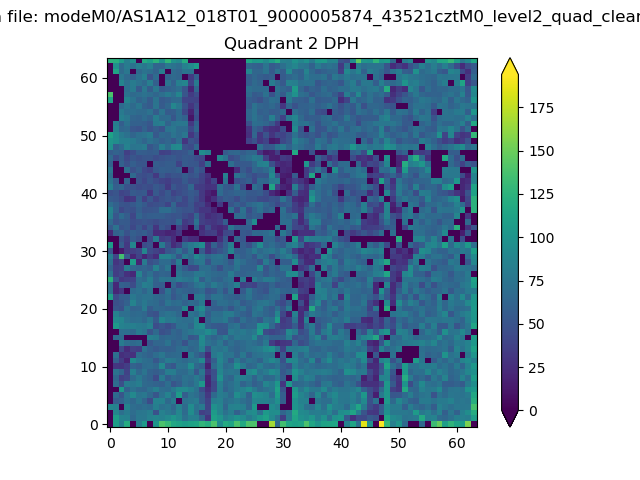 |
Quadrant C |
| Plot type | Count rate plots | Images |
|---|---|---|
| Comparison with Poisson distribution Blue bars denote a histogram of data divided into 1 sec bins. Red curve is a Poisson curve with rate = median count rate of data. |
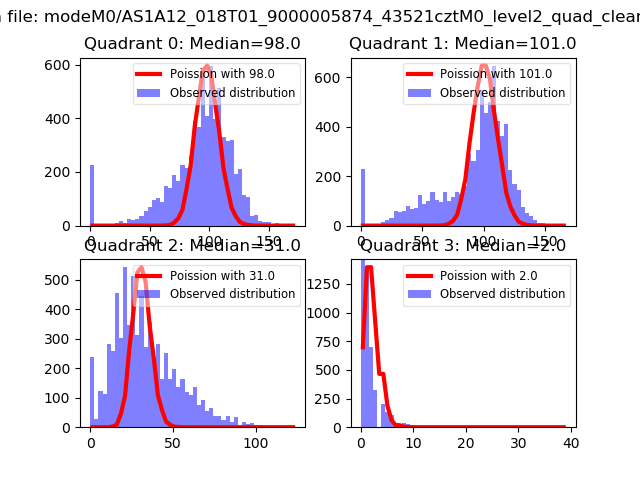 |
 |
| Quadrant-wise count rates Data is divided into 100 sec bins |
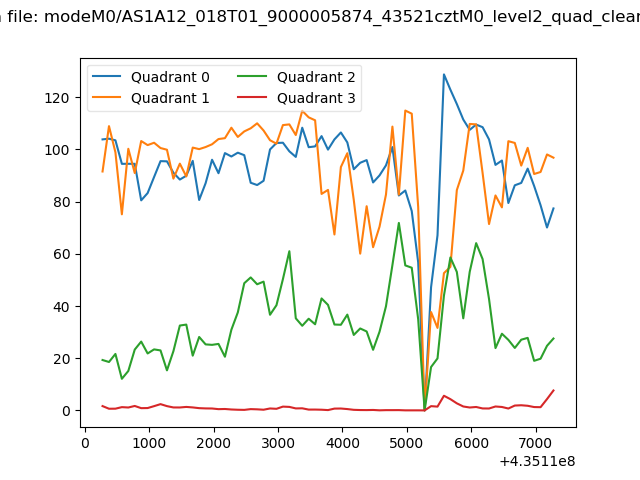 |
|
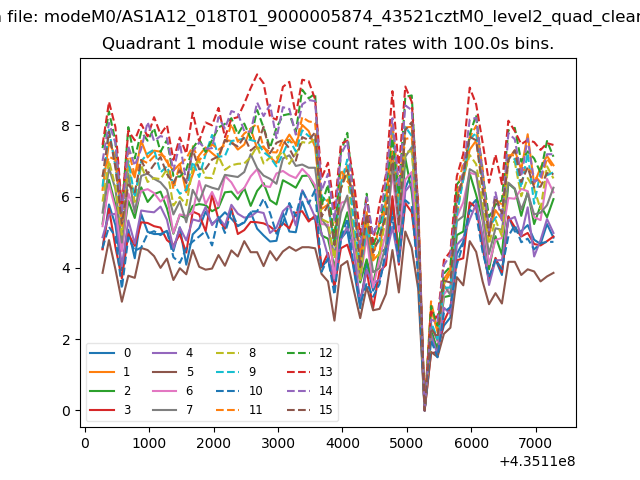
| Module-wise count rates for Quadrant A Data is divided into 100 sec bins |
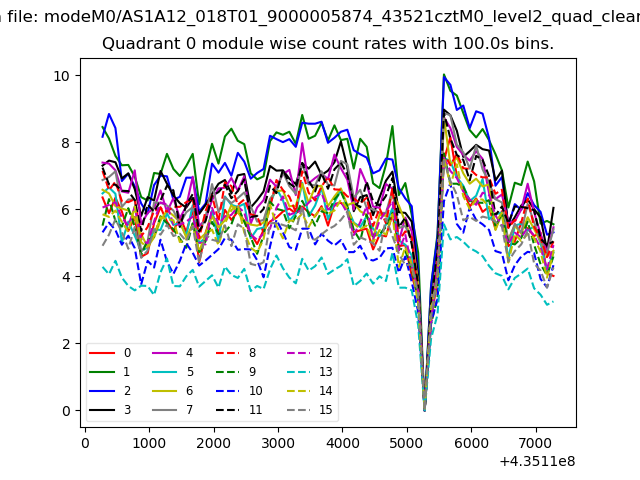 |
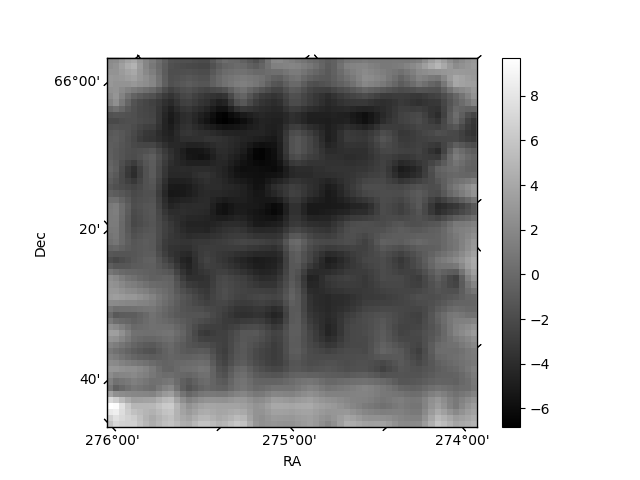 |
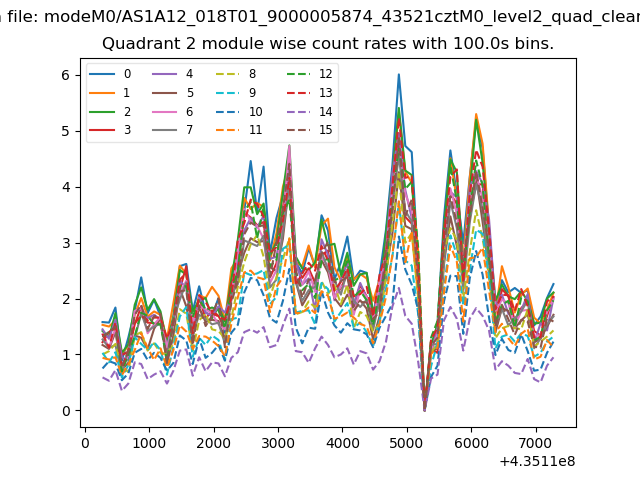
| Module-wise count rates for Quadrant B Data is divided into 100 sec bins |
 |
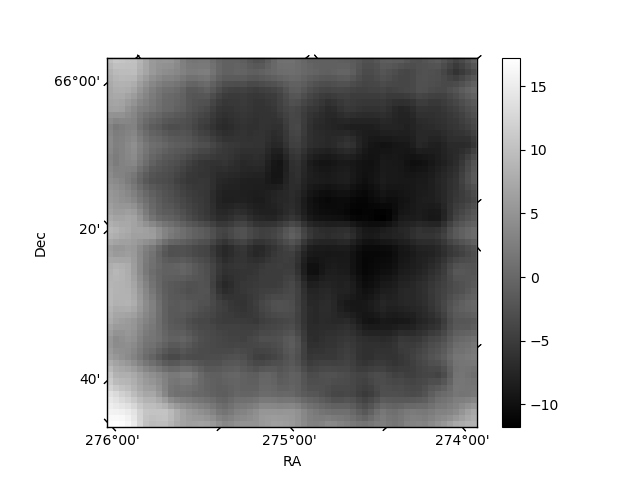 |
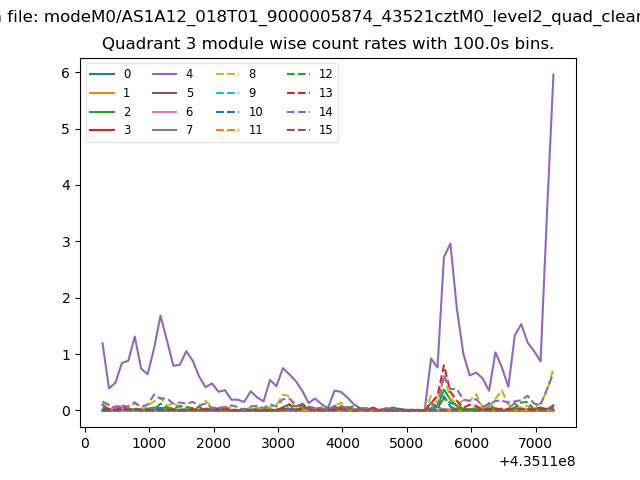
| Module-wise count rates for Quadrant C Data is divided into 100 sec bins |
 |
 |
| Module-wise count rates for Quadrant D Data is divided into 100 sec bins |
 |
 |
| Parameter | Plot |
|---|---|
| CZT HV Monitor |  |
| D_VDD | 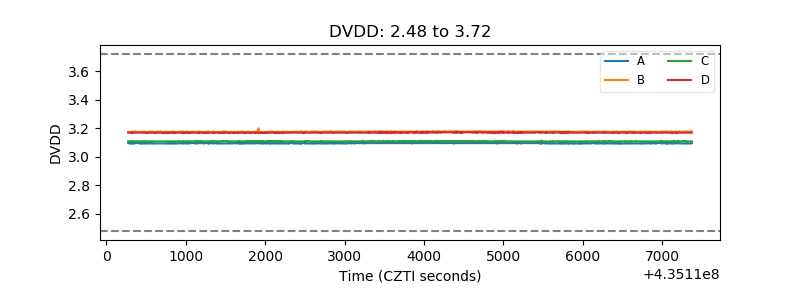 |
| Temperature 1 | 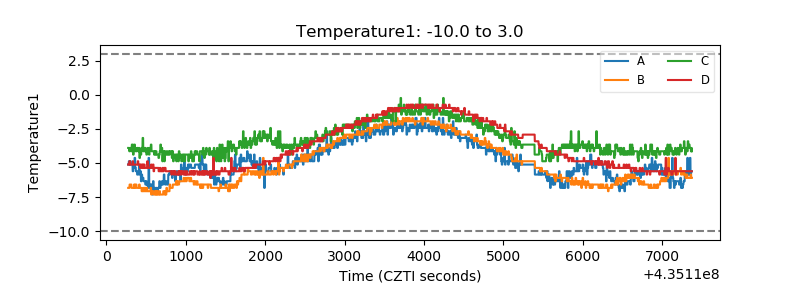 |
| Veto HV Monitor | 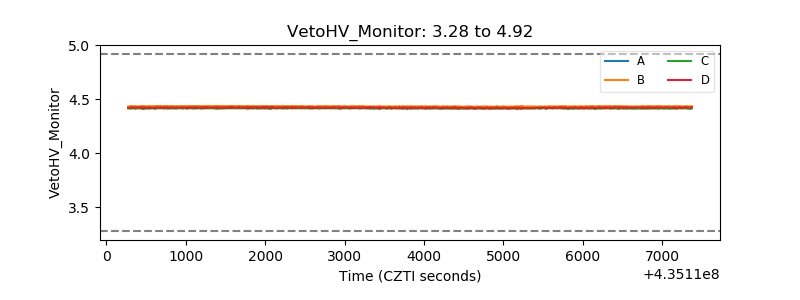 |
| Veto LLD | 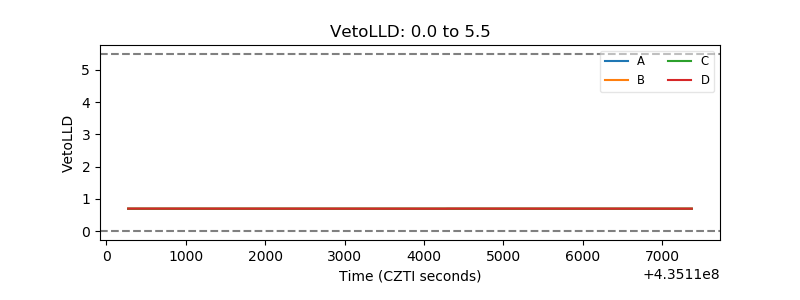 |
| Alpha Counter | 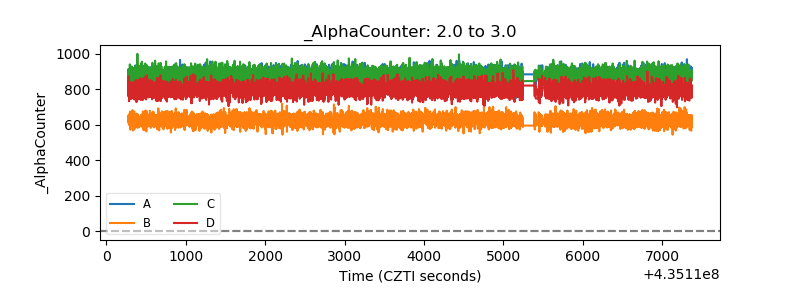 |
| _CPM_Rate | 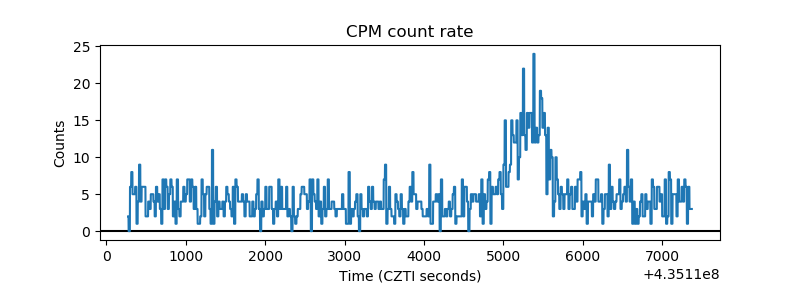 |
| CZT Counter | 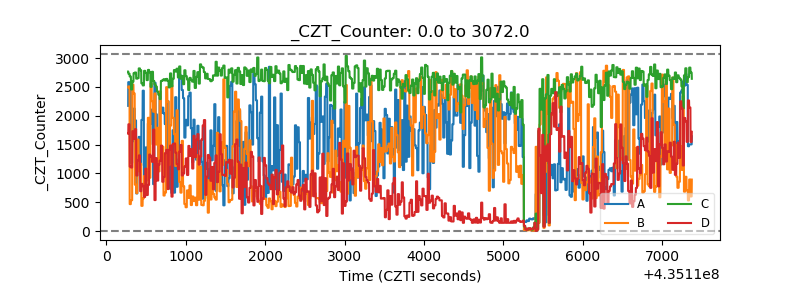 |
| +2.5 Volts monitor | 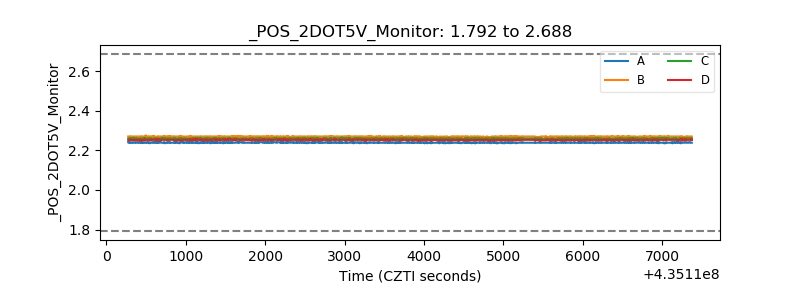 |
| +5 Volts monitor | 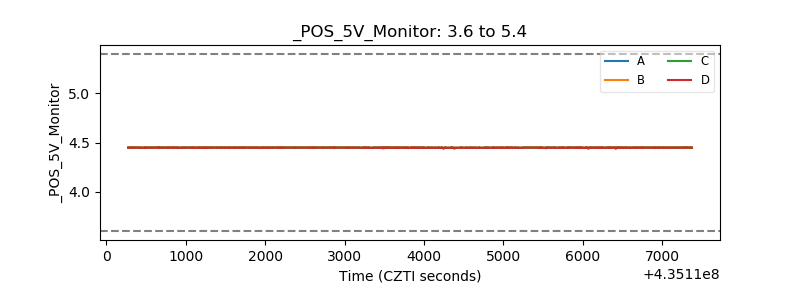 |
| _ROLL_ROT | 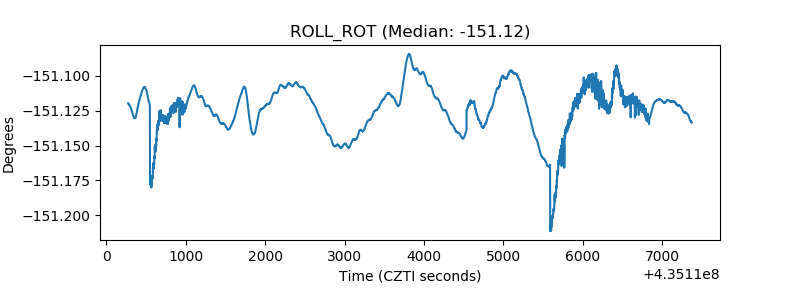 |
| _Roll_DEC | 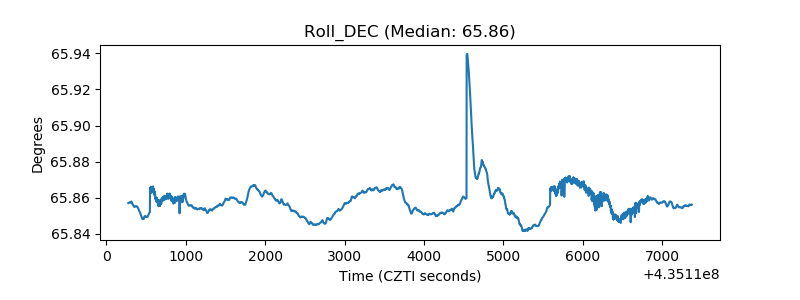 |
| _Roll_RA | 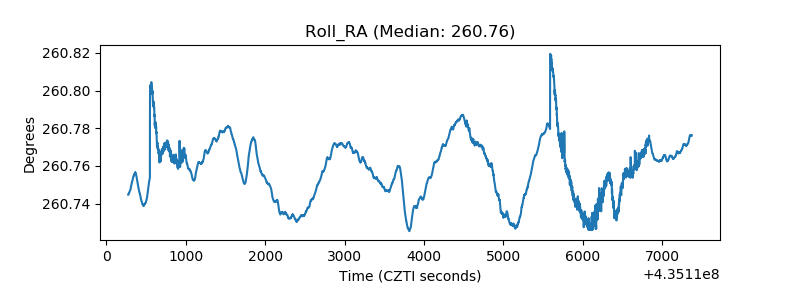 |
| Veto Counter | 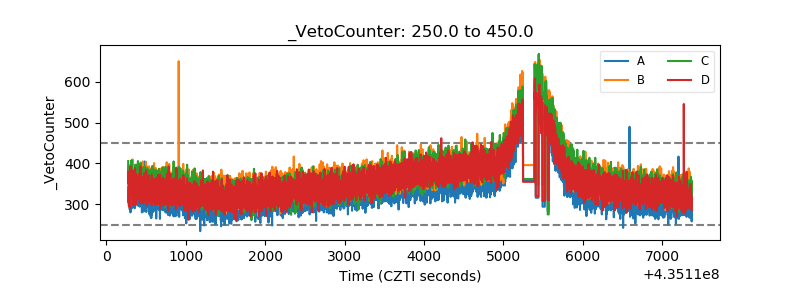 |