| Param | Original file | Final file |
|---|---|---|
| Filename | modeM0/AS1A12_018T01_9000005874_43523cztM0_level2.fits | modeM0/AS1A12_018T01_9000005874_43523cztM0_level2_quad_clean.evt |
| Size (bytes) | 1,221,497,280 | 68,261,760 |
| Size | 1.1 GB | 65.1 MB |
| Events in quadrant A | 15,443,966 | 504,504 |
| Events in quadrant B | 9,512,489 | 698,992 |
| Events in quadrant C | 17,450,711 | 358,397 |
| Events in quadrant D | 2,258,169 | 1,485 |
| Mode M0 | |||
|---|---|---|---|
| Quadrant | BADHDUFLAG | Total packets | Discarded packets |
| A | 0 | 50680 | 0 |
| B | 0 | 33213 | 0 |
| C | 0 | 56653 | 0 |
| D | 0 | 11440 | 1 |
| Mode SS | |||
|---|---|---|---|
| Quadrant | BADHDUFLAG | Total packets | Discarded packets |
| A | 0 | 142 | 0 |
| B | 0 | 142 | 0 |
| C | 0 | 142 | 0 |
| D | 0 | 142 | 0 |
| Quadrant | Total seconds | Saturated seconds | Saturation percentage |
|---|---|---|---|
| A | 7078 | 5843 | 82.551568% |
| B | 7078 | 1883 | 26.603560% |
| C | 7079 | 6830 | 96.482554% |
| D | 7078 | 7078 | 100.000000% |
Noise dominated data is calculated using 1-second bins in cleaned event files. If a bin has >2000 counts, and if more than 50% of those come from <1% of pixels, then it is considered to be noise-dominated and hence unusable.
| Quadrant | # 1 sec bins | Bins with >0 counts | Bins with >2000 counts | High rate bins dominated by noise | Noise dominated (total time) | Noise dominated (detector-on time) | Marked lightcurve |
|---|---|---|---|---|---|---|---|
| A | 7077 | 7077 | 4654 | 4654 | 65.76% | 65.76% | 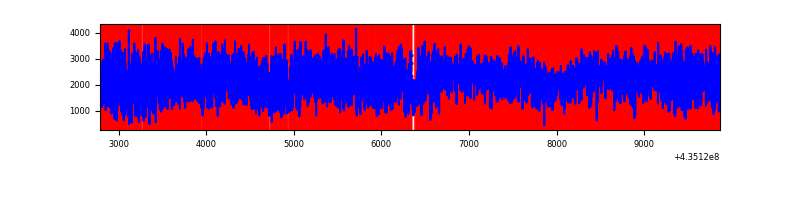 |
| B | 7078 | 7078 | 1314 | 1314 | 18.56% | 18.56% | 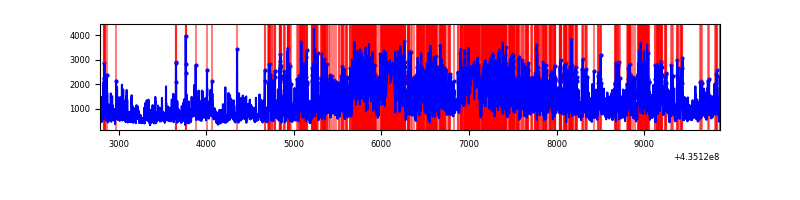 |
| C | 7078 | 7078 | 6219 | 6219 | 87.86% | 87.86% | 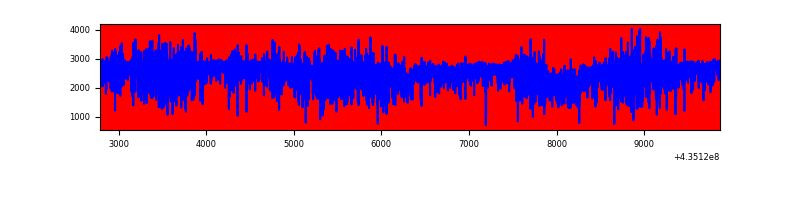 |
| D | 7077 | 7077 | 0 | 0 | 0.00% | 0.00% | 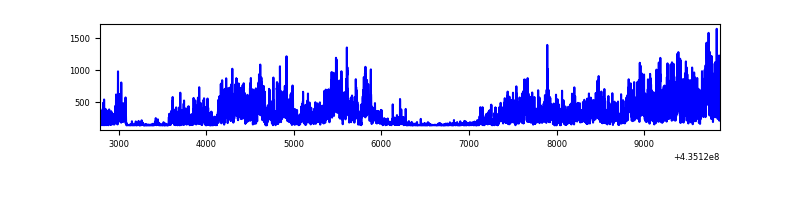 |
Top three noisy pixels from each quadrant. If the there are fewer than three noisy pixels in the level2.evt file, extra rows are filled as -1
| Pixel properties | Quadrant properties | ||||||
|---|---|---|---|---|---|---|---|
| Quadrant | DetID | PixID | Counts | Sigma | Mean | Median | Sigma |
| A | 0 | 228 | 8399344 | 76676.83 | 525 | 515 | 109.5 |
| A | 0 | 229 | 2039599 | 18615.75 | 525 | 515 | 109.5 |
| A | 0 | 226 | 648478 | 5915.56 | 525 | 515 | 109.5 |
| B | 3 | 42 | 3392395 | 24752.93 | 699 | 677 | 137.0 |
| B | 3 | 25 | 1804056 | 13161.15 | 699 | 677 | 137.0 |
| B | 4 | 36 | 633188 | 4616.1 | 699 | 677 | 137.0 |
| C | 15 | 158 | 3197140 | 36179.28 | 373 | 375 | 88.4 |
| C | 15 | 174 | 2748679 | 31103.83 | 373 | 375 | 88.4 |
| C | 15 | 142 | 2711809 | 30686.56 | 373 | 375 | 88.4 |
| D | 4 | 201 | 433957 | 92120.79 | 4 | 3 | 4.7 |
| D | 4 | 216 | 373796 | 79349.67 | 4 | 3 | 4.7 |
| D | 4 | 214 | 322345 | 68427.53 | 4 | 3 | 4.7 |
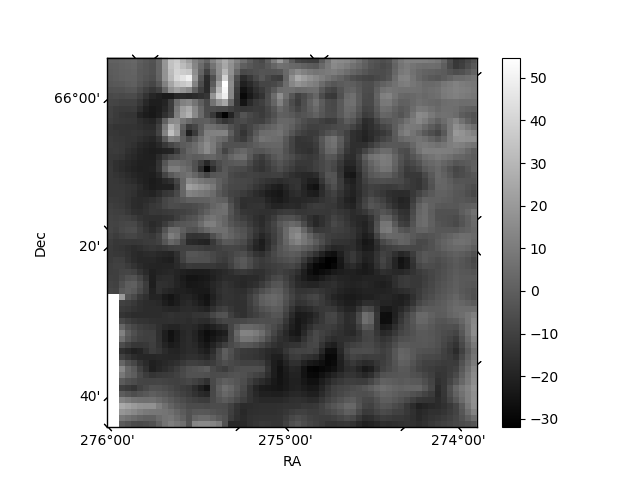
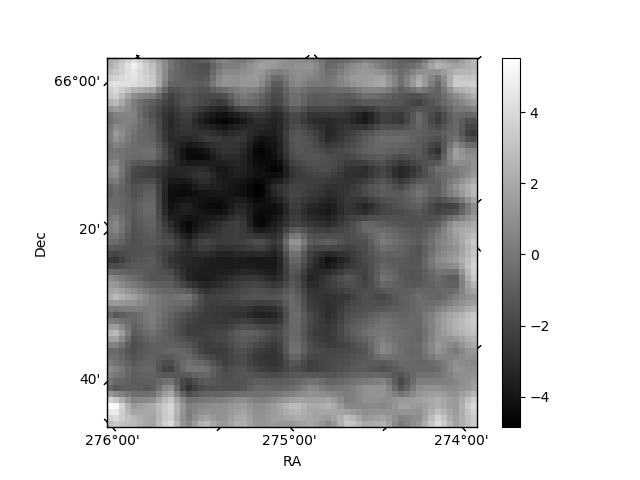
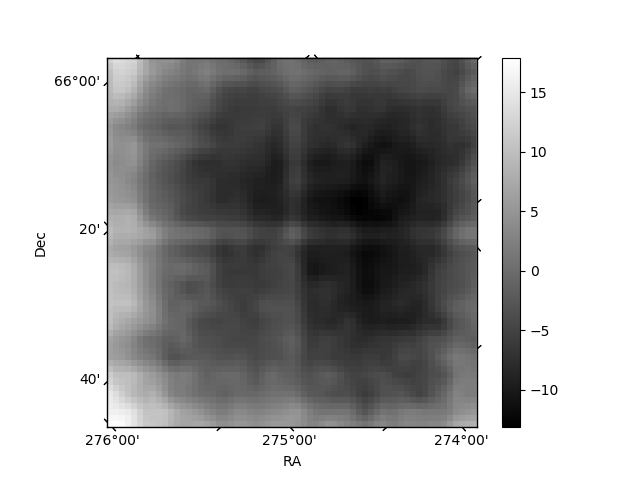
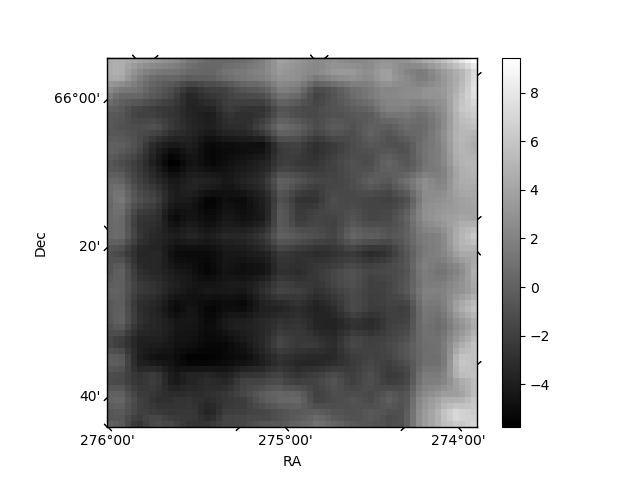
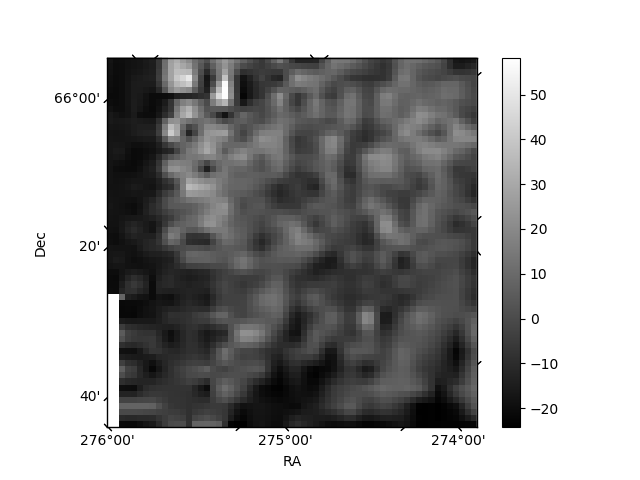
Histogram calculated using DETX and DETY for each event in the final _common_clean file
| Quadrant A | 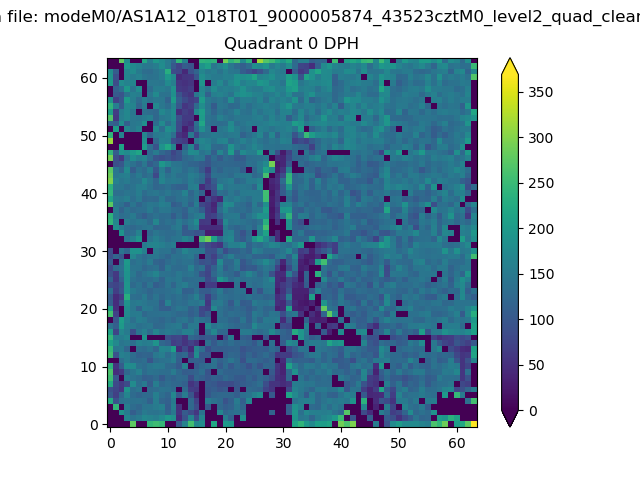 |
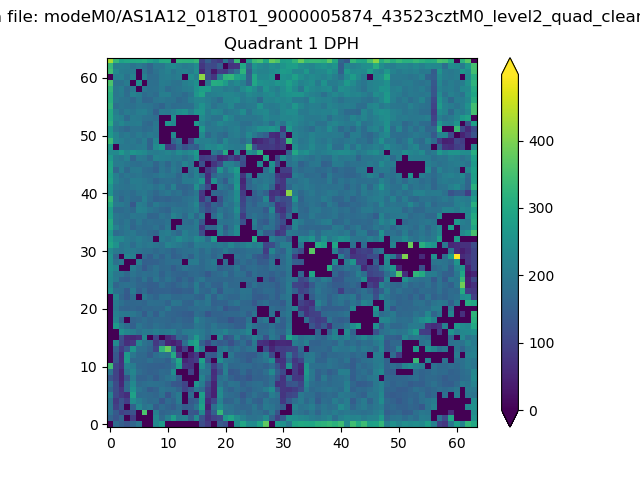 |
Quadrant B |
|---|---|---|---|
| Quadrant D | 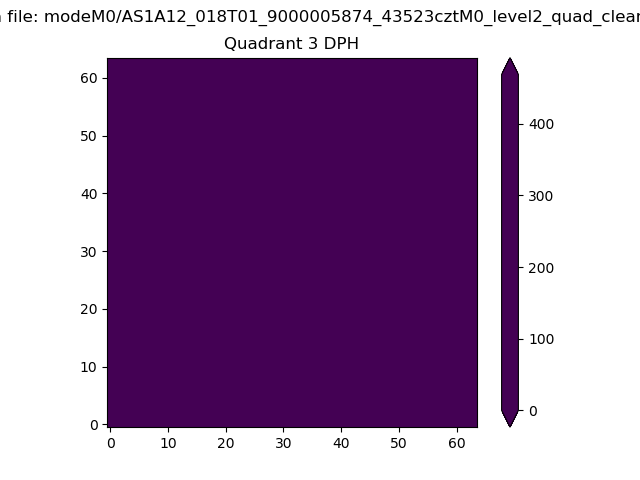 |
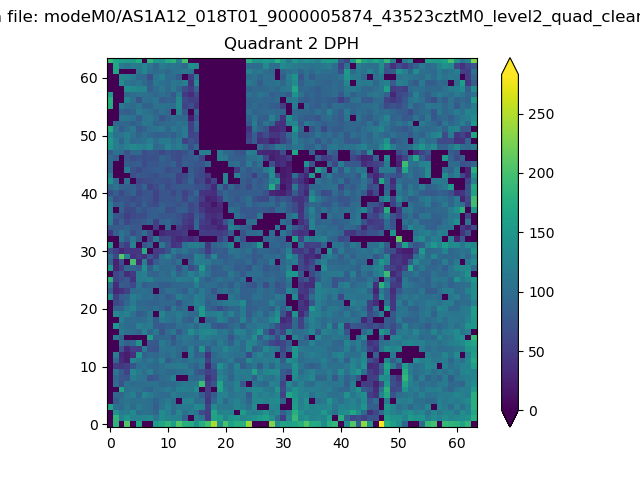 |
Quadrant C |
| Plot type | Count rate plots | Images |
|---|---|---|
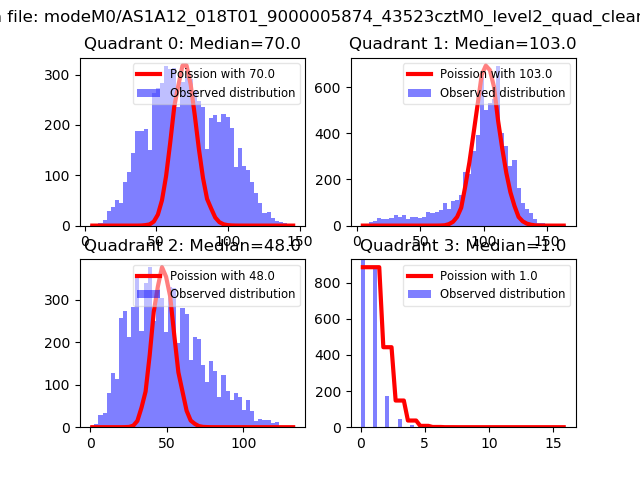
| Comparison with Poisson distribution Blue bars denote a histogram of data divided into 1 sec bins. Red curve is a Poisson curve with rate = median count rate of data. |
 |
 |
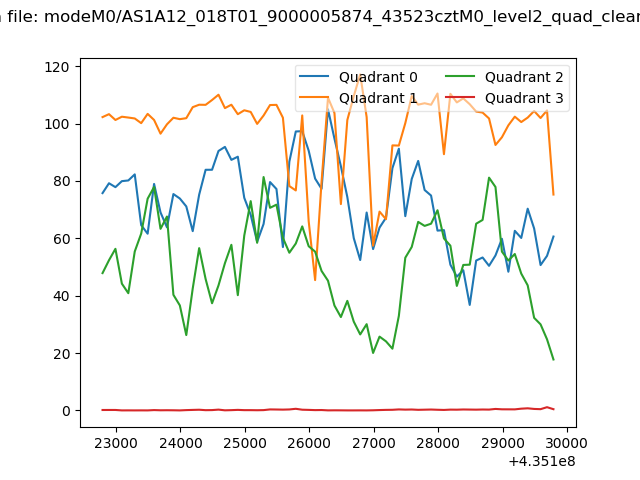
| Quadrant-wise count rates Data is divided into 100 sec bins |
 |
|
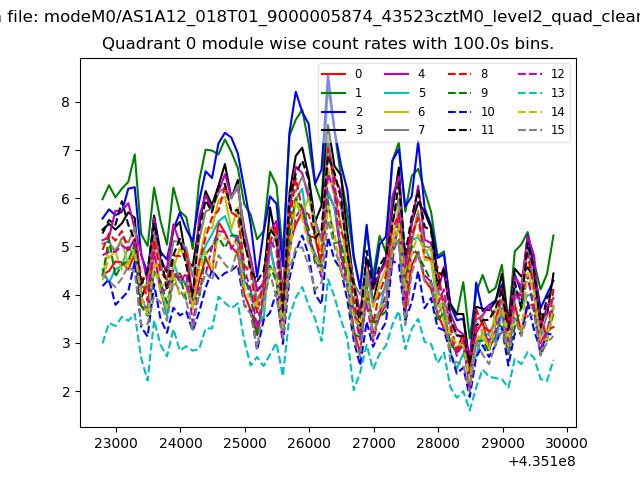
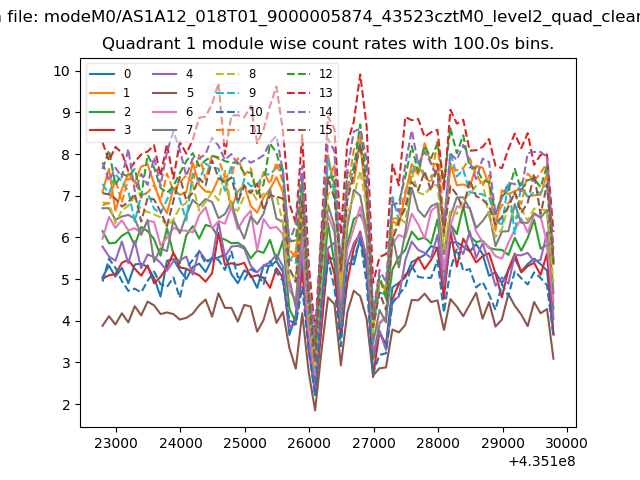
| Module-wise count rates for Quadrant A Data is divided into 100 sec bins |
 |
 |
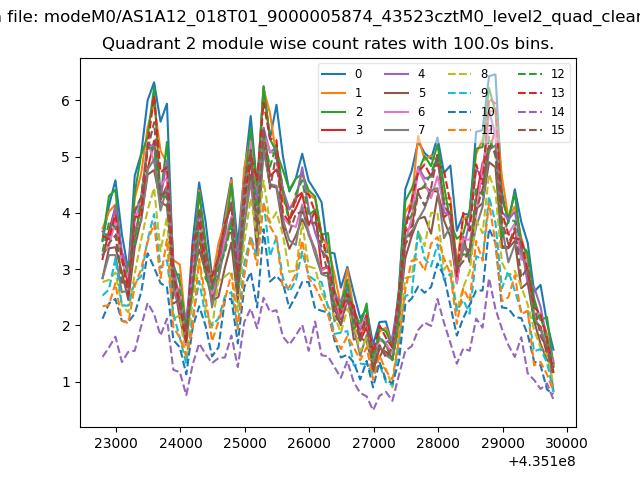
| Module-wise count rates for Quadrant B Data is divided into 100 sec bins |
 |
 |
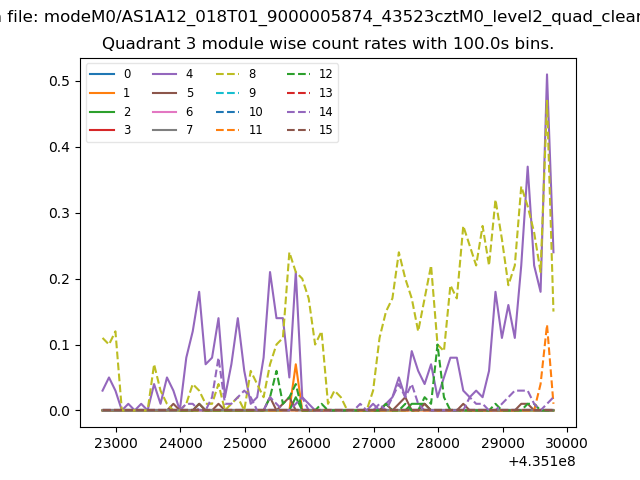
| Module-wise count rates for Quadrant C Data is divided into 100 sec bins |
 |
 |
| Module-wise count rates for Quadrant D Data is divided into 100 sec bins |
 |
 |
| Parameter | Plot |
|---|---|
| CZT HV Monitor | 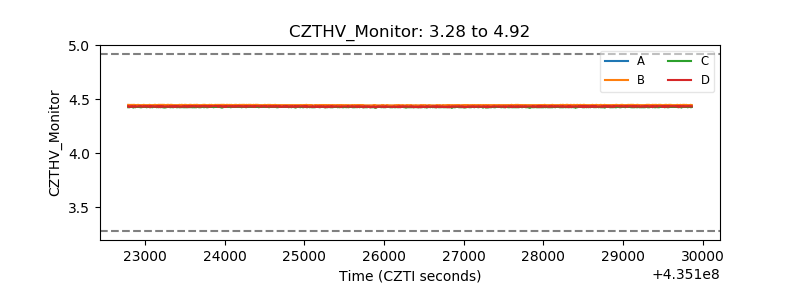 |
| D_VDD | 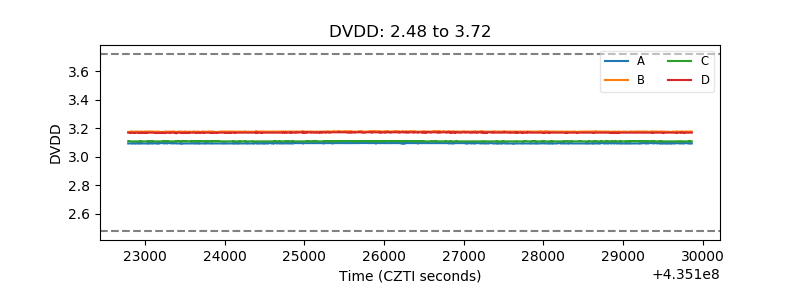 |
| Temperature 1 | 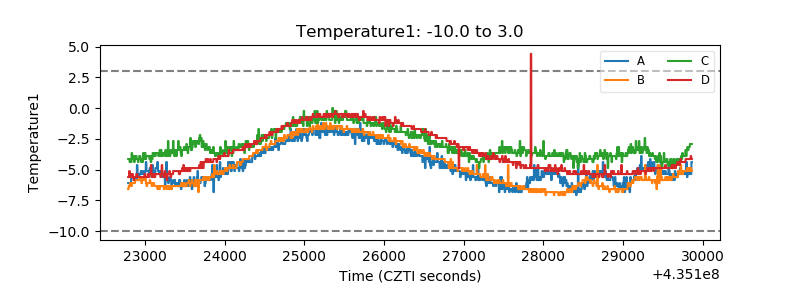 |
| Veto HV Monitor | 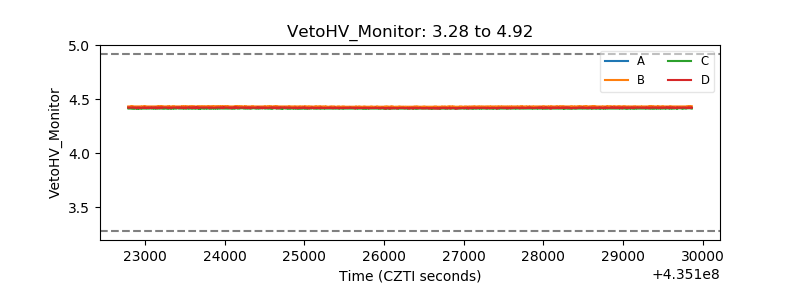 |
| Veto LLD | 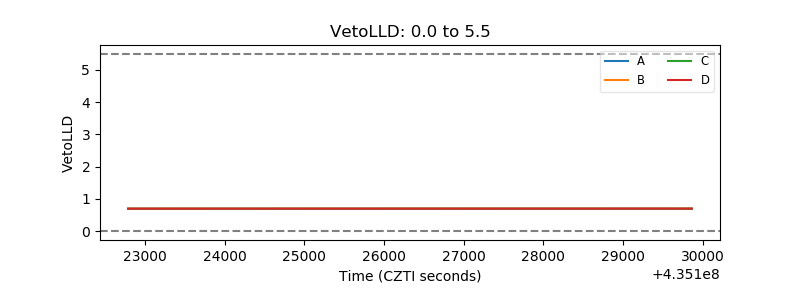 |
| Alpha Counter | 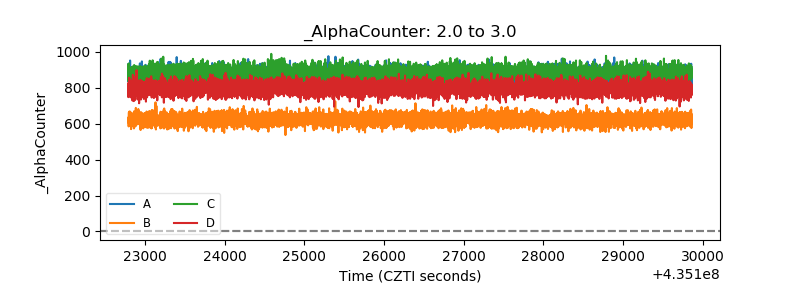 |
| _CPM_Rate | 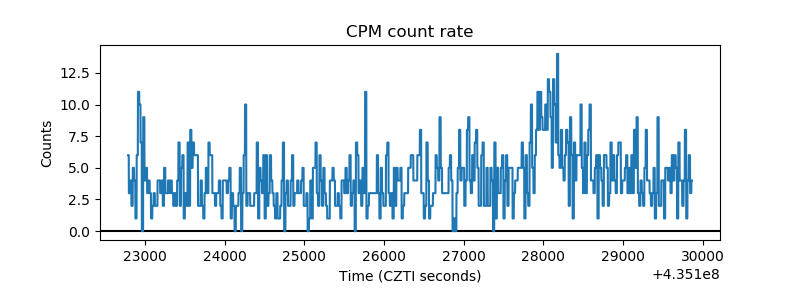 |
| CZT Counter | 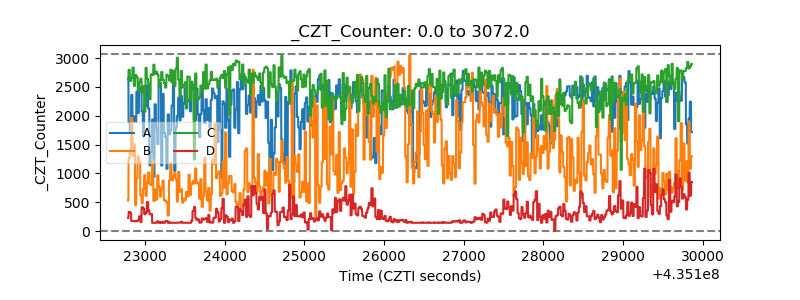 |
| +2.5 Volts monitor | 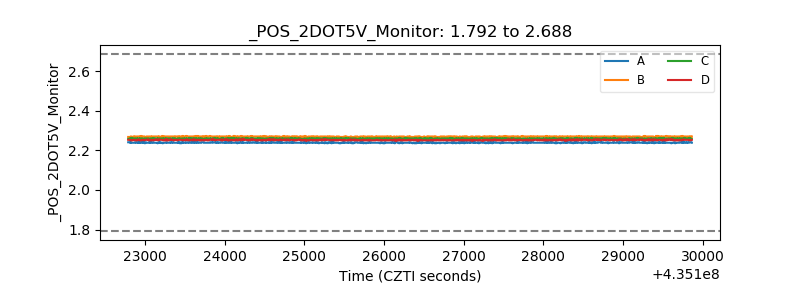 |
| +5 Volts monitor | 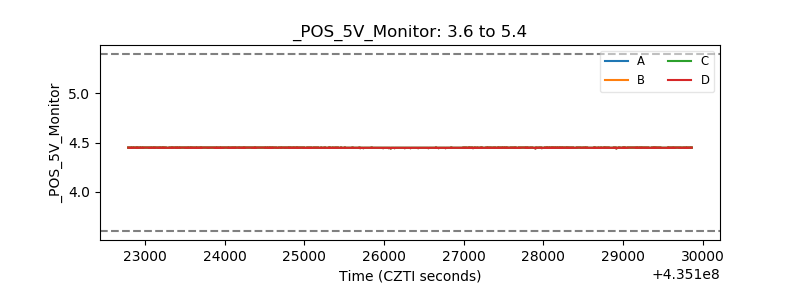 |
| _ROLL_ROT | 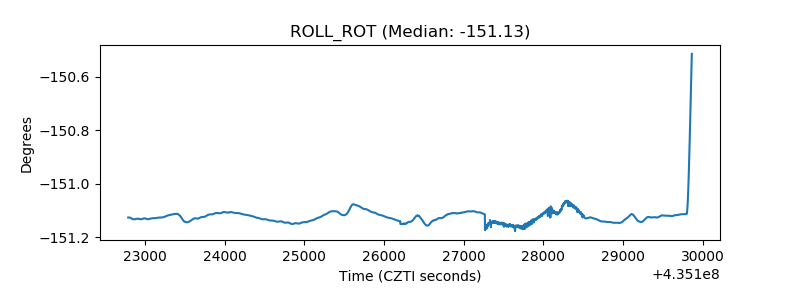 |
| _Roll_DEC | 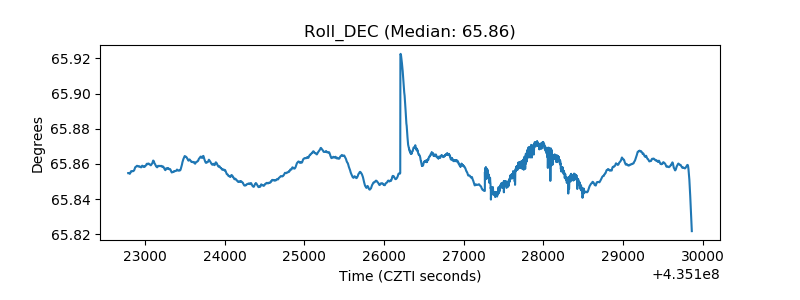 |
| _Roll_RA | 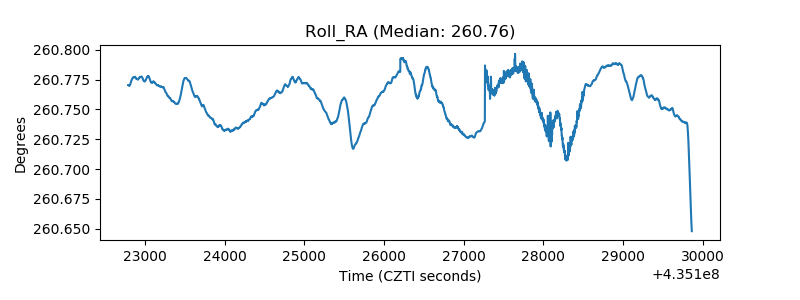 |
| Veto Counter | 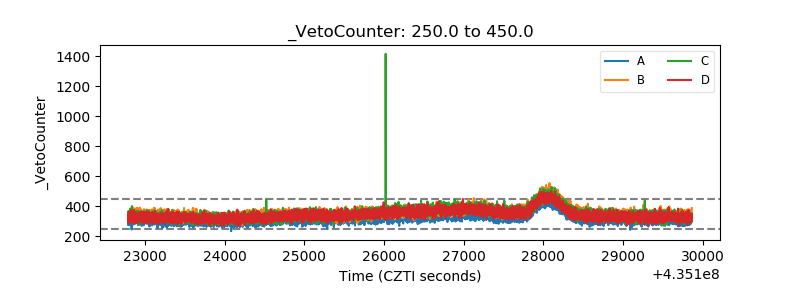 |