| Param | Original file | Final file |
|---|---|---|
| Filename | modeM0/AS1A12_018T01_9000005874_43527cztM0_level2.fits | modeM0/AS1A12_018T01_9000005874_43527cztM0_level2_quad_clean.evt |
| Size (bytes) | 288,100,800 | 16,899,840 |
| Size | 274.8 MB | 16.1 MB |
| Events in quadrant A | 3,065,303 | 134,664 |
| Events in quadrant B | 2,023,993 | 151,904 |
| Events in quadrant C | 3,861,743 | 96,612 |
| Events in quadrant D | 1,579,298 | 2,299 |
| Mode M0 | |||
|---|---|---|---|
| Quadrant | BADHDUFLAG | Total packets | Discarded packets |
| A | 0 | 10943 | 677 |
| B | 0 | 7716 | 519 |
| C | 0 | 13720 | 1096 |
| D | 0 | 6207 | 318 |
| Mode M9 | |||
|---|---|---|---|
| Quadrant | BADHDUFLAG | Total packets | Discarded packets |
| A | 0 | 1 | 1 |
| B | 0 | 1 | 1 |
| C | 1 | 1 | 1 |
| D | 1 | -1 | -1 |
| Mode SS | |||
|---|---|---|---|
| Quadrant | BADHDUFLAG | Total packets | Discarded packets |
| A | 0 | 37 | 1 |
| B | 0 | 37 | 1 |
| C | 0 | 39 | 5 |
| D | 0 | 37 | 2 |
| Quadrant | Total seconds | Saturated seconds | Saturation percentage |
|---|---|---|---|
| A | 1693 | 791 | 46.721796% |
| B | 1694 | 250 | 14.757969% |
| C | 1689 | 1390 | 82.297217% |
| D | 1708 | 1708 | 100.000000% |
Noise dominated data is calculated using 1-second bins in cleaned event files. If a bin has >2000 counts, and if more than 50% of those come from <1% of pixels, then it is considered to be noise-dominated and hence unusable.
| Quadrant | # 1 sec bins | Bins with >0 counts | Bins with >2000 counts | High rate bins dominated by noise | Noise dominated (total time) | Noise dominated (detector-on time) | Marked lightcurve |
|---|---|---|---|---|---|---|---|
| A | 1856 | 1713 | 636 | 636 | 34.27% | 37.13% | 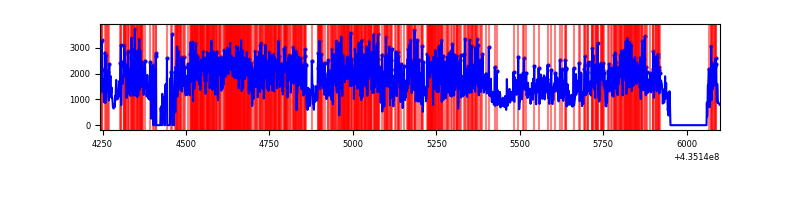 |
| B | 1856 | 1719 | 212 | 212 | 11.42% | 12.33% | 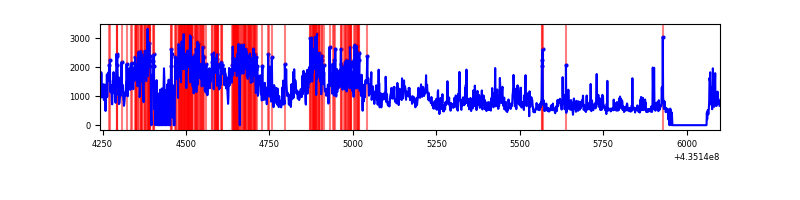 |
| C | 1855 | 1693 | 1247 | 1247 | 67.22% | 73.66% | 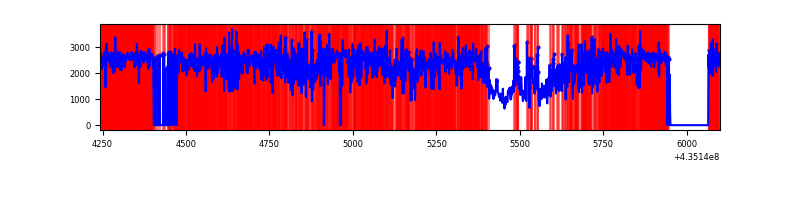 |
| D | 1856 | 1707 | 10 | 10 | 0.54% | 0.59% | 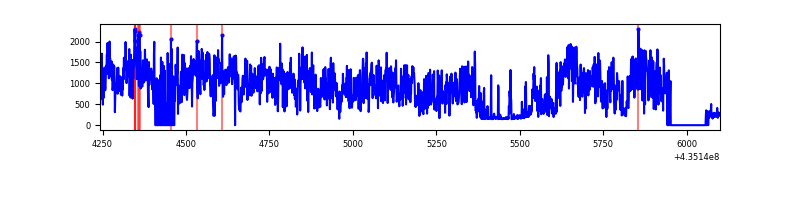 |
Top three noisy pixels from each quadrant. If the there are fewer than three noisy pixels in the level2.evt file, extra rows are filled as -1
| Pixel properties | Quadrant properties | ||||||
|---|---|---|---|---|---|---|---|
| Quadrant | DetID | PixID | Counts | Sigma | Mean | Median | Sigma |
| A | 0 | 228 | 1384527 | 39426.95 | 159 | 157 | 35.1 |
| A | 0 | 227 | 249918 | 7113.21 | 159 | 157 | 35.1 |
| A | 0 | 229 | 213339 | 6071.44 | 159 | 157 | 35.1 |
| B | 3 | 42 | 549530 | 14922.13 | 180 | 175 | 36.8 |
| B | 3 | 25 | 524951 | 14254.49 | 180 | 175 | 36.8 |
| B | 0 | 219 | 81828 | 2217.94 | 180 | 175 | 36.8 |
| C | 15 | 158 | 873005 | 29414.38 | 117 | 117 | 29.7 |
| C | 15 | 142 | 827928 | 27895.39 | 117 | 117 | 29.7 |
| C | 15 | 110 | 354091 | 11928.13 | 117 | 117 | 29.7 |
| D | 4 | 214 | 657693 | 257538.23 | 2 | 2 | 2.6 |
| D | 4 | 124 | 204748 | 80174.31 | 2 | 2 | 2.6 |
| D | 4 | 215 | 142734 | 55890.91 | 2 | 2 | 2.6 |
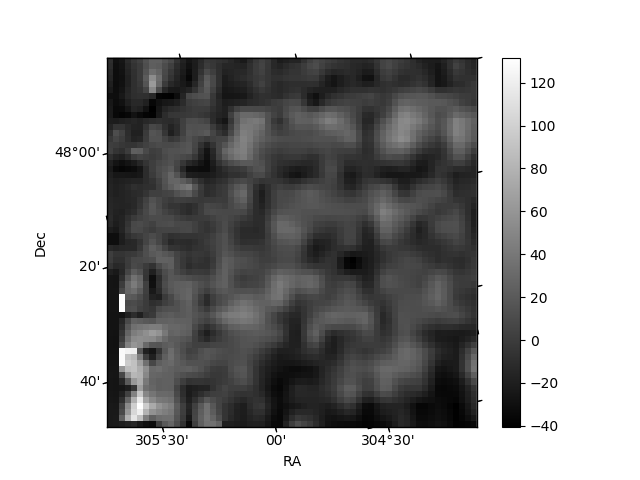
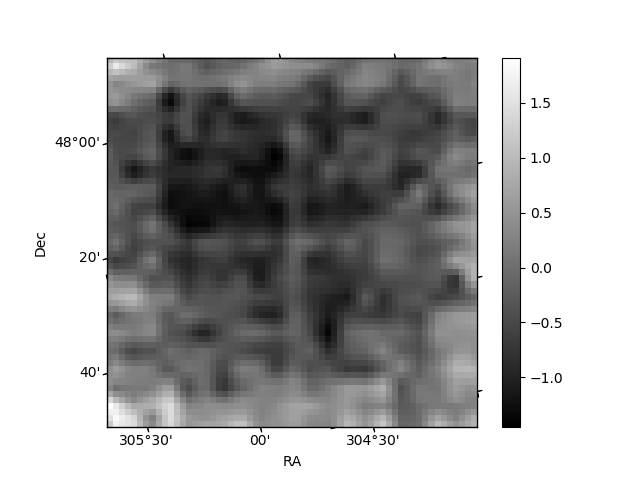
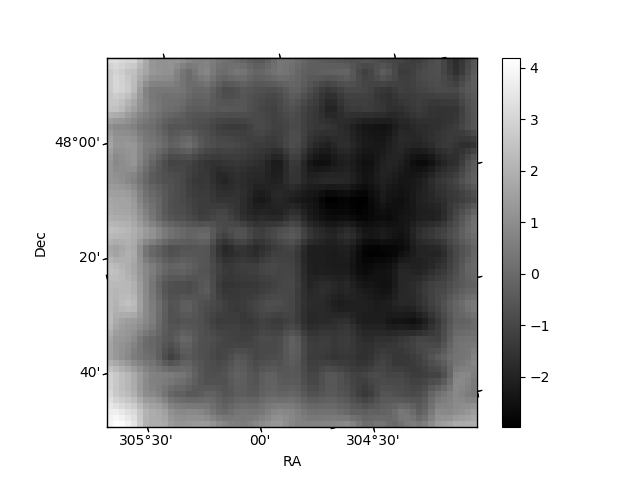
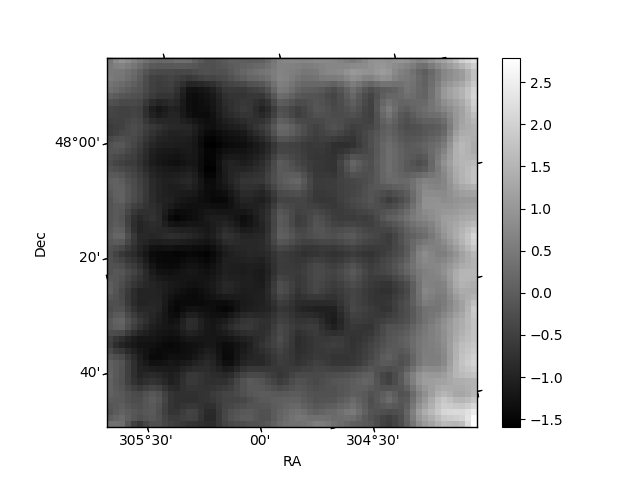
Histogram calculated using DETX and DETY for each event in the final _common_clean file
| Quadrant A | 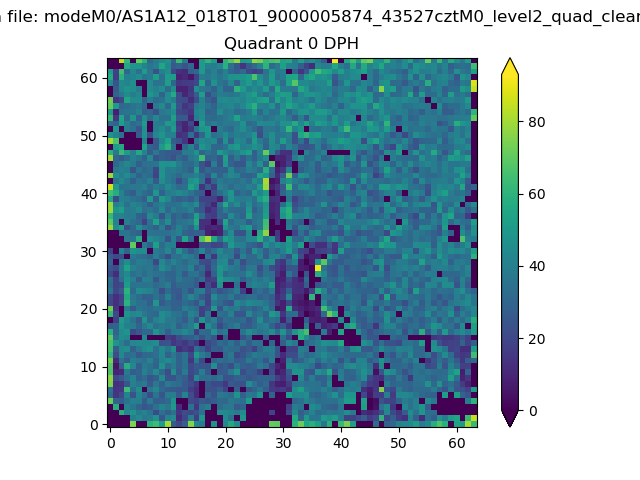 |
 |
Quadrant B |
|---|---|---|---|
| Quadrant D | 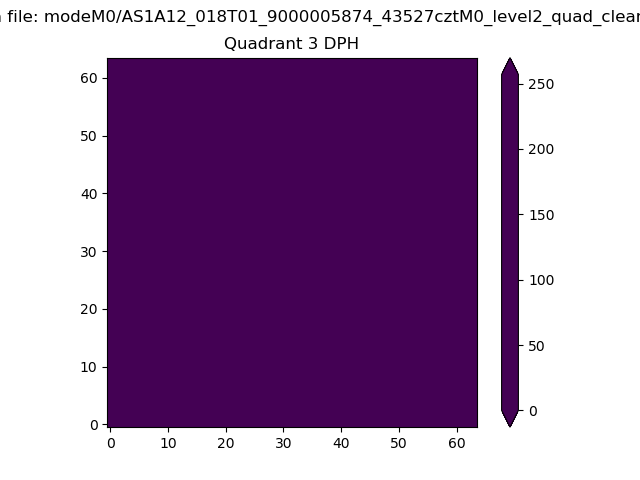 |
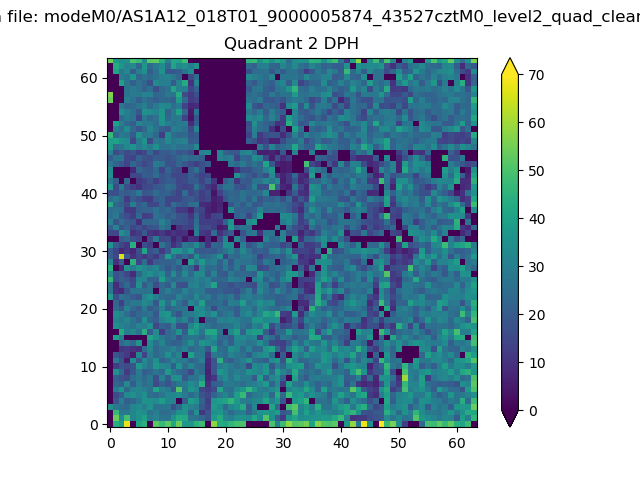 |
Quadrant C |
| Plot type | Count rate plots | Images |
|---|---|---|
| Comparison with Poisson distribution Blue bars denote a histogram of data divided into 1 sec bins. Red curve is a Poisson curve with rate = median count rate of data. |
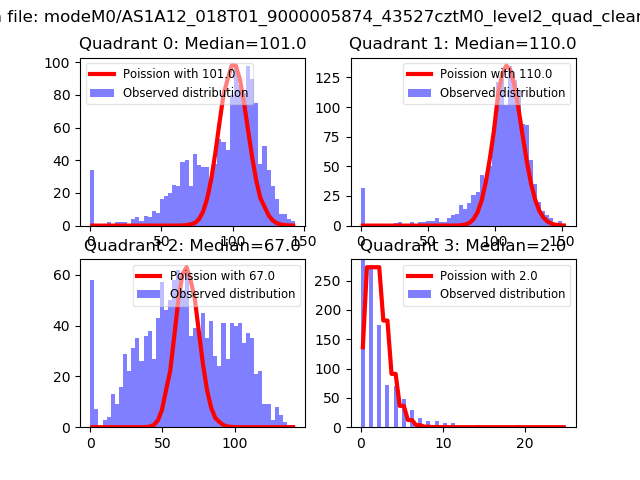 |
 |
| Quadrant-wise count rates Data is divided into 100 sec bins |
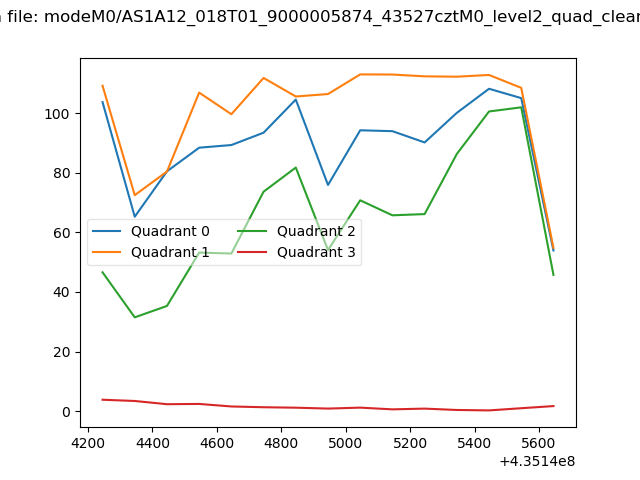 |
|
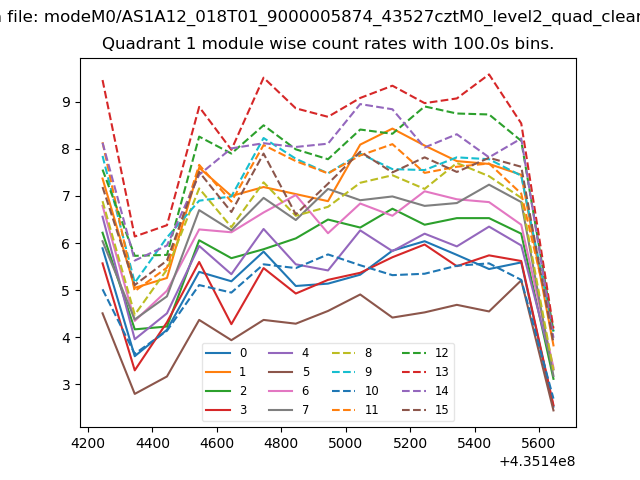
| Module-wise count rates for Quadrant A Data is divided into 100 sec bins |
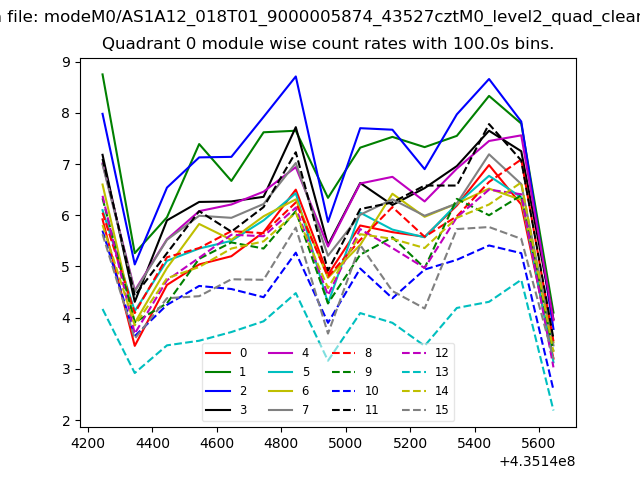 |
 |
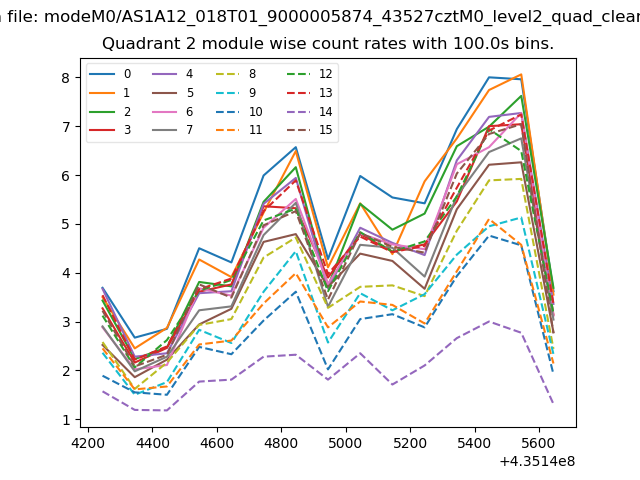
| Module-wise count rates for Quadrant B Data is divided into 100 sec bins |
 |
 |
| Module-wise count rates for Quadrant C Data is divided into 100 sec bins |
 |
 |
| Module-wise count rates for Quadrant D Data is divided into 100 sec bins |
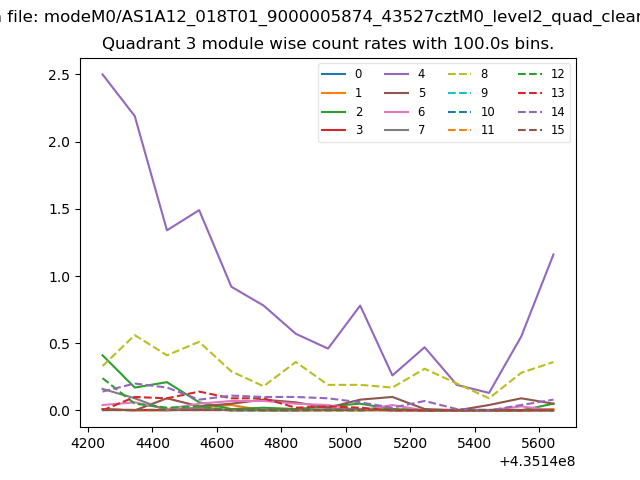 |
 |
| Parameter | Plot |
|---|---|
| CZT HV Monitor | 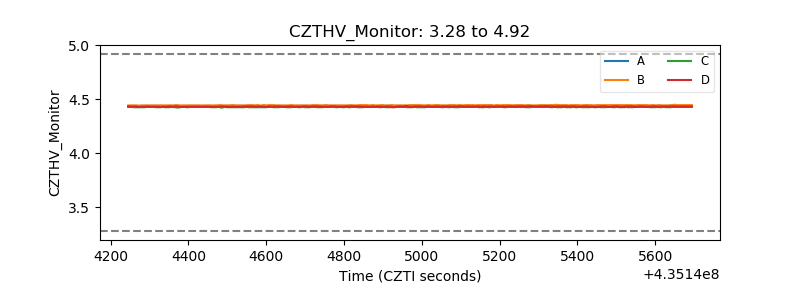 |
| D_VDD | 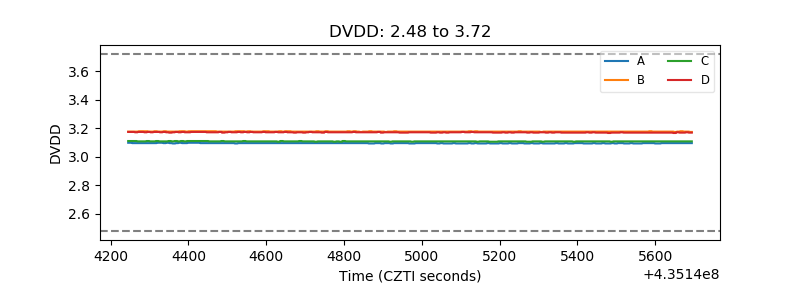 |
| Temperature 1 | 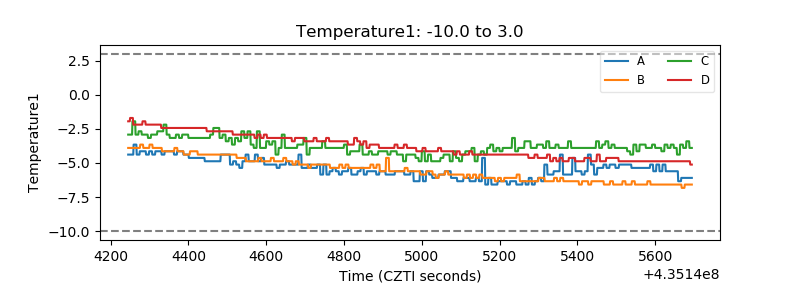 |
| Veto HV Monitor |  |
| Veto LLD | 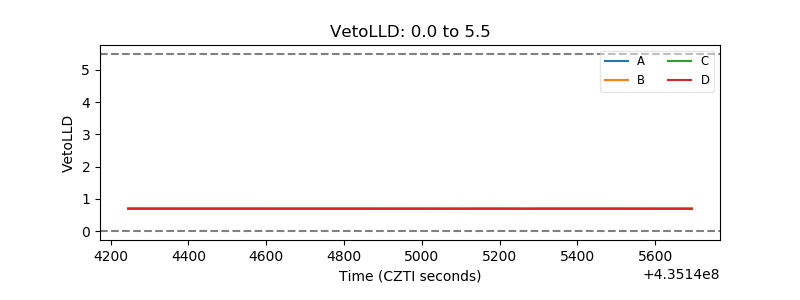 |
| Alpha Counter | 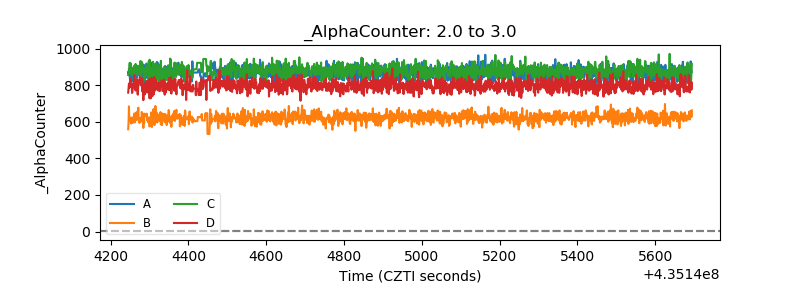 |
| _CPM_Rate | 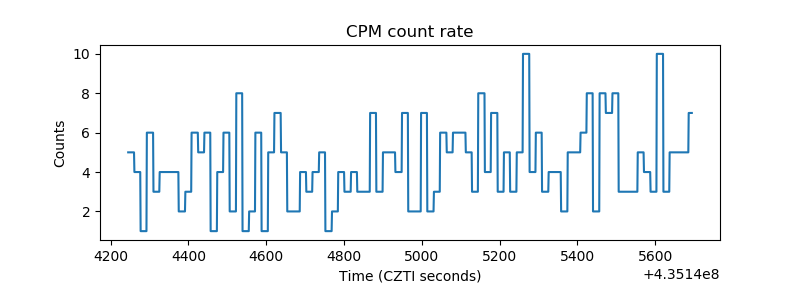 |
| CZT Counter | 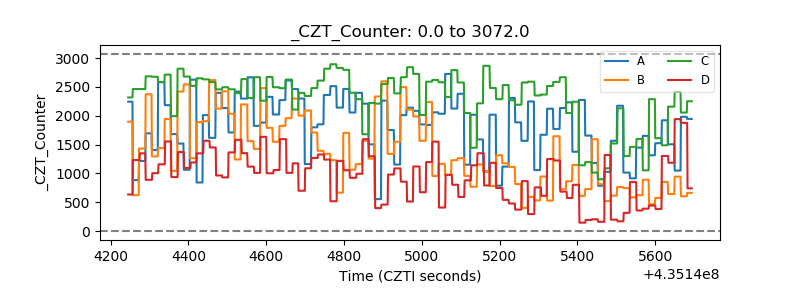 |
| +2.5 Volts monitor | 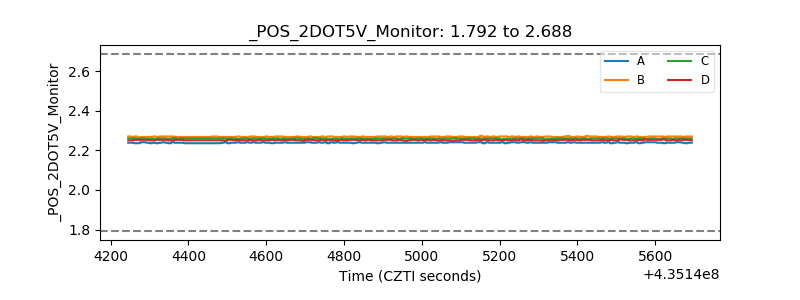 |
| +5 Volts monitor | 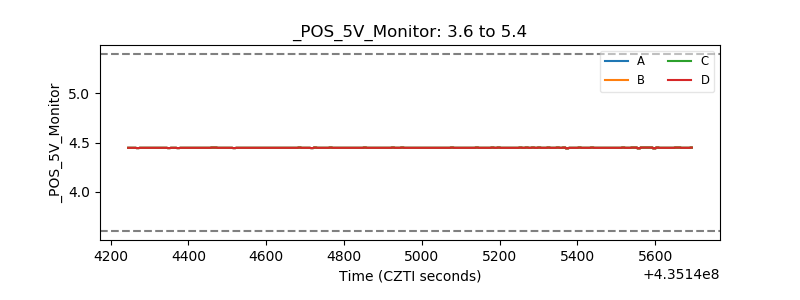 |
| _ROLL_ROT | 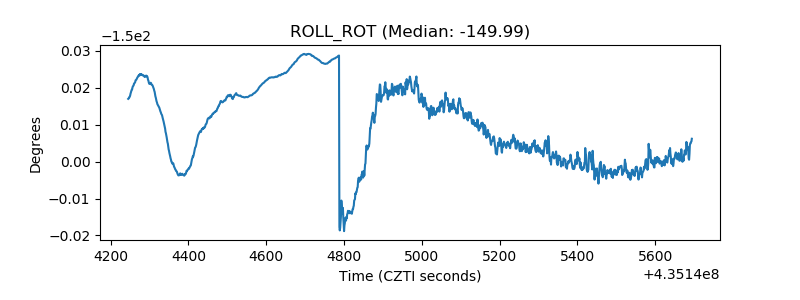 |
| _Roll_DEC | 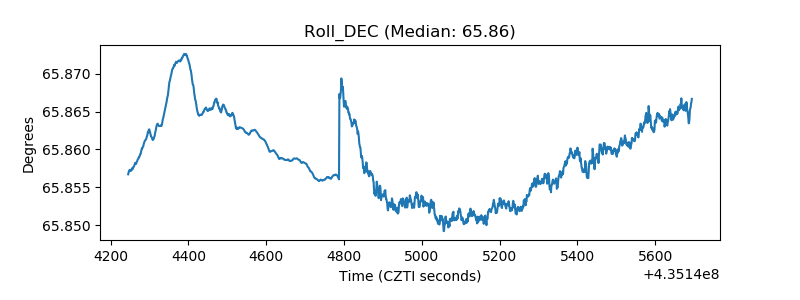 |
| _Roll_RA | 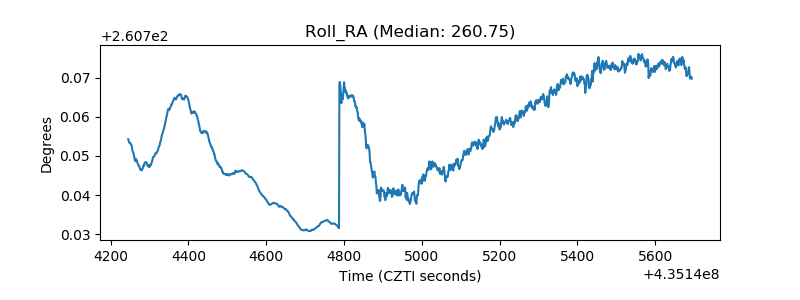 |
| Veto Counter | 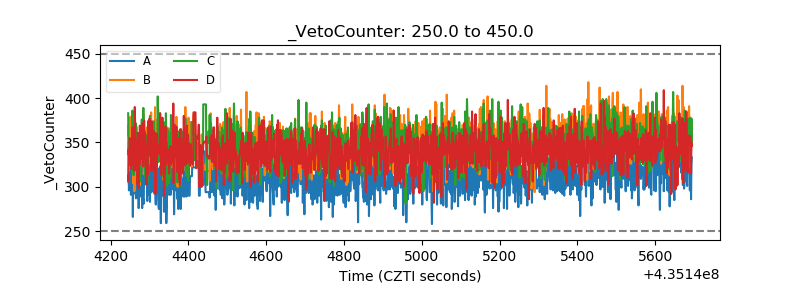 |