| Param | Original file | Final file |
|---|---|---|
| Filename | modeM0/AS1A12_102T01_9000005876_43529cztM0_level2.fits | modeM0/AS1A12_102T01_9000005876_43529cztM0_level2_quad_clean.evt |
| Size (bytes) | 1,195,223,040 | 67,965,120 |
| Size | 1.1 GB | 64.8 MB |
| Events in quadrant A | 10,582,477 | 628,337 |
| Events in quadrant B | 7,325,819 | 714,783 |
| Events in quadrant C | 15,921,534 | 259,981 |
| Events in quadrant D | 9,928,744 | 9,208 |
| Mode SS | |||
|---|---|---|---|
| Quadrant | BADHDUFLAG | Total packets | Discarded packets |
| A | 0 | 126 | 0 |
| B | 0 | 126 | 0 |
| C | 0 | 126 | 0 |
| D | 0 | 126 | 0 |
| Mode M9 | |||
|---|---|---|---|
| Quadrant | BADHDUFLAG | Total packets | Discarded packets |
| A | 0 | 11 | 0 |
| B | 0 | 11 | 0 |
| C | 0 | 11 | 0 |
| D | 0 | 11 | 0 |
| Mode M0 | |||
|---|---|---|---|
| Quadrant | BADHDUFLAG | Total packets | Discarded packets |
| A | 0 | 35857 | 1 |
| B | 0 | 26201 | 1 |
| C | 0 | 51386 | 1 |
| D | 0 | 33899 | 8 |
| Quadrant | Total seconds | Saturated seconds | Saturation percentage |
|---|---|---|---|
| A | 6283 | 2741 | 43.625657% |
| B | 6284 | 791 | 12.587524% |
| C | 6284 | 5641 | 89.767664% |
| D | 6283 | 6283 | 100.000000% |
Noise dominated data is calculated using 1-second bins in cleaned event files. If a bin has >2000 counts, and if more than 50% of those come from <1% of pixels, then it is considered to be noise-dominated and hence unusable.
| Quadrant | # 1 sec bins | Bins with >0 counts | Bins with >2000 counts | High rate bins dominated by noise | Noise dominated (total time) | Noise dominated (detector-on time) | Marked lightcurve |
|---|---|---|---|---|---|---|---|
| A | 7313 | 6283 | 2196 | 2196 | 30.03% | 34.95% | 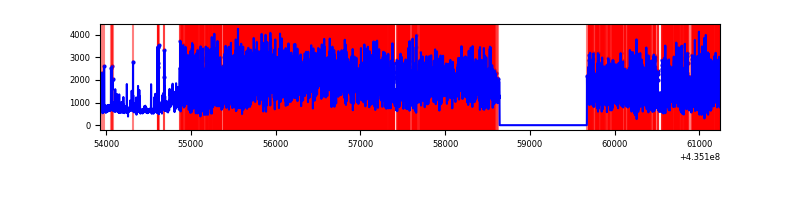 |
| B | 7314 | 6284 | 634 | 634 | 8.67% | 10.09% | 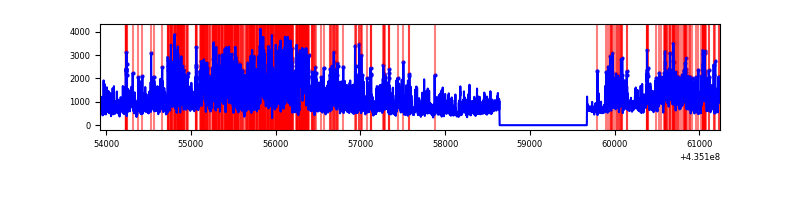 |
| C | 7313 | 6283 | 5355 | 5355 | 73.23% | 85.23% | 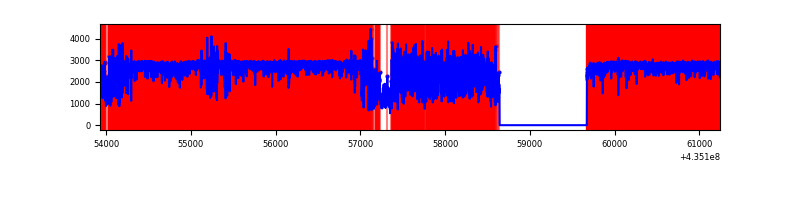 |
| D | 7312 | 6282 | 1915 | 1915 | 26.19% | 30.48% | 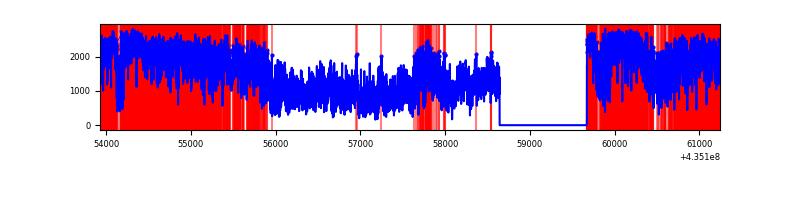 |
Top three noisy pixels from each quadrant. If the there are fewer than three noisy pixels in the level2.evt file, extra rows are filled as -1
| Pixel properties | Quadrant properties | ||||||
|---|---|---|---|---|---|---|---|
| Quadrant | DetID | PixID | Counts | Sigma | Mean | Median | Sigma |
| A | 15 | 222 | 4231507 | 32904.05 | 620 | 608 | 128.6 |
| A | 0 | 228 | 1497505 | 11641.49 | 620 | 608 | 128.6 |
| A | 0 | 227 | 698326 | 5426.21 | 620 | 608 | 128.6 |
| B | 3 | 42 | 2947686 | 22289.25 | 684 | 665 | 132.2 |
| B | 3 | 25 | 605225 | 4572.48 | 684 | 665 | 132.2 |
| B | 0 | 189 | 122641 | 922.54 | 684 | 665 | 132.2 |
| C | 15 | 126 | 7038320 | 109042.44 | 271 | 273 | 64.5 |
| C | 15 | 142 | 3007033 | 46584.58 | 271 | 273 | 64.5 |
| C | 15 | 174 | 2676991 | 41471.14 | 271 | 273 | 64.5 |
| D | 4 | 216 | 2776507 | 98778.41 | 34 | 31 | 28.1 |
| D | 4 | 212 | 1666145 | 59275.17 | 34 | 31 | 28.1 |
| D | 4 | 201 | 936889 | 33330.5 | 34 | 31 | 28.1 |
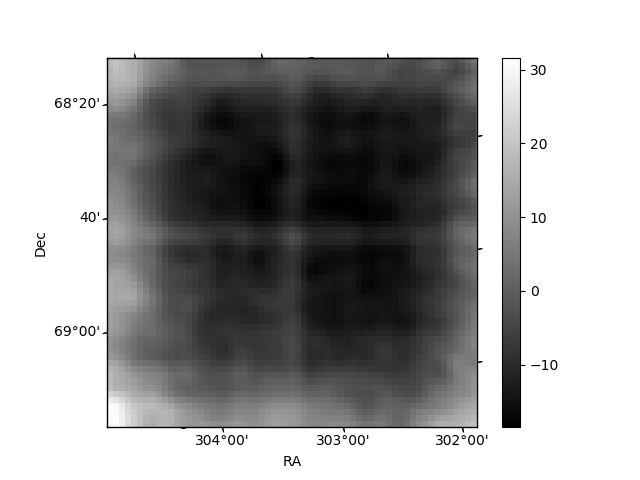
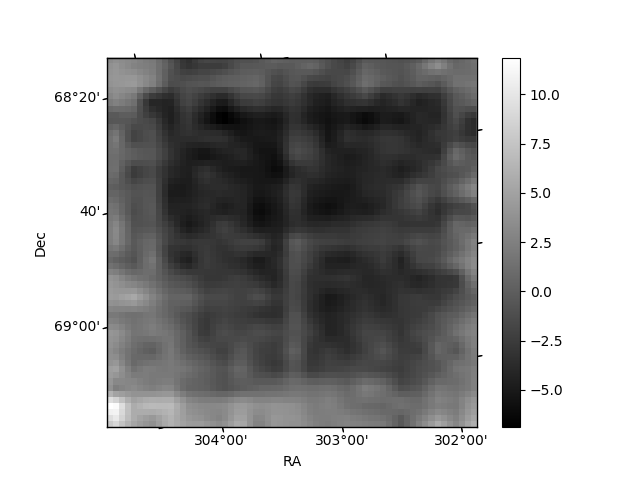
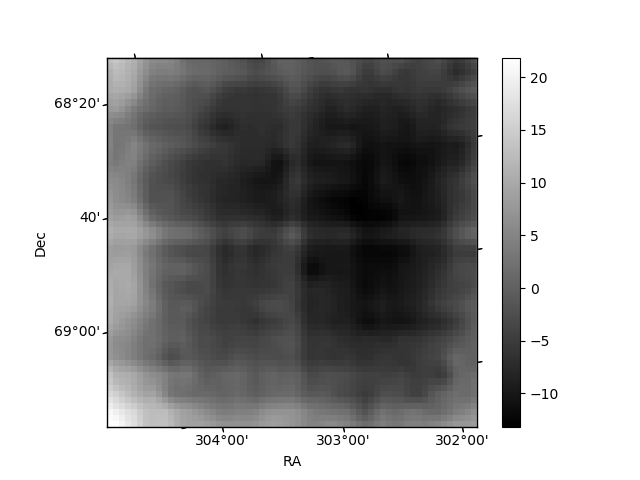
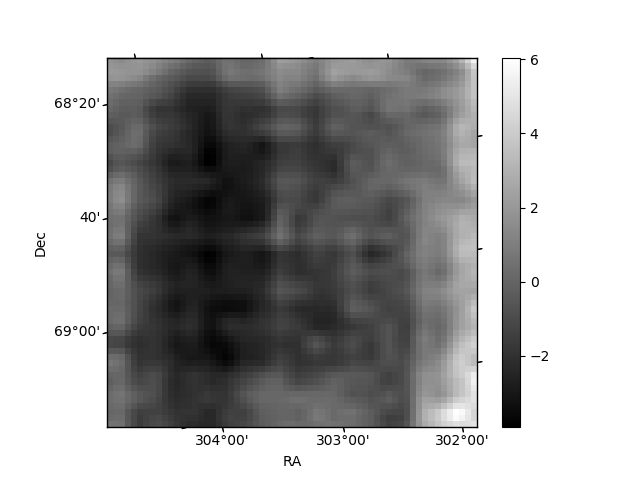
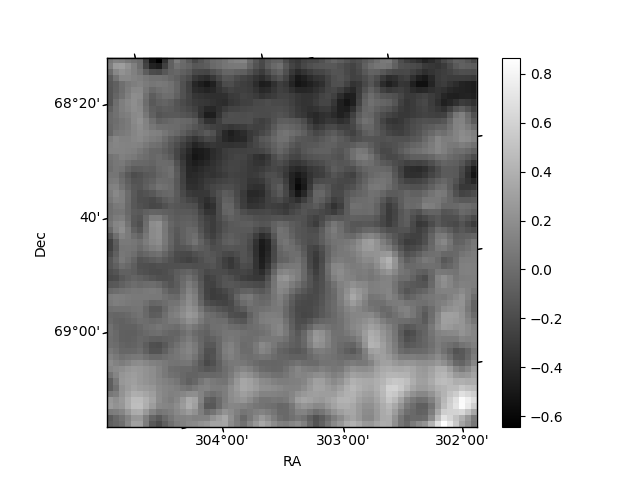
Histogram calculated using DETX and DETY for each event in the final _common_clean file
| Quadrant A | 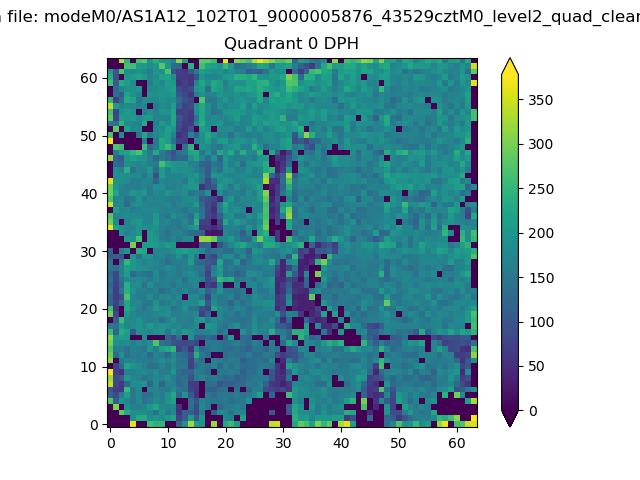 |
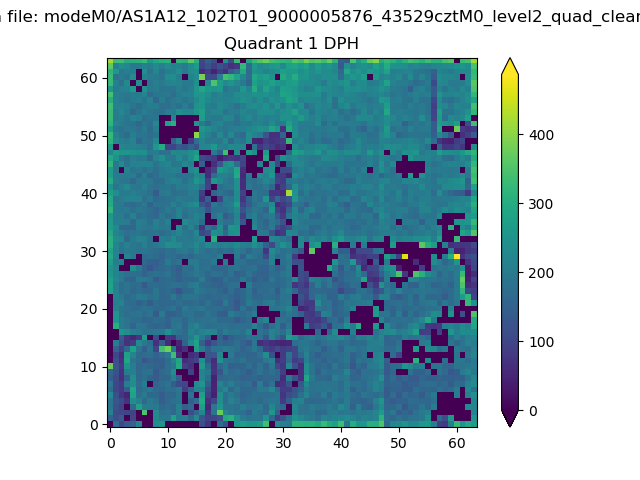 |
Quadrant B |
|---|---|---|---|
| Quadrant D | 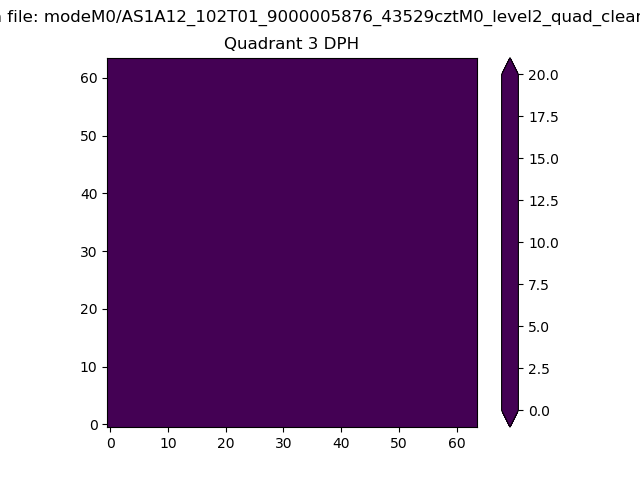 |
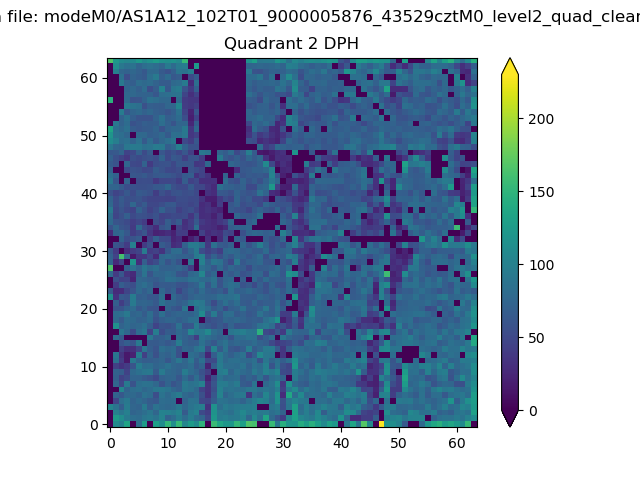 |
Quadrant C |
| Plot type | Count rate plots | Images |
|---|---|---|
| Comparison with Poisson distribution Blue bars denote a histogram of data divided into 1 sec bins. Red curve is a Poisson curve with rate = median count rate of data. |
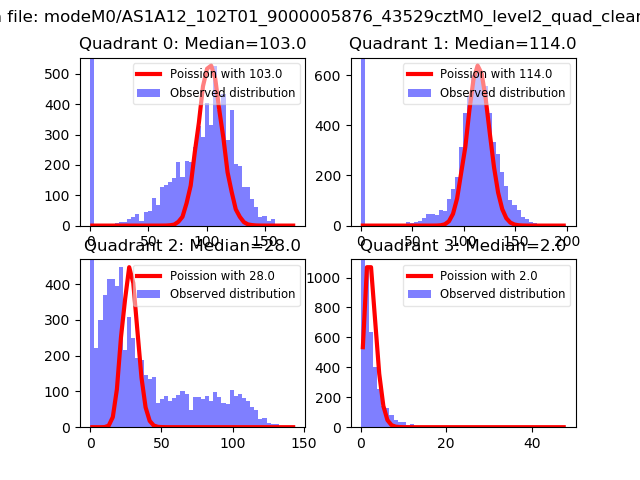 |
 |
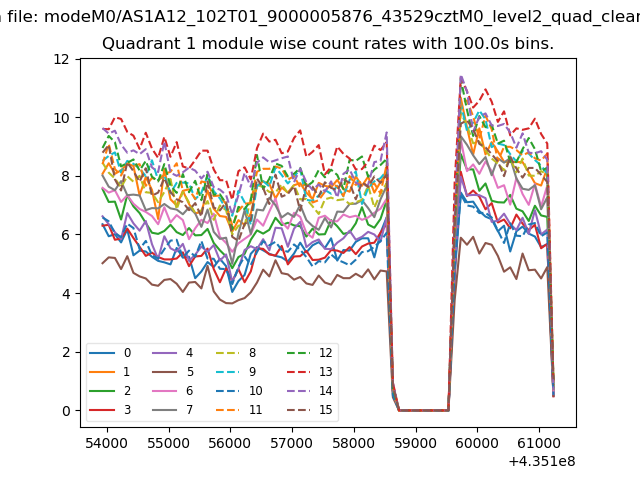
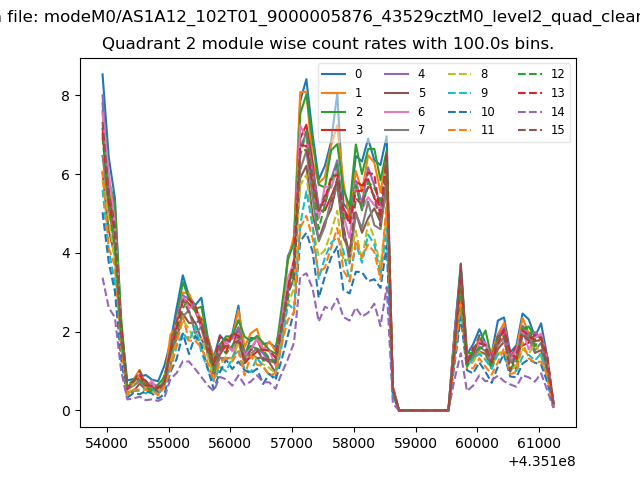
| Quadrant-wise count rates Data is divided into 100 sec bins |
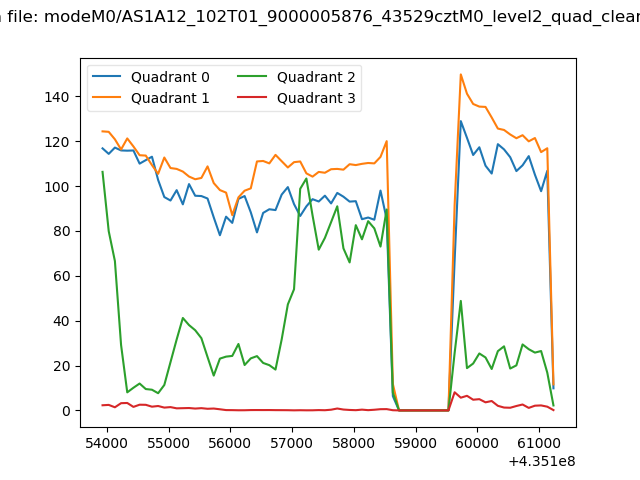 |
|
| Module-wise count rates for Quadrant A Data is divided into 100 sec bins |
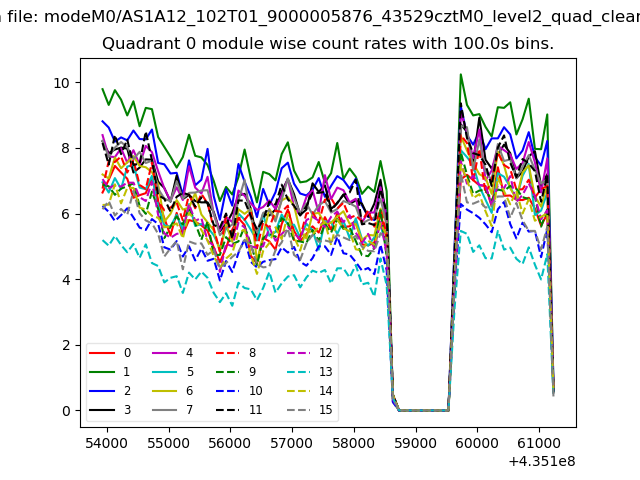 |
 |
| Module-wise count rates for Quadrant B Data is divided into 100 sec bins |
 |
 |
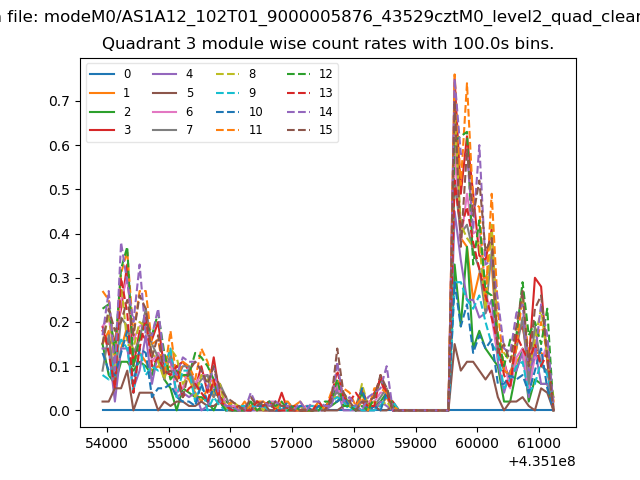
| Module-wise count rates for Quadrant C Data is divided into 100 sec bins |
 |
 |
| Module-wise count rates for Quadrant D Data is divided into 100 sec bins |
 |
 |
| Parameter | Plot |
|---|---|
| CZT HV Monitor | 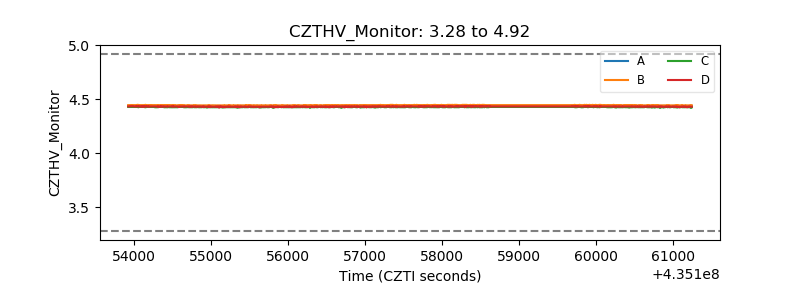 |
| D_VDD | 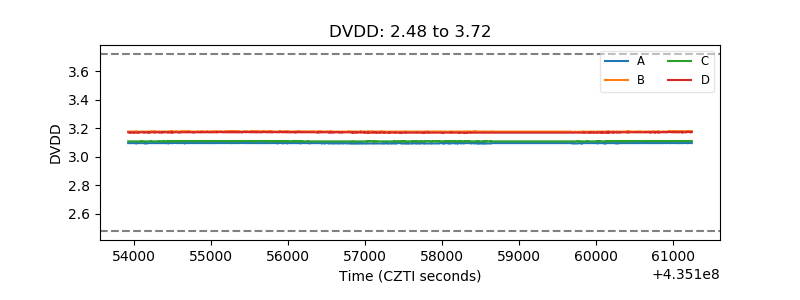 |
| Temperature 1 | 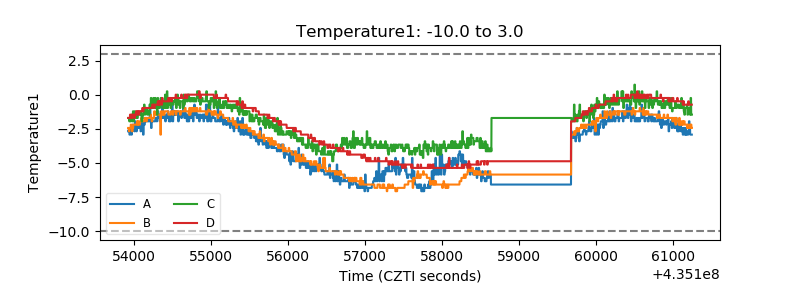 |
| Veto HV Monitor | 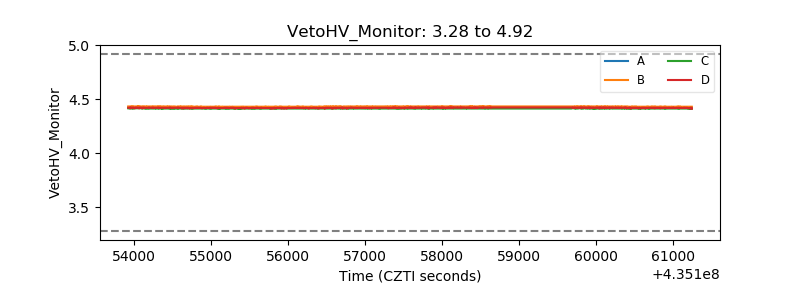 |
| Veto LLD | 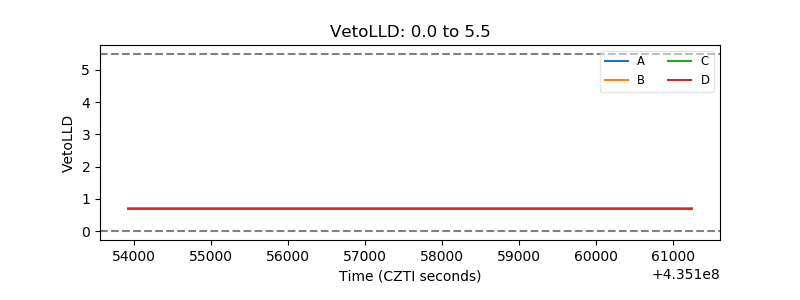 |
| Alpha Counter | 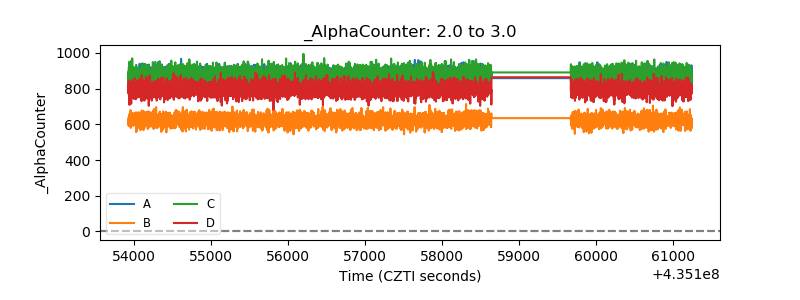 |
| _CPM_Rate | 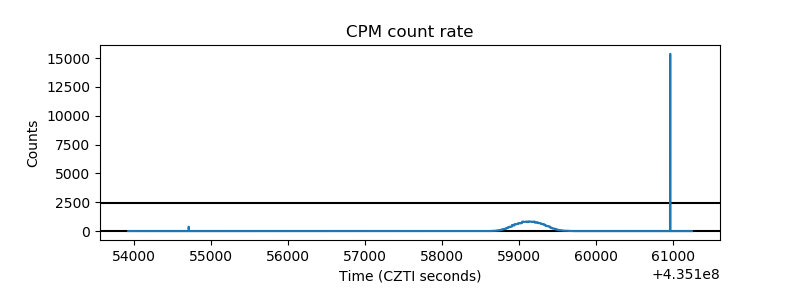 |
| CZT Counter | 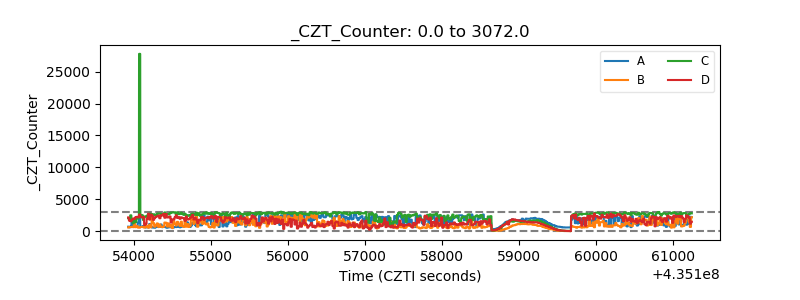 |
| +2.5 Volts monitor | 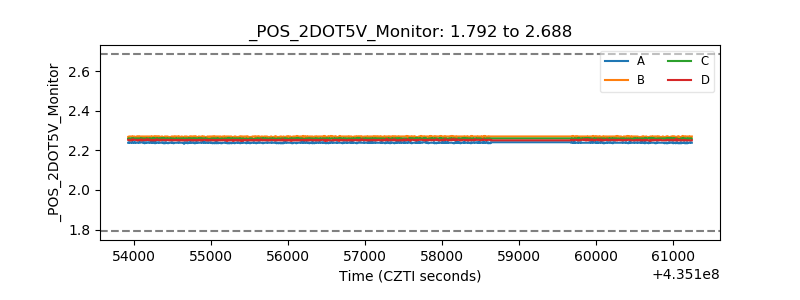 |
| +5 Volts monitor | 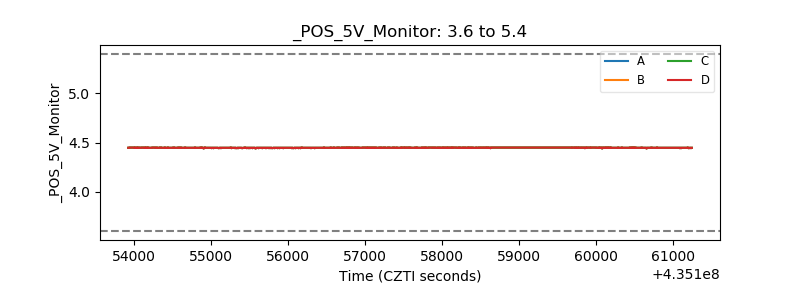 |
| _ROLL_ROT | 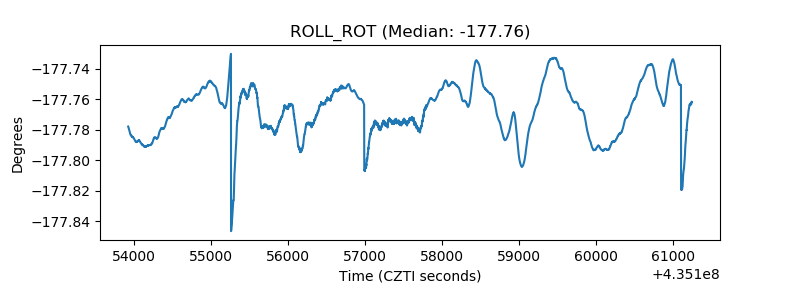 |
| _Roll_DEC | 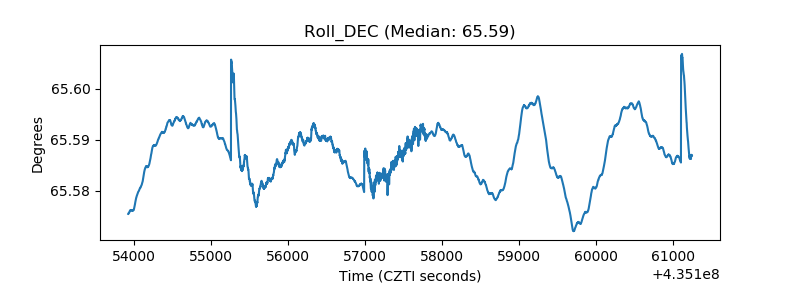 |
| _Roll_RA | 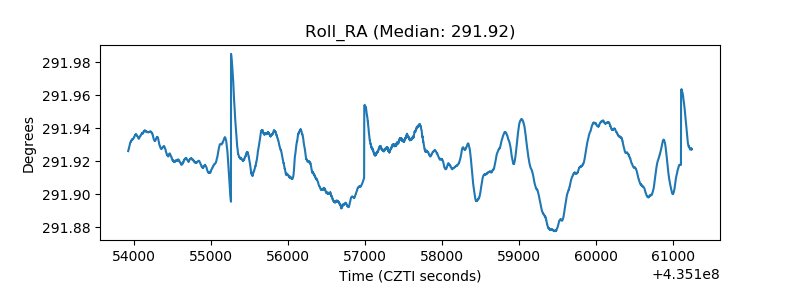 |
| Veto Counter | 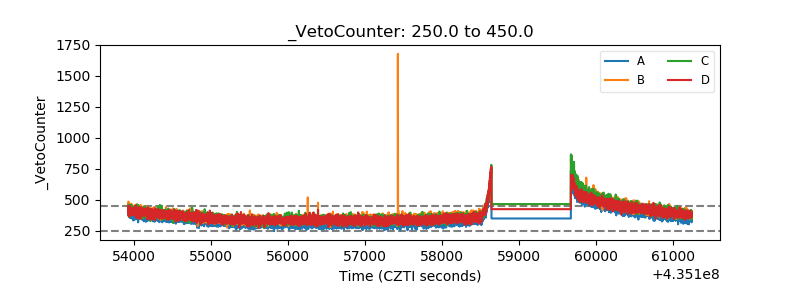 |