| Param | Original file | Final file |
|---|---|---|
| Filename | modeM0/AS1A12_102T01_9000005876_43530cztM0_level2.fits | modeM0/AS1A12_102T01_9000005876_43530cztM0_level2_quad_clean.evt |
| Size (bytes) | 1,233,040,320 | 60,958,080 |
| Size | 1.1 GB | 58.1 MB |
| Events in quadrant A | 10,425,943 | 595,358 |
| Events in quadrant B | 8,470,635 | 669,412 |
| Events in quadrant C | 15,754,182 | 151,325 |
| Events in quadrant D | 10,538,878 | 10,235 |
| Mode SS | |||
|---|---|---|---|
| Quadrant | BADHDUFLAG | Total packets | Discarded packets |
| A | 0 | 120 | 0 |
| B | 0 | 120 | 0 |
| C | 0 | 120 | 0 |
| D | 0 | 120 | 0 |
| Mode M9 | |||
|---|---|---|---|
| Quadrant | BADHDUFLAG | Total packets | Discarded packets |
| A | 0 | 11 | 0 |
| B | 0 | 11 | 0 |
| C | 0 | 11 | 0 |
| D | 0 | 11 | 0 |
| Mode M0 | |||
|---|---|---|---|
| Quadrant | BADHDUFLAG | Total packets | Discarded packets |
| A | 0 | 35091 | 1 |
| B | 0 | 29304 | 1 |
| C | 0 | 50672 | 1 |
| D | 0 | 35433 | 2 |
| Quadrant | Total seconds | Saturated seconds | Saturation percentage |
|---|---|---|---|
| A | 5893 | 2694 | 45.715255% |
| B | 5893 | 1525 | 25.878161% |
| C | 5893 | 5844 | 99.168505% |
| D | 5892 | 5892 | 100.000000% |
Noise dominated data is calculated using 1-second bins in cleaned event files. If a bin has >2000 counts, and if more than 50% of those come from <1% of pixels, then it is considered to be noise-dominated and hence unusable.
| Quadrant | # 1 sec bins | Bins with >0 counts | Bins with >2000 counts | High rate bins dominated by noise | Noise dominated (total time) | Noise dominated (detector-on time) | Marked lightcurve |
|---|---|---|---|---|---|---|---|
| A | 7013 | 5893 | 2167 | 2167 | 30.90% | 36.77% | 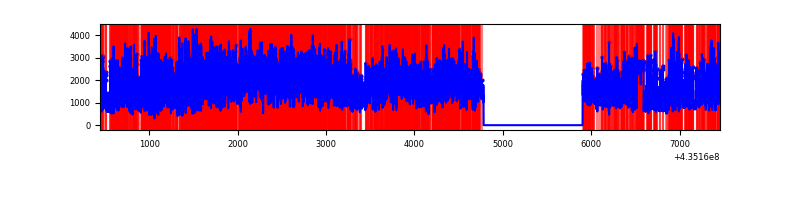 |
| B | 7013 | 5894 | 1201 | 1201 | 17.13% | 20.38% | 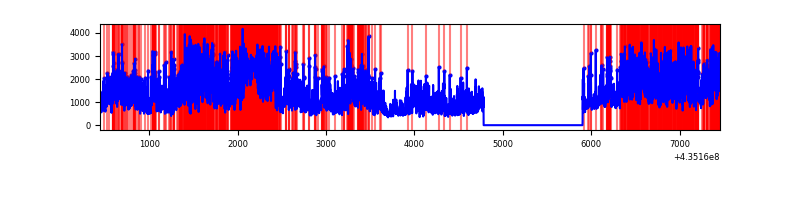 |
| C | 7012 | 5892 | 5710 | 5710 | 81.43% | 96.91% | 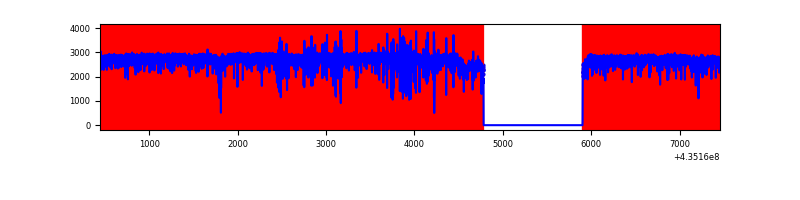 |
| D | 7011 | 5891 | 2077 | 2077 | 29.62% | 35.26% | 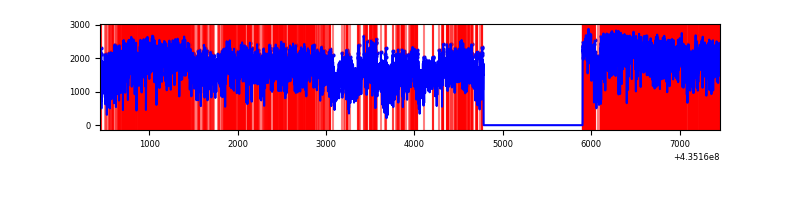 |
Top three noisy pixels from each quadrant. If the there are fewer than three noisy pixels in the level2.evt file, extra rows are filled as -1
| Pixel properties | Quadrant properties | ||||||
|---|---|---|---|---|---|---|---|
| Quadrant | DetID | PixID | Counts | Sigma | Mean | Median | Sigma |
| A | 15 | 222 | 4419411 | 37391.92 | 576 | 566 | 118.2 |
| A | 0 | 228 | 1291535 | 10924.08 | 576 | 566 | 118.2 |
| A | 0 | 227 | 747180 | 6317.79 | 576 | 566 | 118.2 |
| B | 3 | 42 | 3703799 | 31178.34 | 627 | 609 | 118.8 |
| B | 3 | 25 | 1390318 | 11700.4 | 627 | 609 | 118.8 |
| B | 0 | 219 | 238623 | 2003.92 | 627 | 609 | 118.8 |
| C | 15 | 126 | 7208179 | 186053.76 | 157 | 158 | 38.7 |
| C | 15 | 142 | 3016577 | 77859.94 | 157 | 158 | 38.7 |
| C | 15 | 174 | 2705604 | 69833.09 | 157 | 158 | 38.7 |
| D | 4 | 216 | 3488840 | 134808.54 | 35 | 32 | 25.9 |
| D | 4 | 201 | 1229681 | 47513.99 | 35 | 32 | 25.9 |
| D | 4 | 212 | 1171981 | 45284.44 | 35 | 32 | 25.9 |
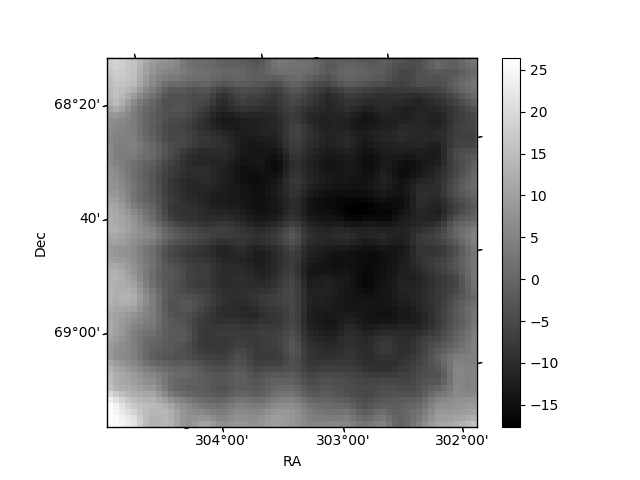
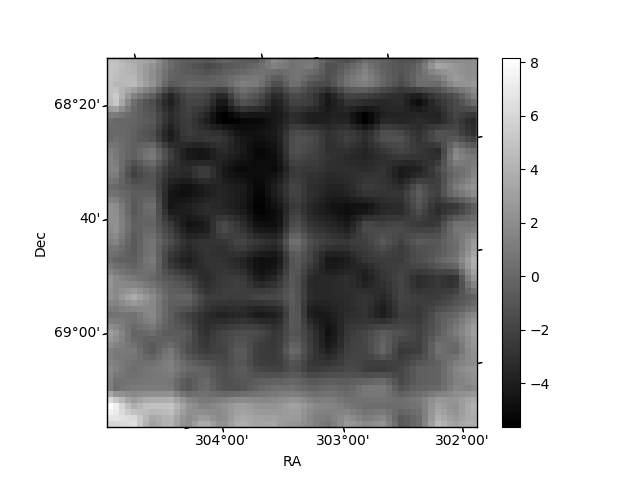
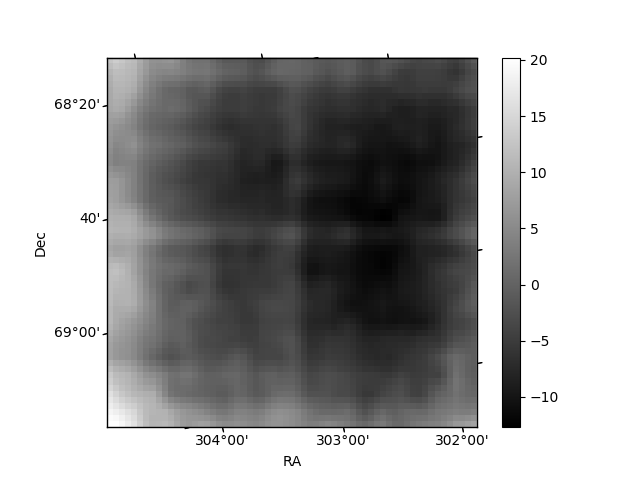
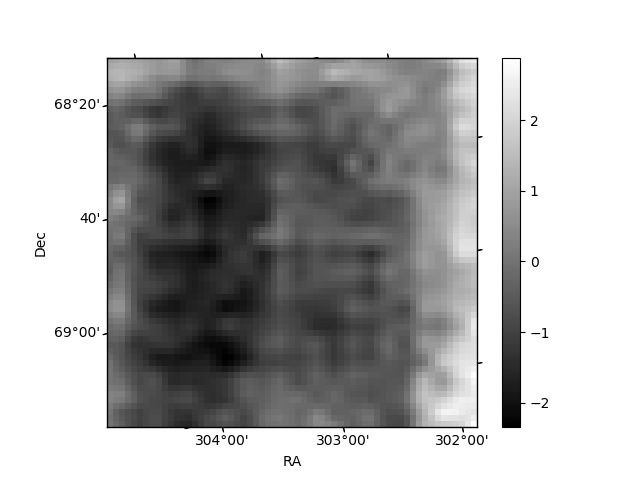
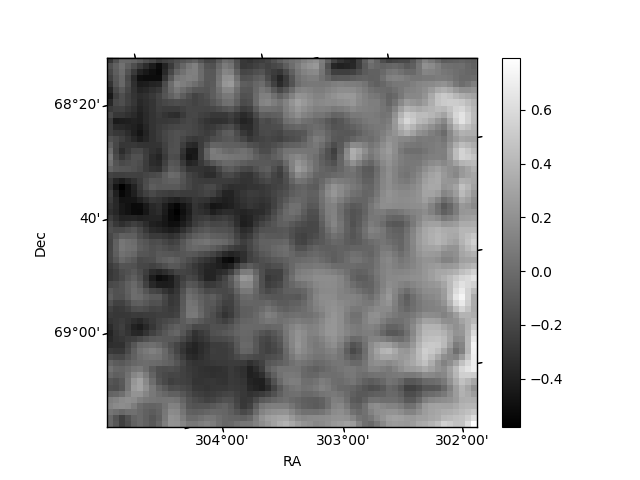
Histogram calculated using DETX and DETY for each event in the final _common_clean file
| Quadrant A | 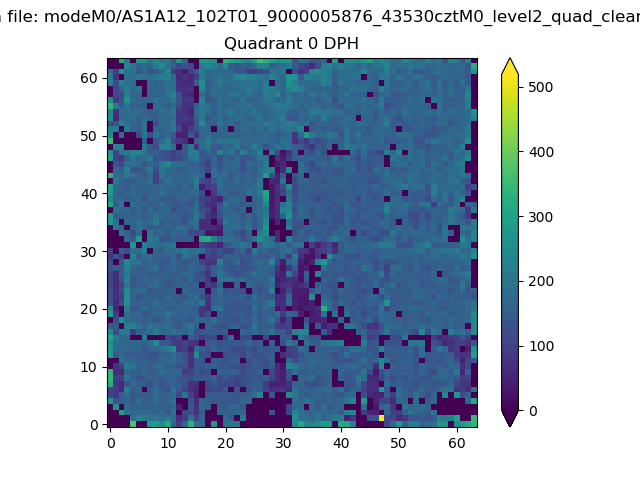 |
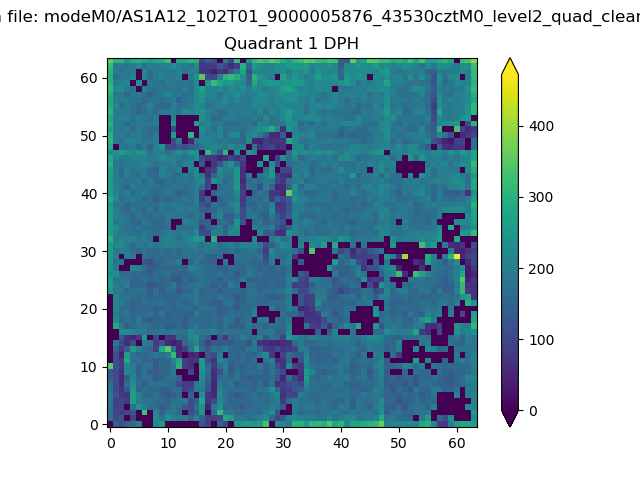 |
Quadrant B |
|---|---|---|---|
| Quadrant D | 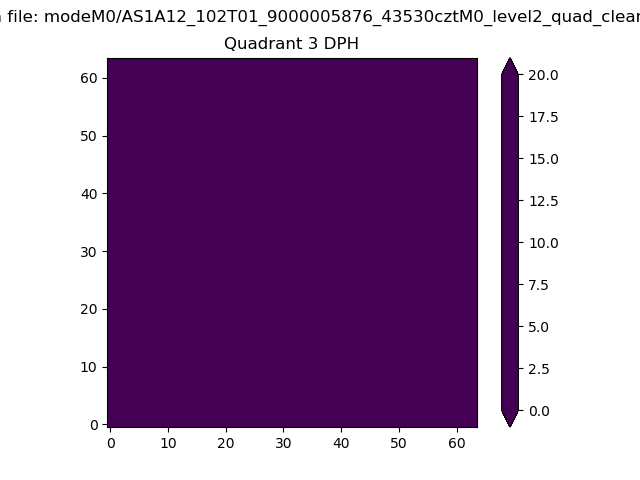 |
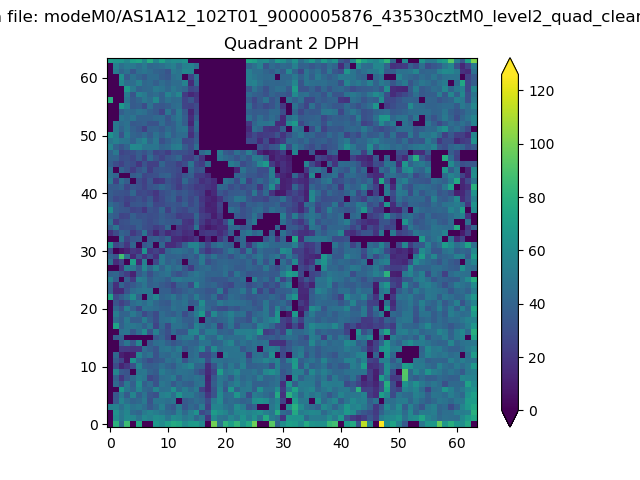 |
Quadrant C |
| Plot type | Count rate plots | Images |
|---|---|---|
| Comparison with Poisson distribution Blue bars denote a histogram of data divided into 1 sec bins. Red curve is a Poisson curve with rate = median count rate of data. |
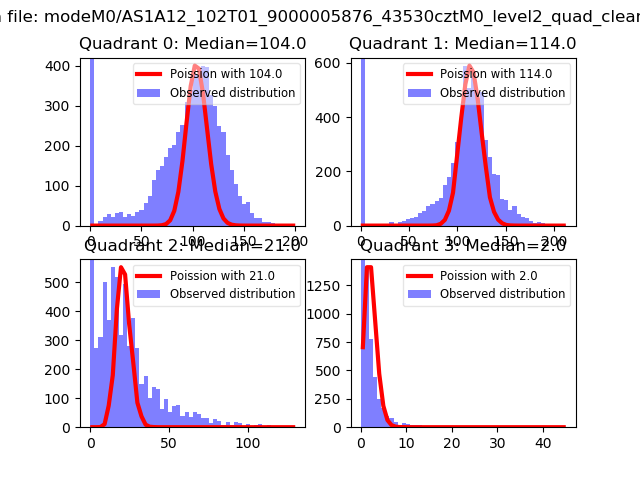 |
 |
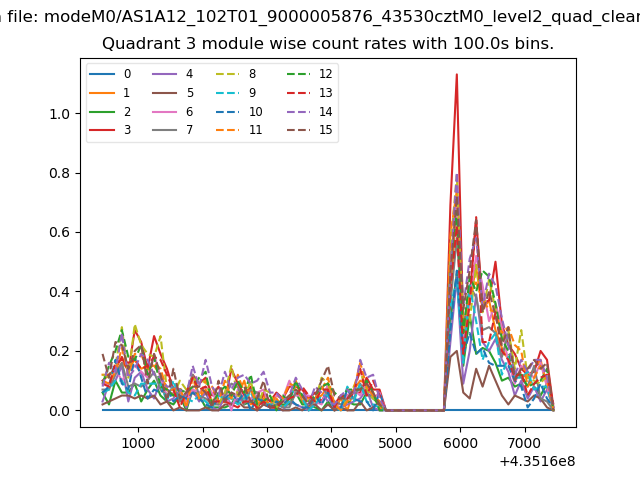
| Quadrant-wise count rates Data is divided into 100 sec bins |
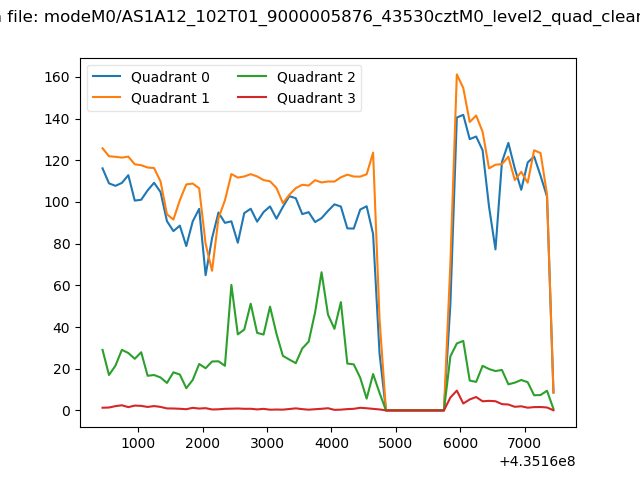 |
|
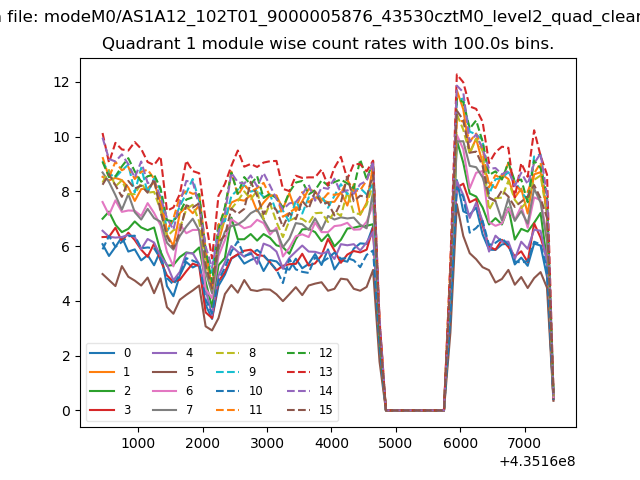
| Module-wise count rates for Quadrant A Data is divided into 100 sec bins |
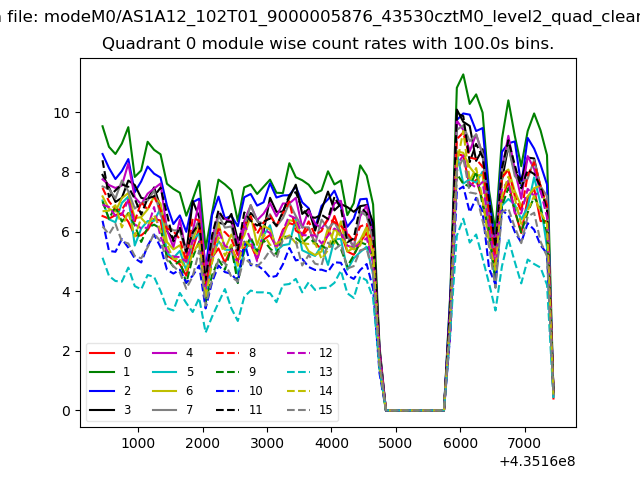 |
 |
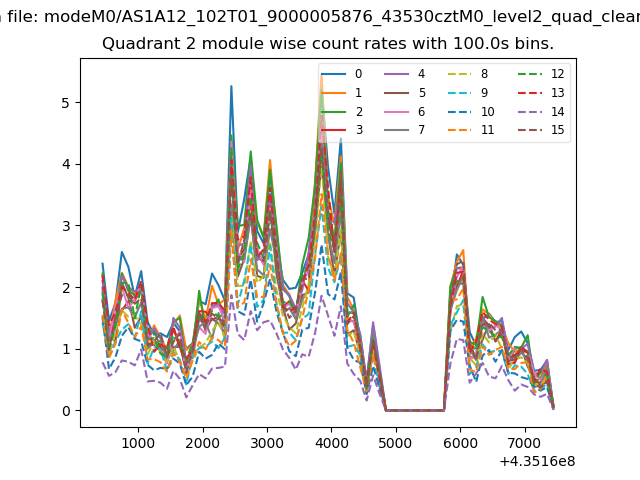
| Module-wise count rates for Quadrant B Data is divided into 100 sec bins |
 |
 |
| Module-wise count rates for Quadrant C Data is divided into 100 sec bins |
 |
 |
| Module-wise count rates for Quadrant D Data is divided into 100 sec bins |
 |
 |
| Parameter | Plot |
|---|---|
| CZT HV Monitor | 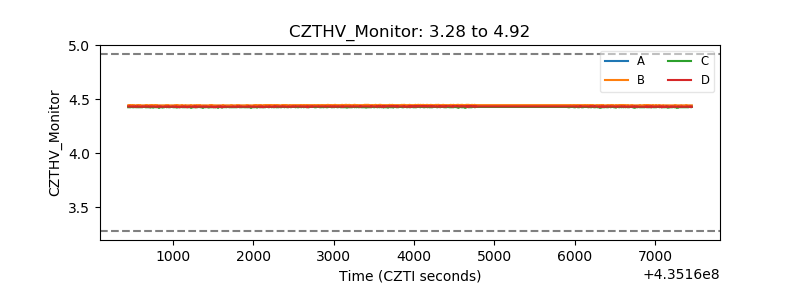 |
| D_VDD | 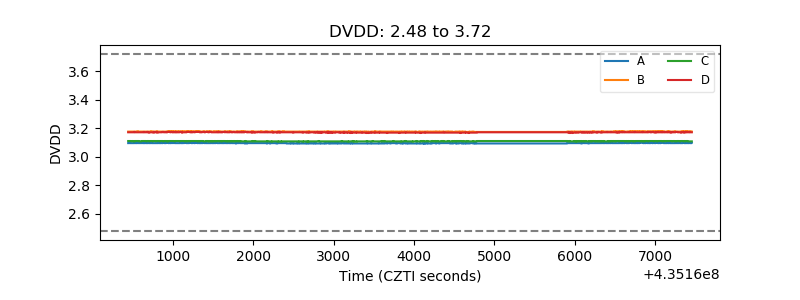 |
| Temperature 1 | 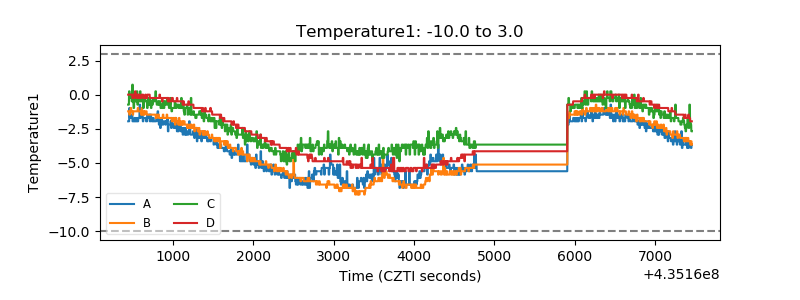 |
| Veto HV Monitor |  |
| Veto LLD | 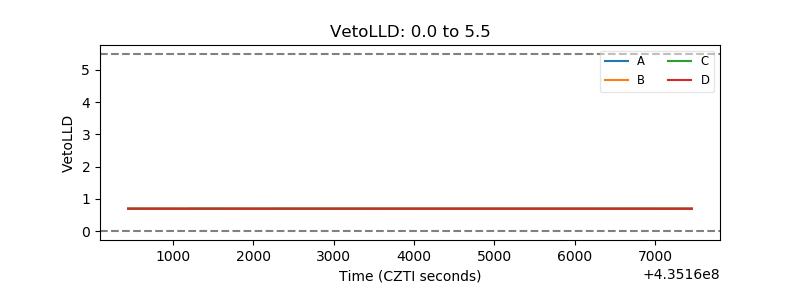 |
| Alpha Counter | 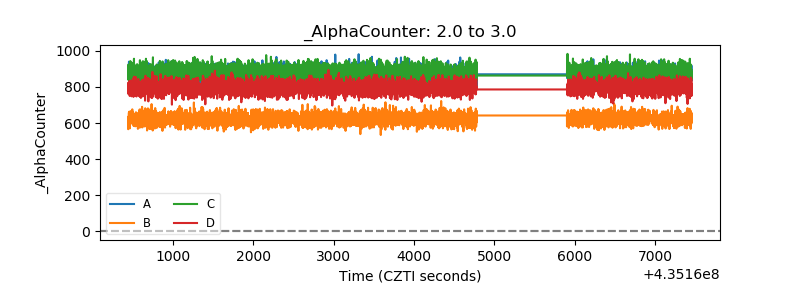 |
| _CPM_Rate | 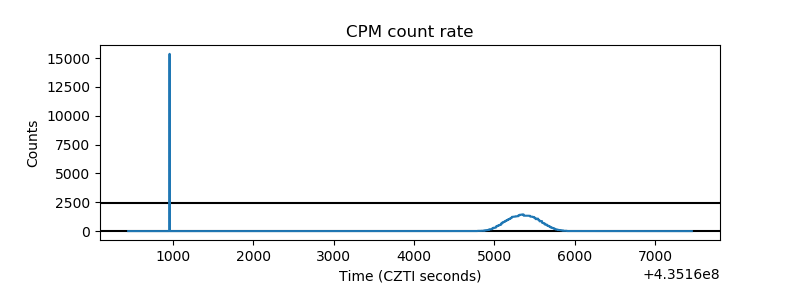 |
| CZT Counter | 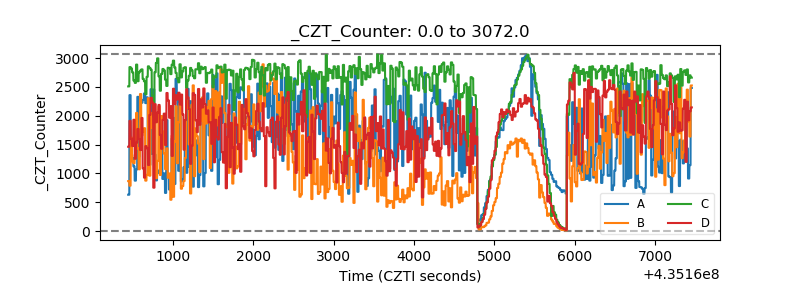 |
| +2.5 Volts monitor | 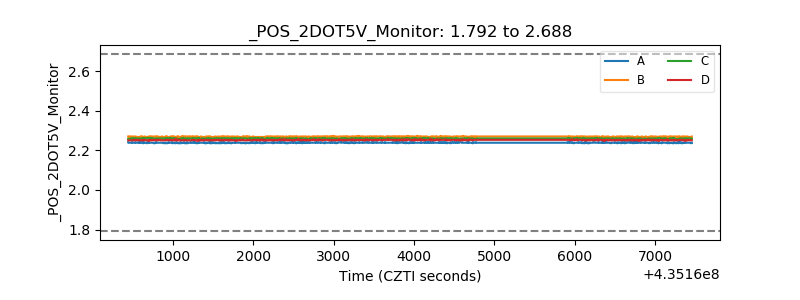 |
| +5 Volts monitor | 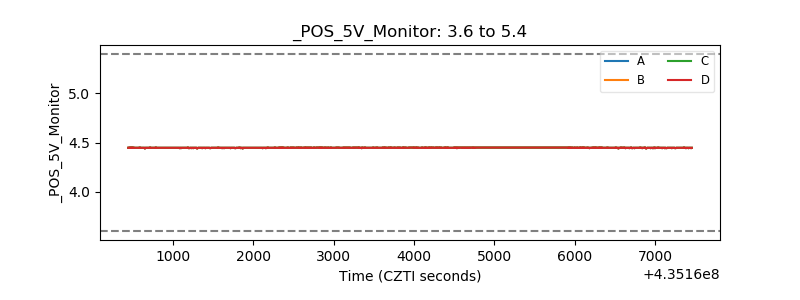 |
| _ROLL_ROT | 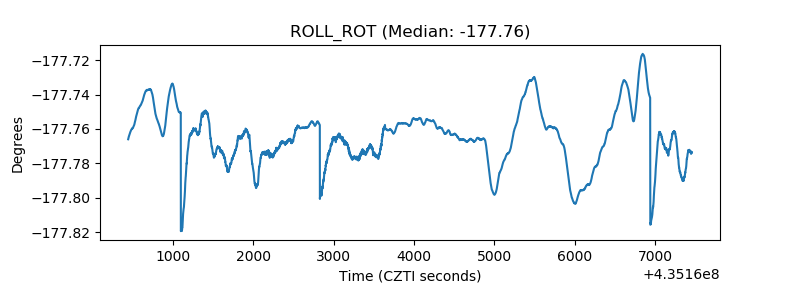 |
| _Roll_DEC | 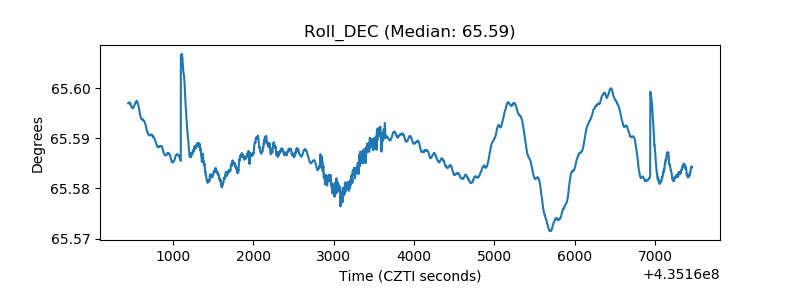 |
| _Roll_RA | 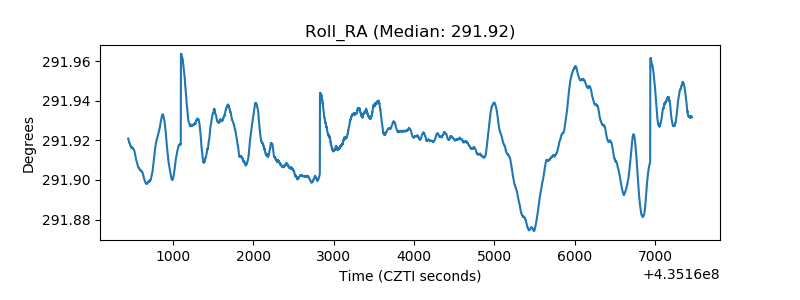 |
| Veto Counter | 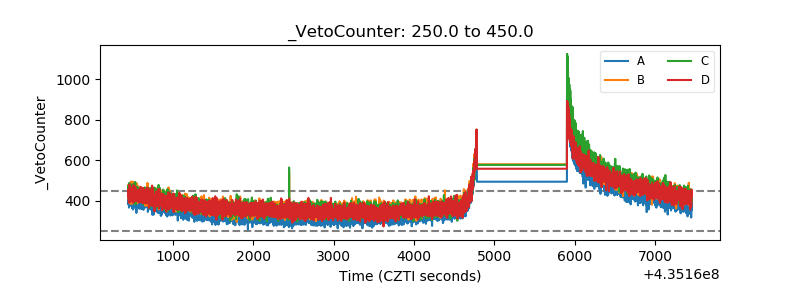 |