| Param | Original file | Final file |
|---|---|---|
| Filename | modeM0/AS1A12_102T01_9000005876_43533cztM0_level2.fits | modeM0/AS1A12_102T01_9000005876_43533cztM0_level2_quad_clean.evt |
| Size (bytes) | 1,109,206,080 | 69,998,400 |
| Size | 1.0 GB | 66.8 MB |
| Events in quadrant A | 7,907,358 | 626,522 |
| Events in quadrant B | 7,170,776 | 664,258 |
| Events in quadrant C | 13,536,584 | 396,722 |
| Events in quadrant D | 11,998,790 | 21,983 |
| Mode SS | |||
|---|---|---|---|
| Quadrant | BADHDUFLAG | Total packets | Discarded packets |
| A | 0 | 116 | 0 |
| B | 0 | 116 | 0 |
| C | 0 | 116 | 0 |
| D | 0 | 116 | 0 |
| Mode M9 | |||
|---|---|---|---|
| Quadrant | BADHDUFLAG | Total packets | Discarded packets |
| A | 0 | 12 | 0 |
| B | 0 | 12 | 0 |
| C | 0 | 12 | 0 |
| D | 0 | 12 | 0 |
| Mode M0 | |||
|---|---|---|---|
| Quadrant | BADHDUFLAG | Total packets | Discarded packets |
| A | 0 | 27567 | 1 |
| B | 0 | 25373 | 1 |
| C | 0 | 44115 | 9 |
| D | 0 | 39594 | 1 |
| Quadrant | Total seconds | Saturated seconds | Saturation percentage |
|---|---|---|---|
| A | 5784 | 1243 | 21.490318% |
| B | 5785 | 1256 | 21.711322% |
| C | 5784 | 4769 | 82.451591% |
| D | 5784 | 5784 | 100.000000% |
Noise dominated data is calculated using 1-second bins in cleaned event files. If a bin has >2000 counts, and if more than 50% of those come from <1% of pixels, then it is considered to be noise-dominated and hence unusable.
| Quadrant | # 1 sec bins | Bins with >0 counts | Bins with >2000 counts | High rate bins dominated by noise | Noise dominated (total time) | Noise dominated (detector-on time) | Marked lightcurve |
|---|---|---|---|---|---|---|---|
| A | 6959 | 5784 | 834 | 834 | 11.98% | 14.42% | 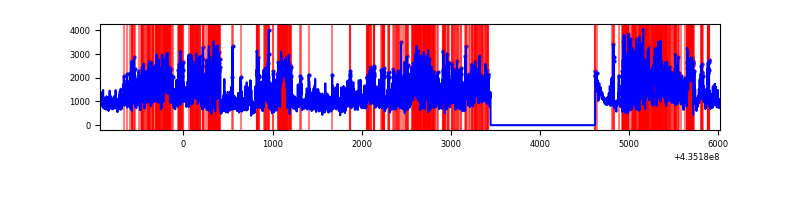 |
| B | 6960 | 5786 | 958 | 958 | 13.76% | 16.56% | 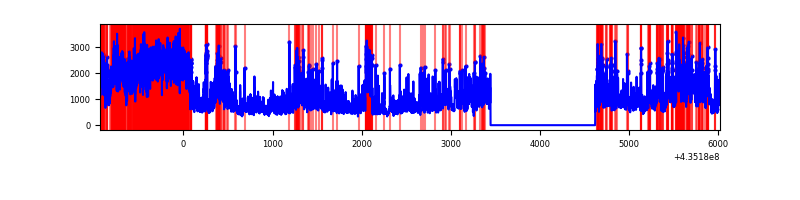 |
| C | 6958 | 5783 | 4317 | 4317 | 62.04% | 74.65% | 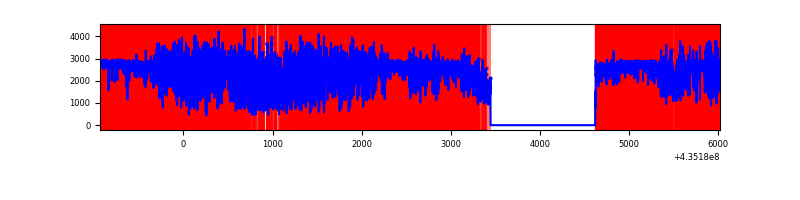 |
| D | 6958 | 5783 | 3847 | 3847 | 55.29% | 66.52% | 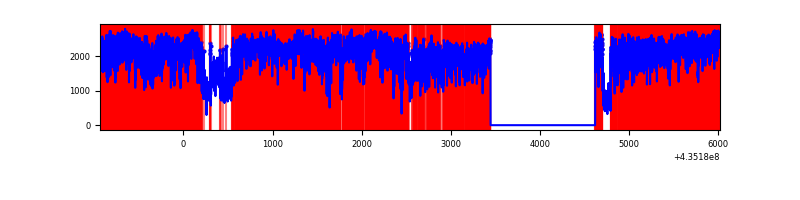 |
Top three noisy pixels from each quadrant. If the there are fewer than three noisy pixels in the level2.evt file, extra rows are filled as -1
| Pixel properties | Quadrant properties | ||||||
|---|---|---|---|---|---|---|---|
| Quadrant | DetID | PixID | Counts | Sigma | Mean | Median | Sigma |
| A | 0 | 228 | 2068493 | 16844.48 | 597 | 585 | 122.8 |
| A | 0 | 227 | 695897 | 5663.78 | 597 | 585 | 122.8 |
| A | 15 | 223 | 666688 | 5425.85 | 597 | 585 | 122.8 |
| B | 3 | 25 | 1939010 | 16322.71 | 618 | 600 | 118.8 |
| B | 3 | 42 | 1904407 | 16031.33 | 618 | 600 | 118.8 |
| B | 5 | 255 | 154723 | 1297.82 | 618 | 600 | 118.8 |
| C | 15 | 142 | 6379675 | 69620.87 | 385 | 387 | 91.6 |
| C | 15 | 190 | 2001865 | 21843.29 | 385 | 387 | 91.6 |
| C | 15 | 174 | 1751746 | 19113.6 | 385 | 387 | 91.6 |
| D | 4 | 216 | 6025588 | 172000.31 | 45 | 40 | 35.0 |
| D | 8 | 160 | 777183 | 22183.68 | 45 | 40 | 35.0 |
| D | 4 | 212 | 716528 | 20452.27 | 45 | 40 | 35.0 |
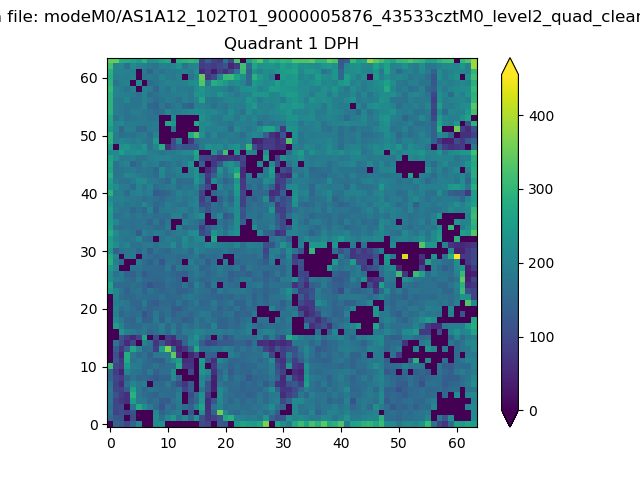
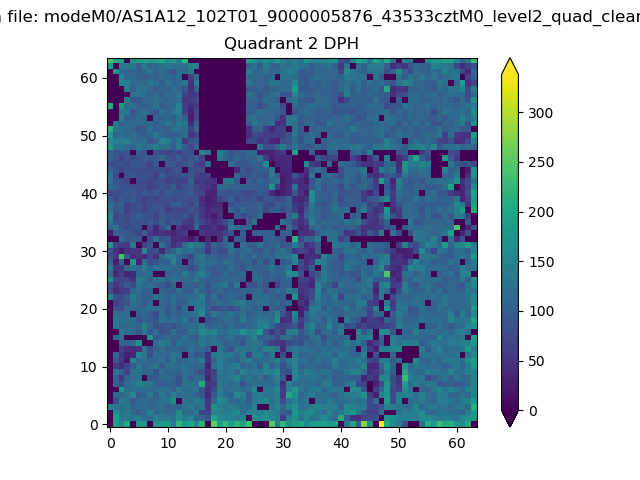
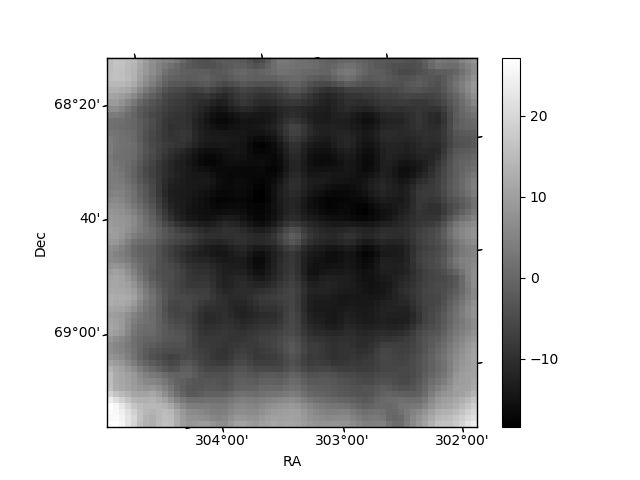
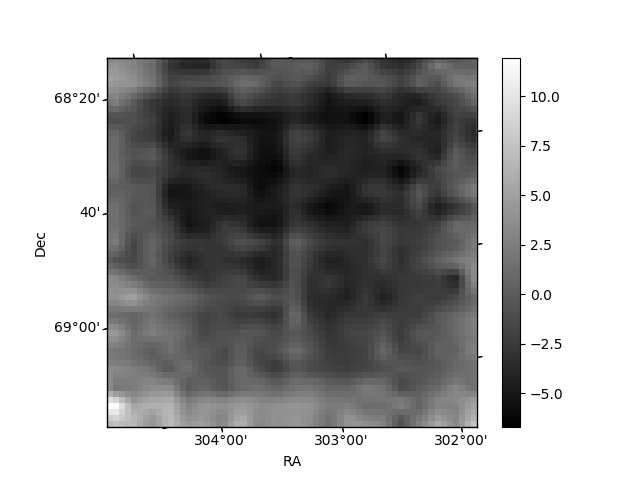
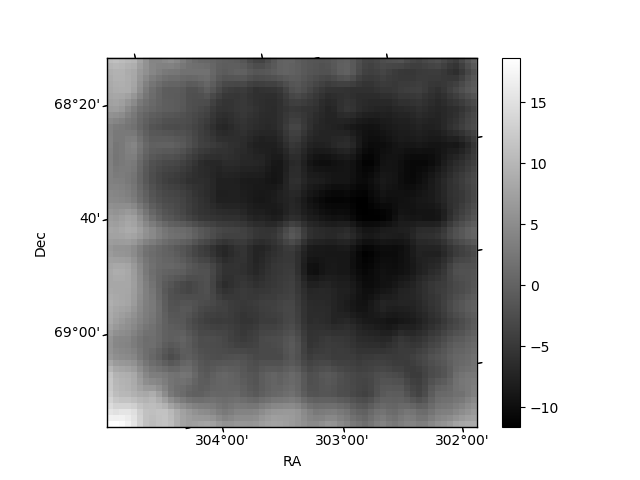
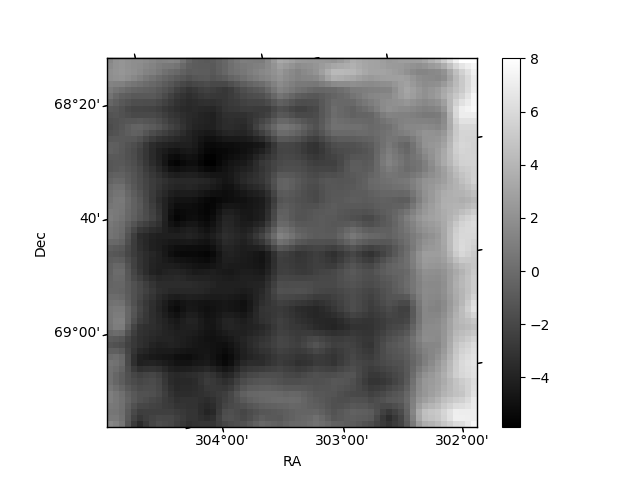
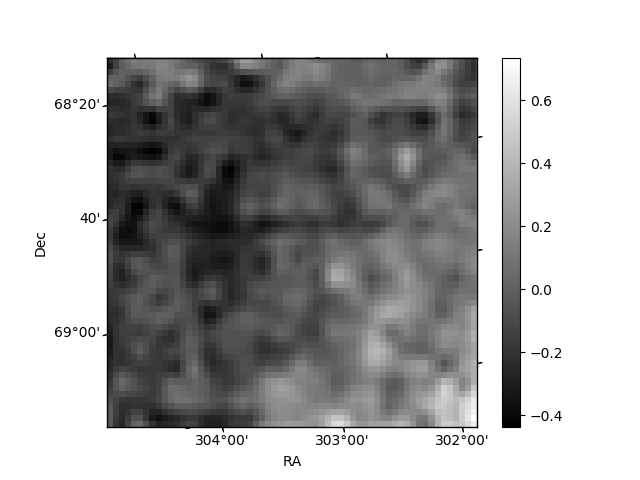
Histogram calculated using DETX and DETY for each event in the final _common_clean file
| Quadrant A |  |
 |
Quadrant B |
|---|---|---|---|
| Quadrant D | 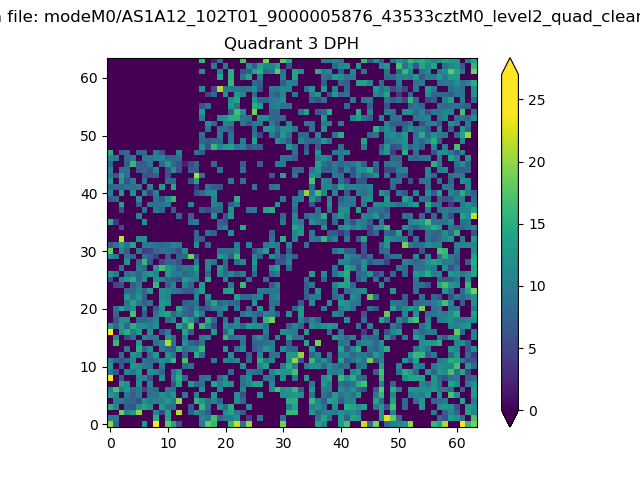 |
 |
Quadrant C |
| Plot type | Count rate plots | Images |
|---|---|---|
| Comparison with Poisson distribution Blue bars denote a histogram of data divided into 1 sec bins. Red curve is a Poisson curve with rate = median count rate of data. |
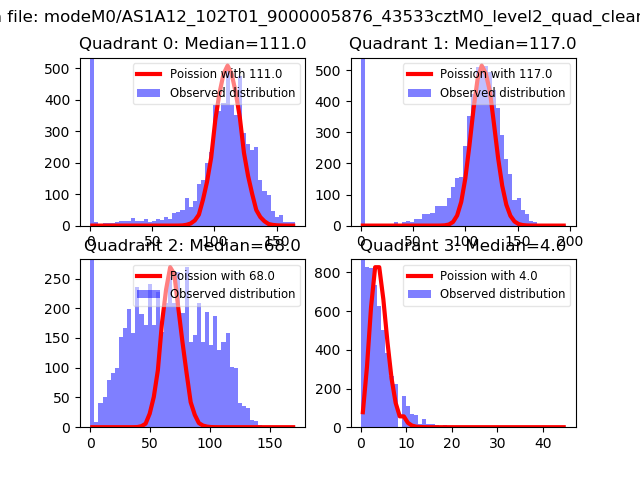 |
 |
| Quadrant-wise count rates Data is divided into 100 sec bins |
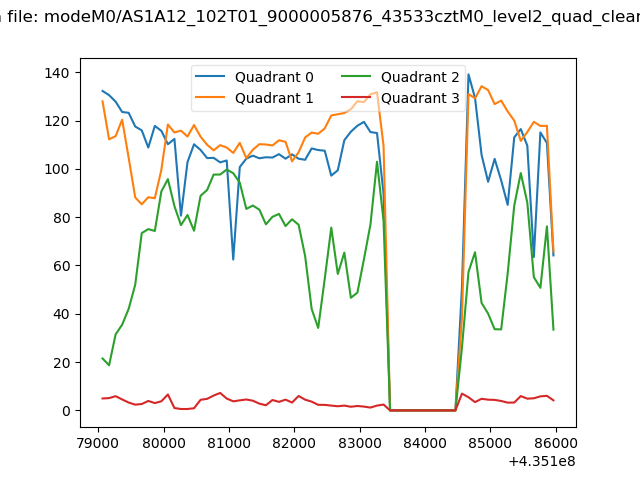 |
|
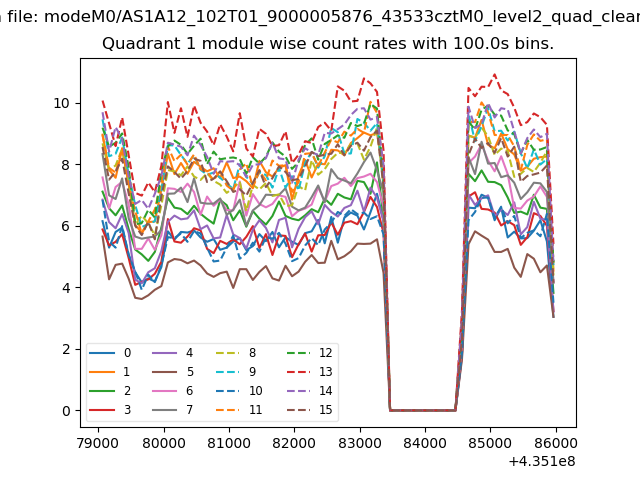
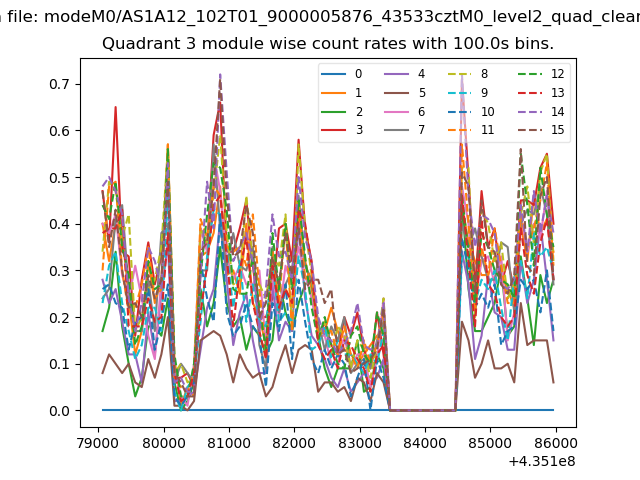
| Module-wise count rates for Quadrant A Data is divided into 100 sec bins |
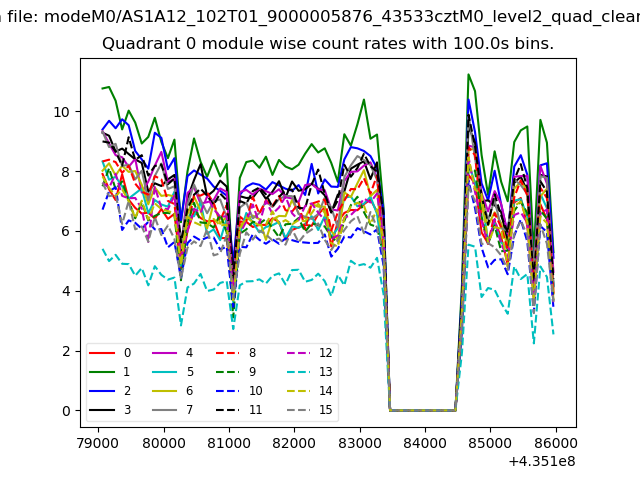 |
 |
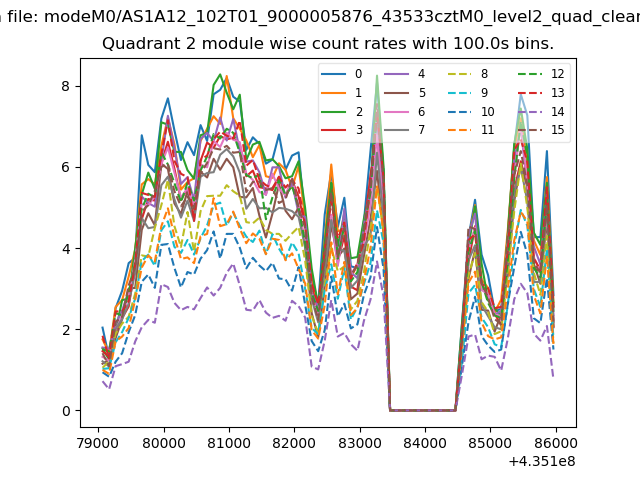
| Module-wise count rates for Quadrant B Data is divided into 100 sec bins |
 |
 |
| Module-wise count rates for Quadrant C Data is divided into 100 sec bins |
 |
 |
| Module-wise count rates for Quadrant D Data is divided into 100 sec bins |
 |
 |
| Parameter | Plot |
|---|---|
| CZT HV Monitor | 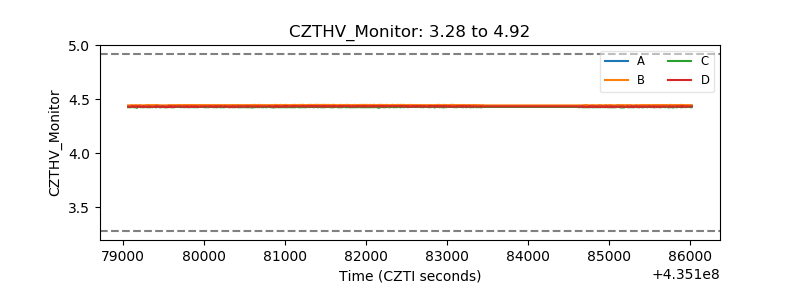 |
| D_VDD | 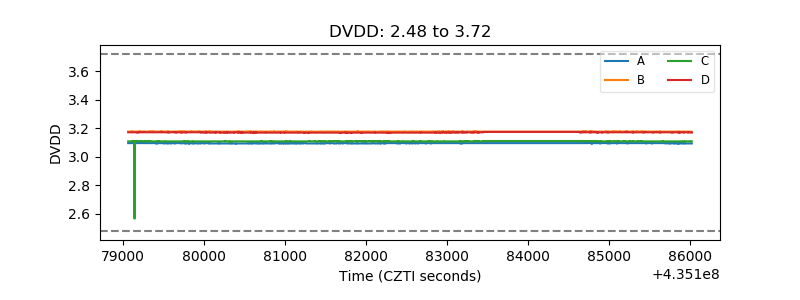 |
| Temperature 1 | 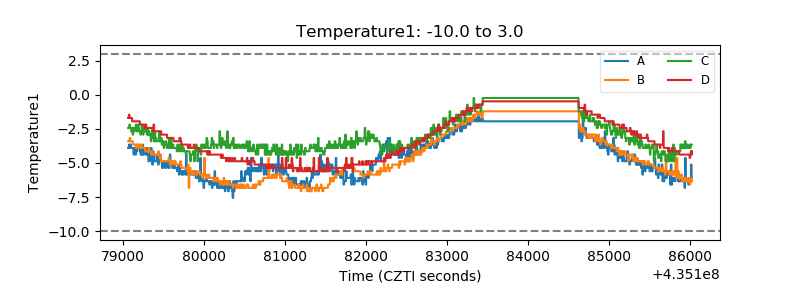 |
| Veto HV Monitor |  |
| Veto LLD | 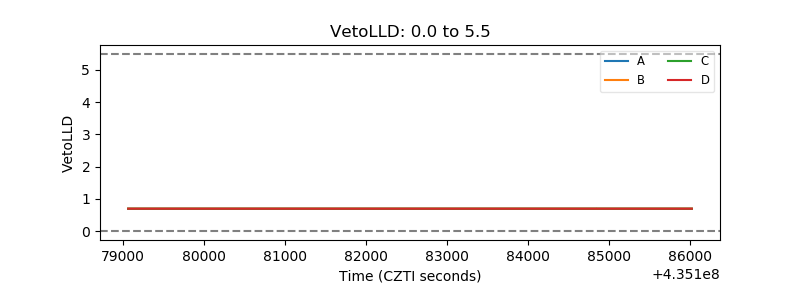 |
| Alpha Counter | 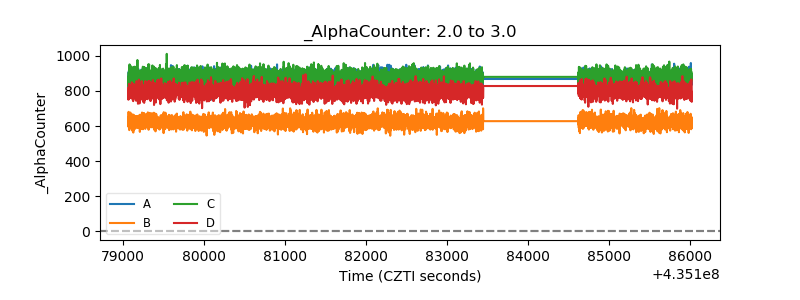 |
| _CPM_Rate | 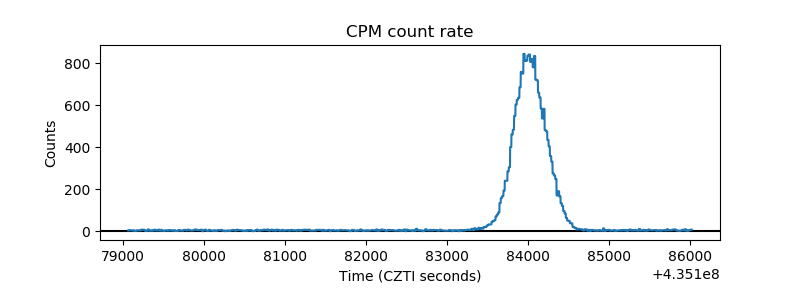 |
| CZT Counter | 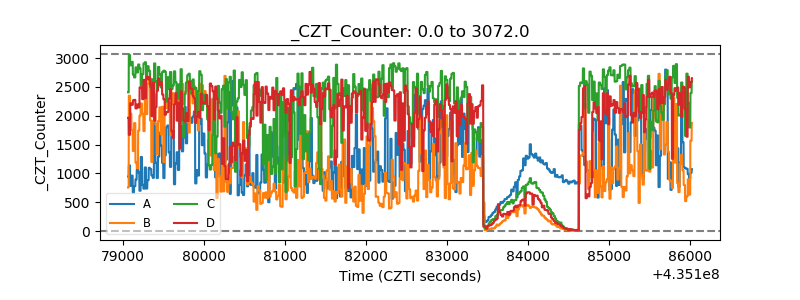 |
| +2.5 Volts monitor | 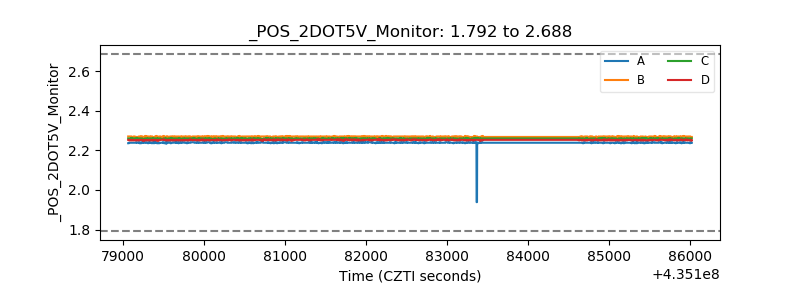 |
| +5 Volts monitor | 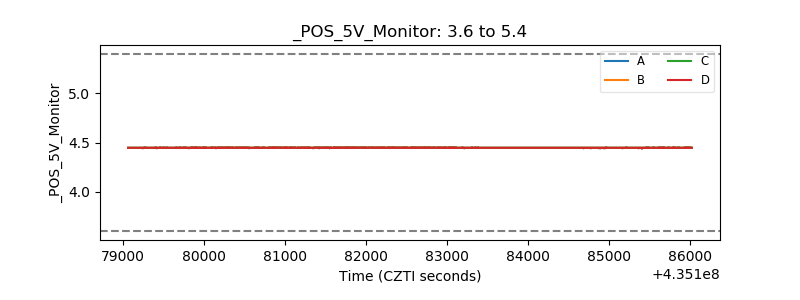 |
| _ROLL_ROT | 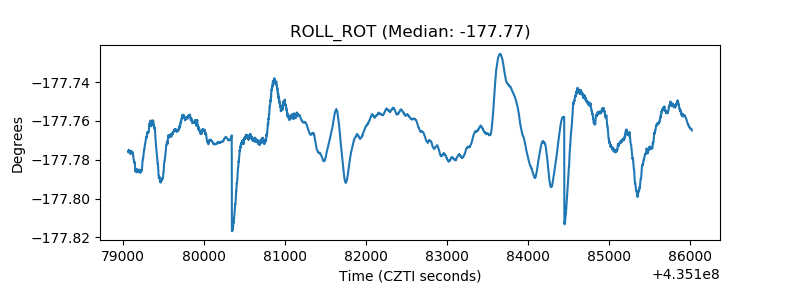 |
| _Roll_DEC | 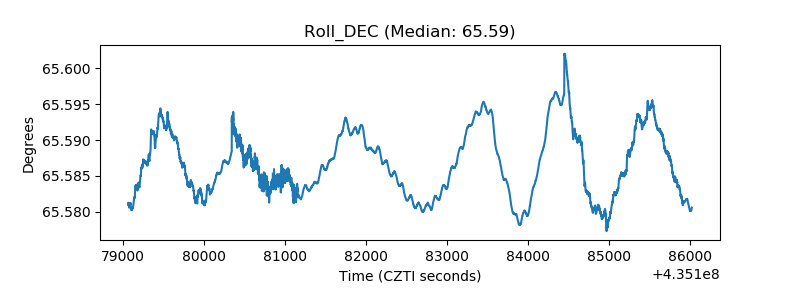 |
| _Roll_RA | 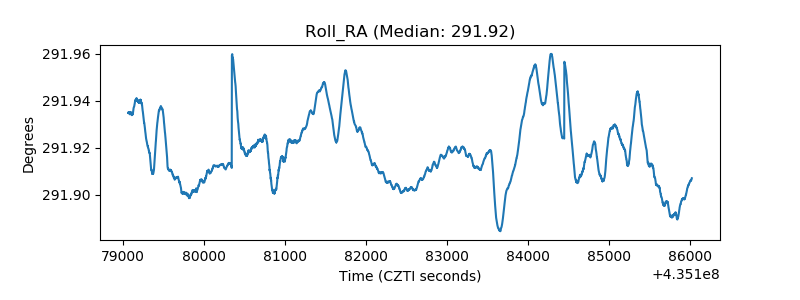 |
| Veto Counter | 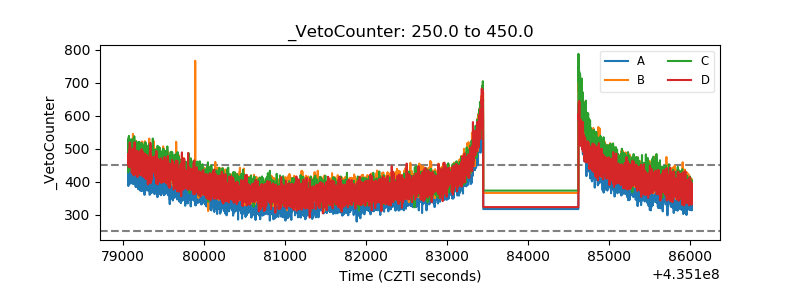 |