| Param | Original file | Final file |
|---|---|---|
| Filename | modeM0/AS1A12_102T01_9000005876_43535cztM0_level2.fits | modeM0/AS1A12_102T01_9000005876_43535cztM0_level2_quad_clean.evt |
| Size (bytes) | 2,304,420,480 | 135,138,240 |
| Size | 2.1 GB | 128.9 MB |
| Events in quadrant A | 16,083,252 | 1,223,994 |
| Events in quadrant B | 13,774,043 | 1,312,378 |
| Events in quadrant C | 29,826,524 | 638,691 |
| Events in quadrant D | 24,696,737 | 73,104 |
| Mode SS | |||
|---|---|---|---|
| Quadrant | BADHDUFLAG | Total packets | Discarded packets |
| A | 0 | 244 | 0 |
| B | 0 | 244 | 0 |
| C | 0 | 244 | 0 |
| D | 0 | 244 | 0 |
| Mode M9 | |||
|---|---|---|---|
| Quadrant | BADHDUFLAG | Total packets | Discarded packets |
| A | 0 | 16 | 0 |
| B | 0 | 16 | 0 |
| C | 0 | 16 | 0 |
| D | 0 | 16 | 0 |
| Mode M0 | |||
|---|---|---|---|
| Quadrant | BADHDUFLAG | Total packets | Discarded packets |
| A | 0 | 56312 | 2 |
| B | 0 | 49402 | 2 |
| C | 0 | 96743 | 2 |
| D | 0 | 81650 | 2 |
| Quadrant | Total seconds | Saturated seconds | Saturation percentage |
|---|---|---|---|
| A | 12008 | 2585 | 21.527315% |
| B | 12008 | 2258 | 18.804131% |
| C | 12007 | 10787 | 89.839260% |
| D | 12008 | 12008 | 100.000000% |
Noise dominated data is calculated using 1-second bins in cleaned event files. If a bin has >2000 counts, and if more than 50% of those come from <1% of pixels, then it is considered to be noise-dominated and hence unusable.
| Quadrant | # 1 sec bins | Bins with >0 counts | Bins with >2000 counts | High rate bins dominated by noise | Noise dominated (total time) | Noise dominated (detector-on time) | Marked lightcurve |
|---|---|---|---|---|---|---|---|
| A | 13628 | 12010 | 1535 | 1535 | 11.26% | 12.78% | 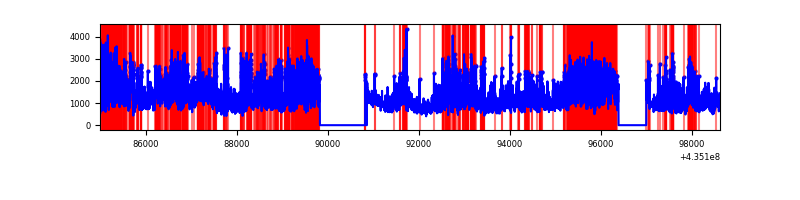 |
| B | 13628 | 12010 | 1432 | 1432 | 10.51% | 11.92% | 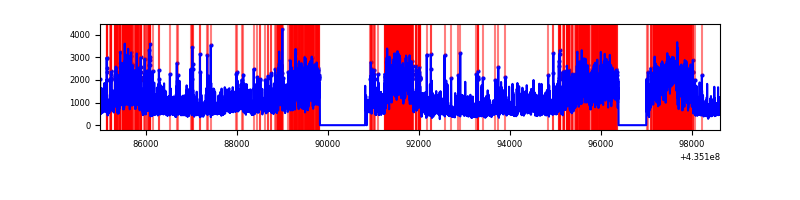 |
| C | 13626 | 12006 | 10199 | 10199 | 74.85% | 84.95% | 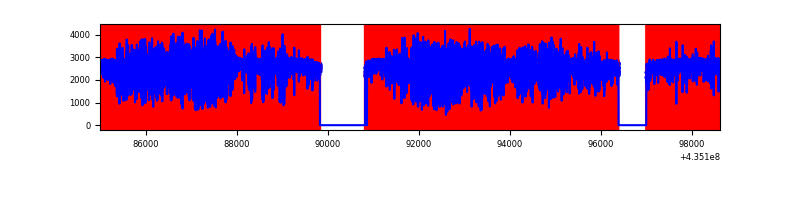 |
| D | 13627 | 12007 | 7373 | 7373 | 54.11% | 61.41% | 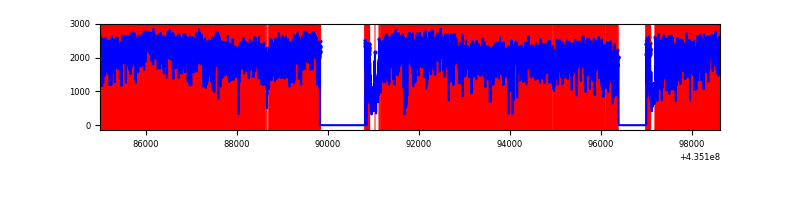 |
Top three noisy pixels from each quadrant. If the there are fewer than three noisy pixels in the level2.evt file, extra rows are filled as -1
| Pixel properties | Quadrant properties | ||||||
|---|---|---|---|---|---|---|---|
| Quadrant | DetID | PixID | Counts | Sigma | Mean | Median | Sigma |
| A | 0 | 228 | 6257633 | 25507.16 | 1218 | 1192 | 245.3 |
| A | 10 | 83 | 1257922 | 5123.62 | 1218 | 1192 | 245.3 |
| A | 15 | 223 | 1183244 | 4819.16 | 1218 | 1192 | 245.3 |
| B | 3 | 25 | 3435937 | 14377.83 | 1262 | 1228 | 238.9 |
| B | 3 | 42 | 3260250 | 13642.4 | 1262 | 1228 | 238.9 |
| B | 5 | 235 | 551610 | 2303.92 | 1262 | 1228 | 238.9 |
| C | 15 | 142 | 10855724 | 71333.81 | 653 | 657 | 152.2 |
| C | 15 | 126 | 6696618 | 44002.34 | 653 | 657 | 152.2 |
| C | 15 | 190 | 3110896 | 20438.86 | 653 | 657 | 152.2 |
| D | 4 | 216 | 14742182 | 140411.25 | 116 | 104 | 105.0 |
| D | 8 | 160 | 1453464 | 13842.56 | 116 | 104 | 105.0 |
| D | 4 | 212 | 1146489 | 10918.77 | 116 | 104 | 105.0 |
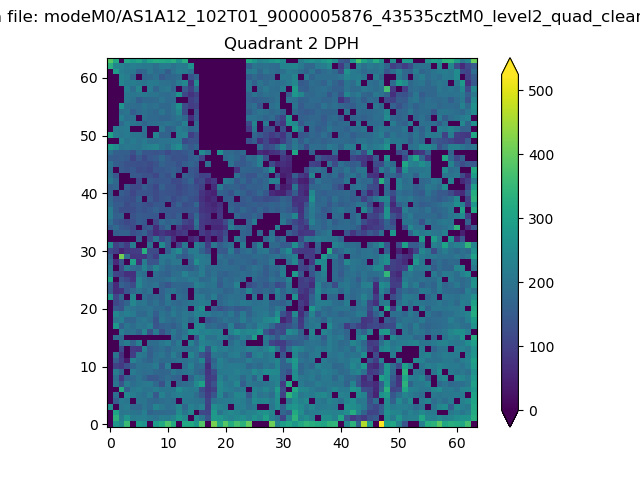
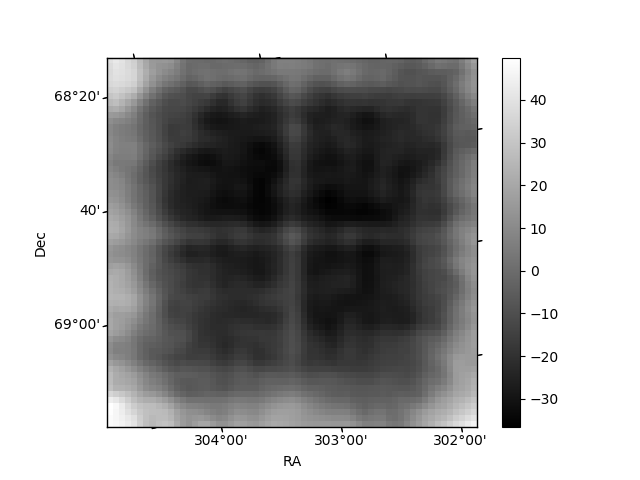
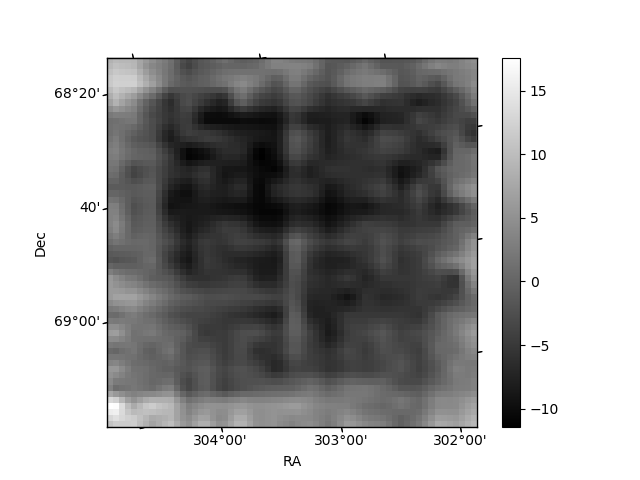
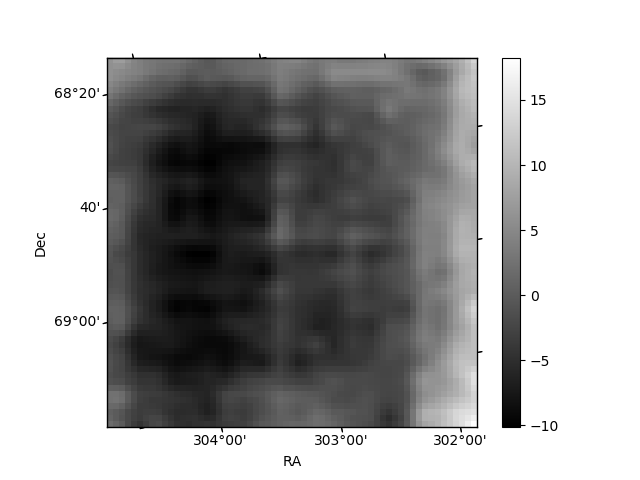
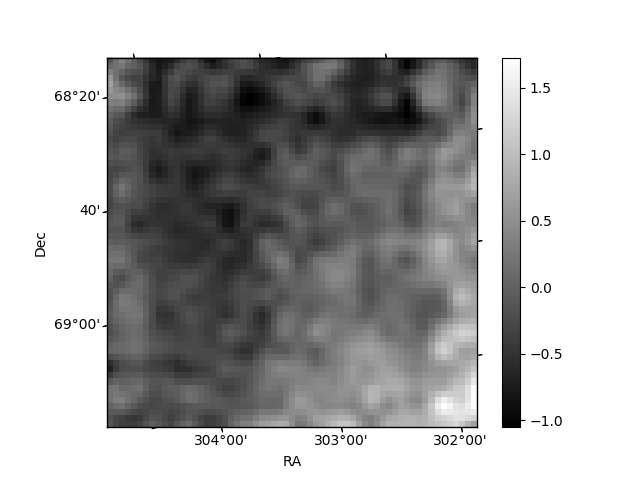
Histogram calculated using DETX and DETY for each event in the final _common_clean file
| Quadrant A | 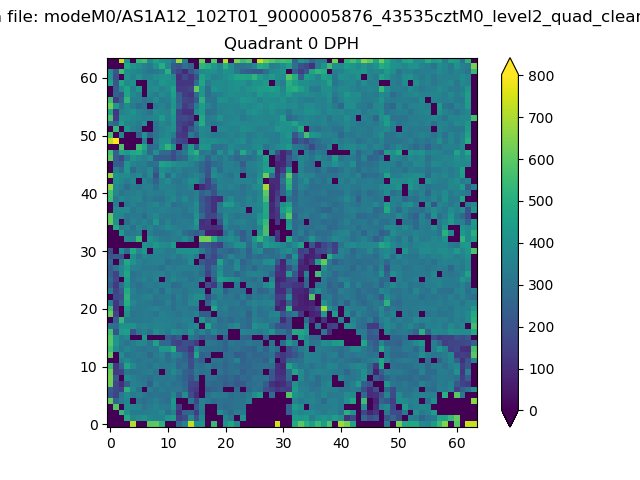 |
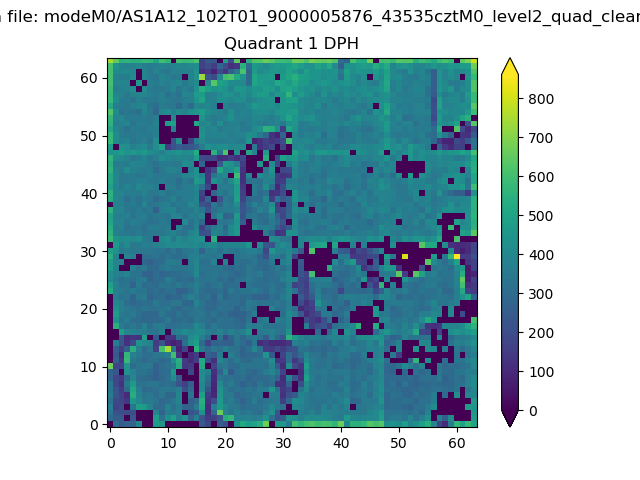 |
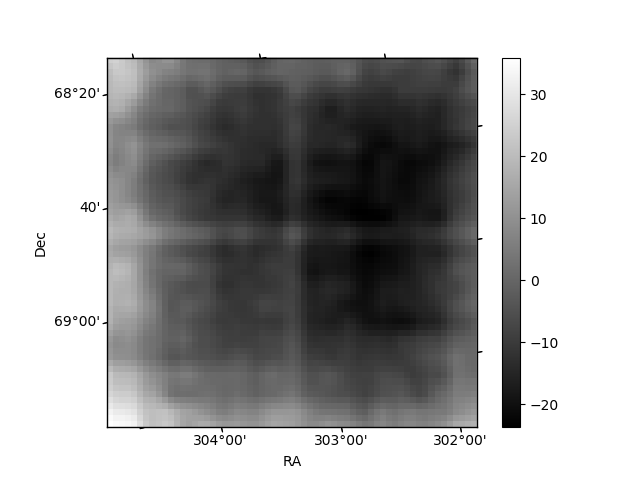
Quadrant B |
|---|---|---|---|
| Quadrant D | 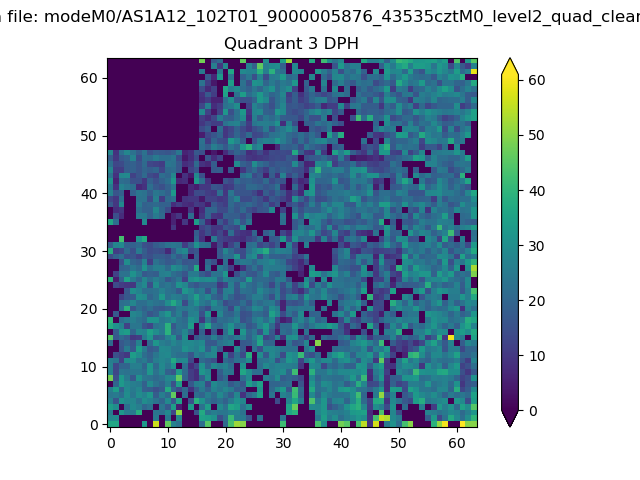 |
 |
Quadrant C |
| Plot type | Count rate plots | Images |
|---|---|---|
| Comparison with Poisson distribution Blue bars denote a histogram of data divided into 1 sec bins. Red curve is a Poisson curve with rate = median count rate of data. |
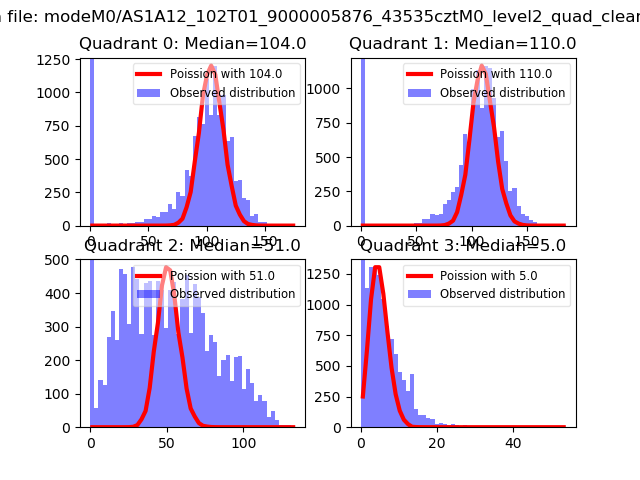 |
 |
| Quadrant-wise count rates Data is divided into 100 sec bins |
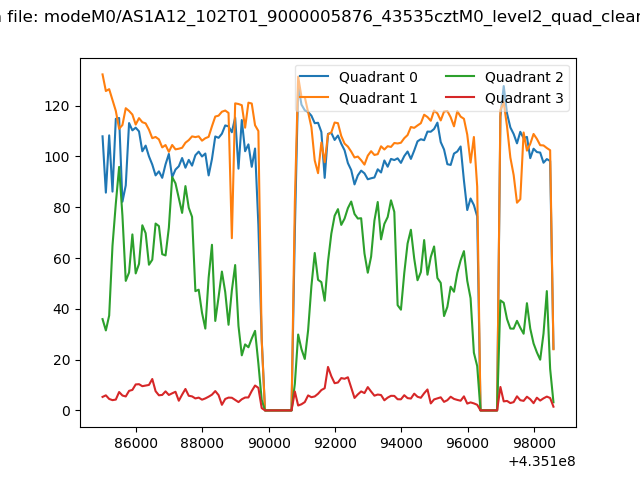 |
|
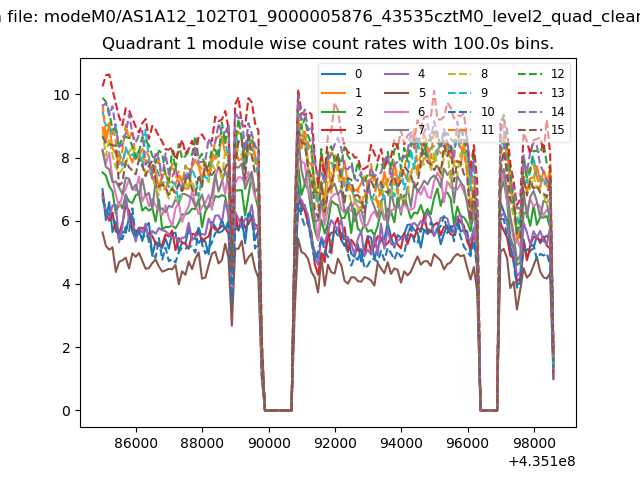
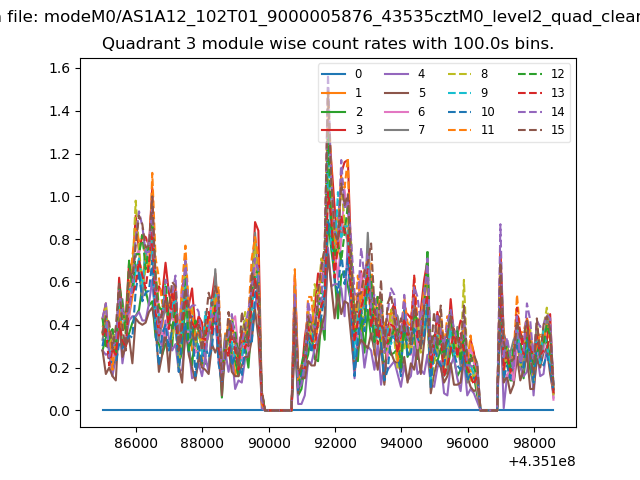
| Module-wise count rates for Quadrant A Data is divided into 100 sec bins |
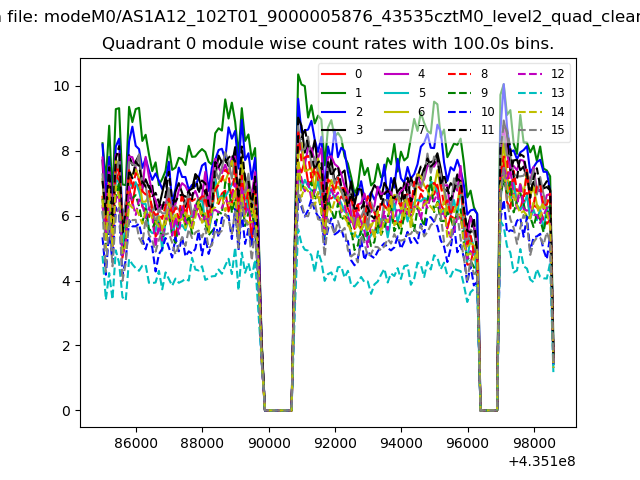 |
 |
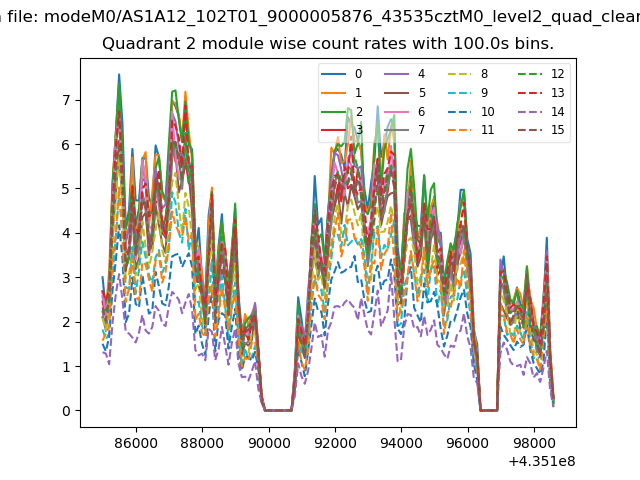
| Module-wise count rates for Quadrant B Data is divided into 100 sec bins |
 |
 |
| Module-wise count rates for Quadrant C Data is divided into 100 sec bins |
 |
 |
| Module-wise count rates for Quadrant D Data is divided into 100 sec bins |
 |
 |
| Parameter | Plot |
|---|---|
| CZT HV Monitor | 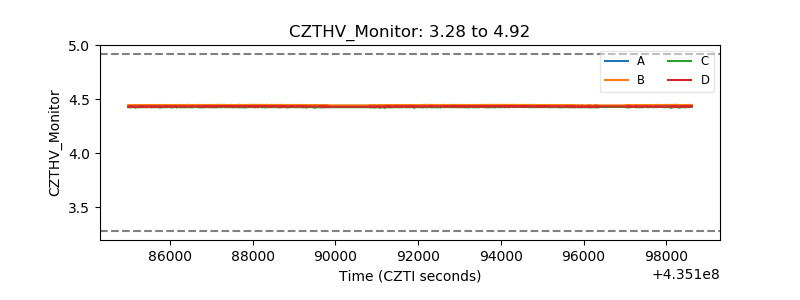 |
| D_VDD | 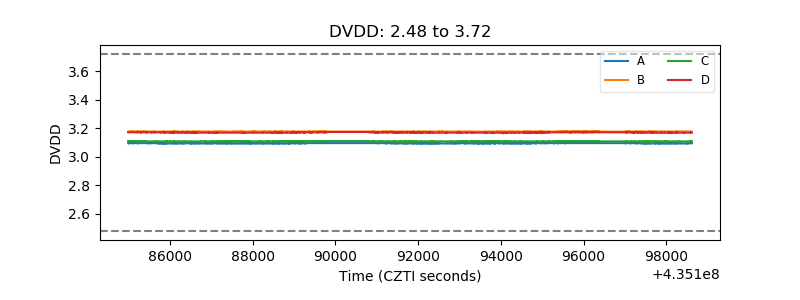 |
| Temperature 1 | 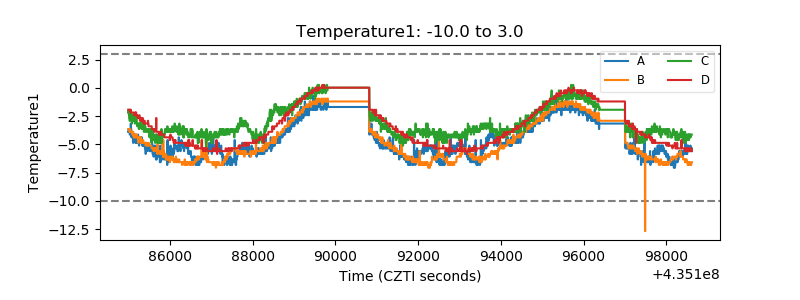 |
| Veto HV Monitor | 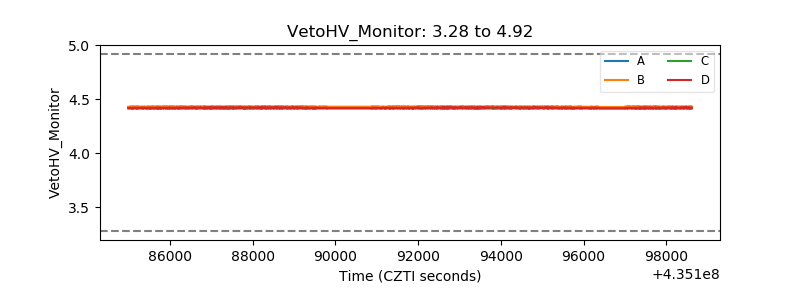 |
| Veto LLD | 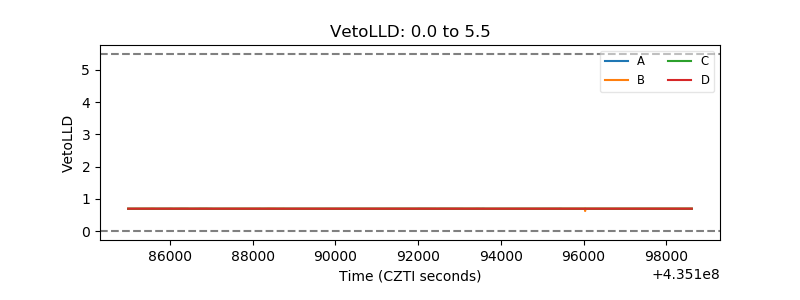 |
| Alpha Counter | 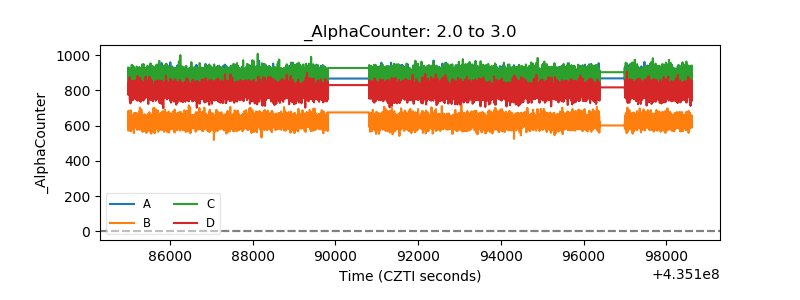 |
| _CPM_Rate | 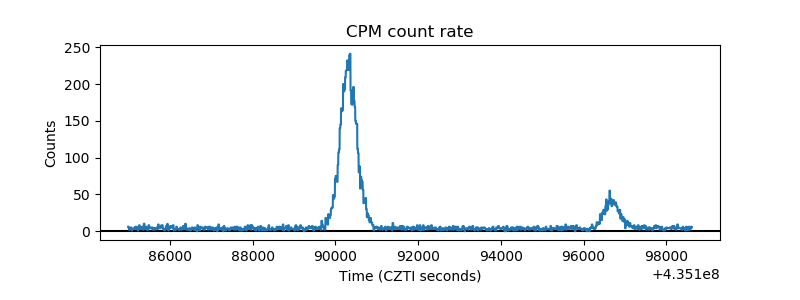 |
| CZT Counter |  |
| +2.5 Volts monitor | 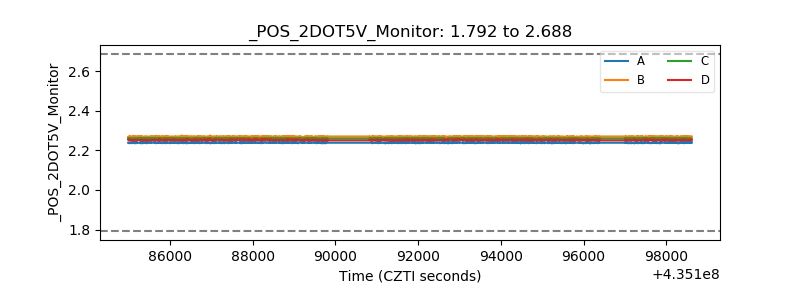 |
| +5 Volts monitor | 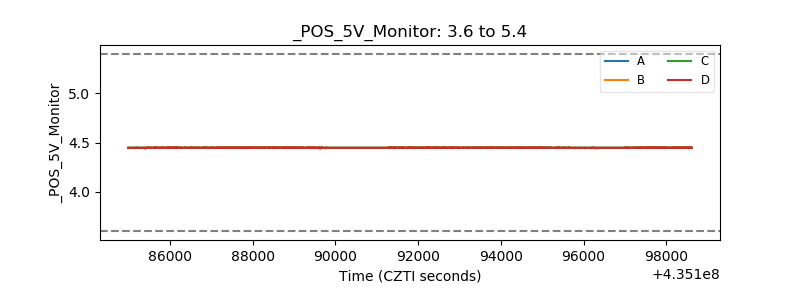 |
| _ROLL_ROT | 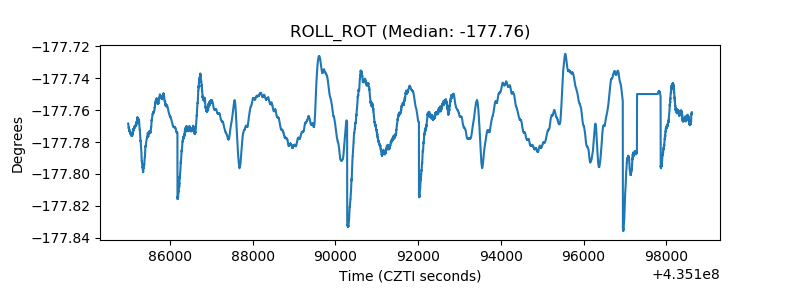 |
| _Roll_DEC | 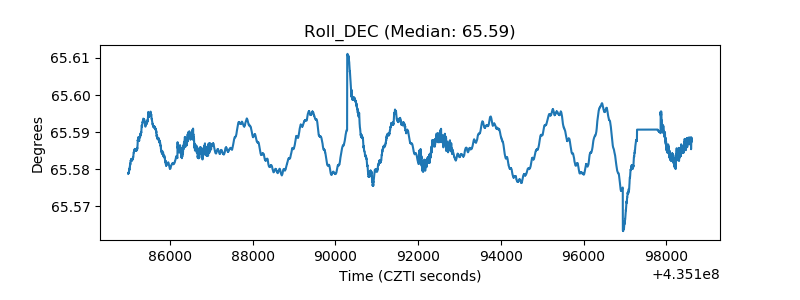 |
| _Roll_RA | 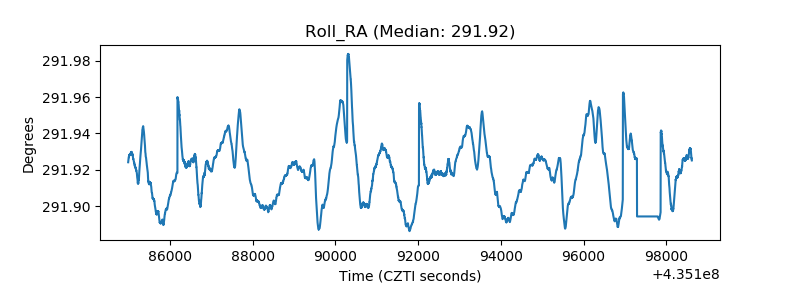 |
| Veto Counter | 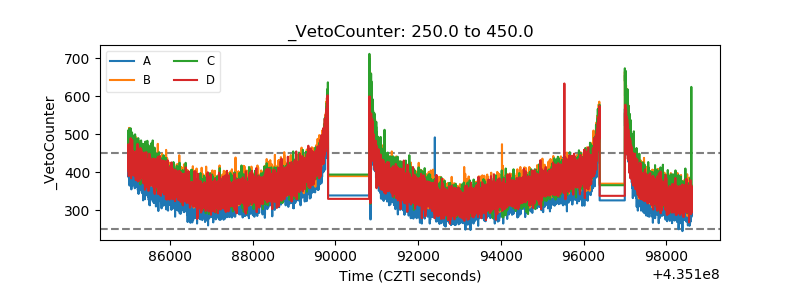 |