| Param | Original file | Final file |
|---|---|---|
| Filename | modeM0/AS1A12_102T01_9000005876_43540cztM0_level2.fits | modeM0/AS1A12_102T01_9000005876_43540cztM0_level2_quad_clean.evt |
| Size (bytes) | 1,721,027,520 | 75,885,120 |
| Size | 1.6 GB | 72.4 MB |
| Events in quadrant A | 14,108,816 | 693,326 |
| Events in quadrant B | 14,321,965 | 625,907 |
| Events in quadrant C | 19,933,768 | 395,389 |
| Events in quadrant D | 14,738,997 | 25,686 |
| Mode SS | |||
|---|---|---|---|
| Quadrant | BADHDUFLAG | Total packets | Discarded packets |
| A | 0 | 158 | 0 |
| B | 0 | 158 | 0 |
| C | 0 | 158 | 0 |
| D | 0 | 158 | 0 |
| Mode M9 | |||
|---|---|---|---|
| Quadrant | BADHDUFLAG | Total packets | Discarded packets |
| A | 0 | 1 | 0 |
| B | 0 | 1 | 0 |
| C | 0 | 1 | 0 |
| D | 0 | 1 | 0 |
| Mode M0 | |||
|---|---|---|---|
| Quadrant | BADHDUFLAG | Total packets | Discarded packets |
| A | 0 | 47378 | 30 |
| B | 0 | 48032 | 27 |
| C | 0 | 64497 | 32 |
| D | 0 | 49229 | 22 |
| Quadrant | Total seconds | Saturated seconds | Saturation percentage |
|---|---|---|---|
| A | 7853 | 3995 | 50.872278% |
| B | 7854 | 4406 | 56.098803% |
| C | 7854 | 7588 | 96.613191% |
| D | 7855 | 7855 | 100.000000% |
Noise dominated data is calculated using 1-second bins in cleaned event files. If a bin has >2000 counts, and if more than 50% of those come from <1% of pixels, then it is considered to be noise-dominated and hence unusable.
| Quadrant | # 1 sec bins | Bins with >0 counts | Bins with >2000 counts | High rate bins dominated by noise | Noise dominated (total time) | Noise dominated (detector-on time) | Marked lightcurve |
|---|---|---|---|---|---|---|---|
| A | 7898 | 7858 | 2939 | 2939 | 37.21% | 37.40% | 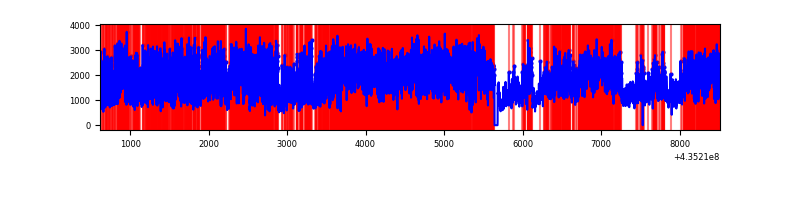 |
| B | 7897 | 7856 | 3776 | 3776 | 47.82% | 48.07% | 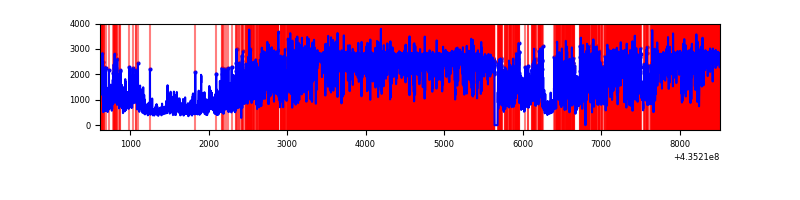 |
| C | 7897 | 7854 | 7256 | 7256 | 91.88% | 92.39% | 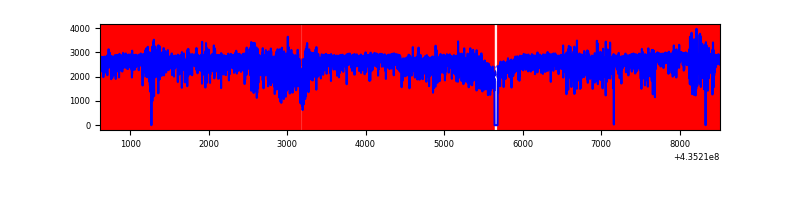 |
| D | 7897 | 7854 | 3683 | 3683 | 46.64% | 46.89% | 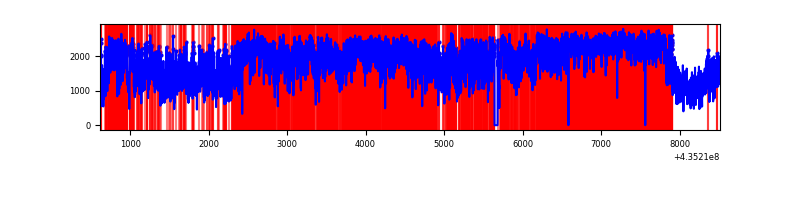 |
Top three noisy pixels from each quadrant. If the there are fewer than three noisy pixels in the level2.evt file, extra rows are filled as -1
| Pixel properties | Quadrant properties | ||||||
|---|---|---|---|---|---|---|---|
| Quadrant | DetID | PixID | Counts | Sigma | Mean | Median | Sigma |
| A | 0 | 228 | 5952220 | 39783.95 | 723 | 707 | 149.6 |
| A | 0 | 227 | 2461046 | 16446.57 | 723 | 707 | 149.6 |
| A | 15 | 223 | 1077756 | 7199.72 | 723 | 707 | 149.6 |
| B | 3 | 42 | 9327915 | 75992.41 | 630 | 613 | 122.7 |
| B | 3 | 25 | 834345 | 6792.67 | 630 | 613 | 122.7 |
| B | 5 | 235 | 662160 | 5389.83 | 630 | 613 | 122.7 |
| C | 15 | 142 | 10054163 | 103865.62 | 412 | 414 | 96.8 |
| C | 15 | 158 | 2472411 | 25538.28 | 412 | 414 | 96.8 |
| C | 15 | 126 | 1936432 | 20001.07 | 412 | 414 | 96.8 |
| D | 4 | 216 | 6686863 | 185781.04 | 52 | 48 | 36.0 |
| D | 4 | 201 | 5102972 | 141775.5 | 52 | 48 | 36.0 |
| D | 4 | 215 | 454610 | 12629.18 | 52 | 48 | 36.0 |
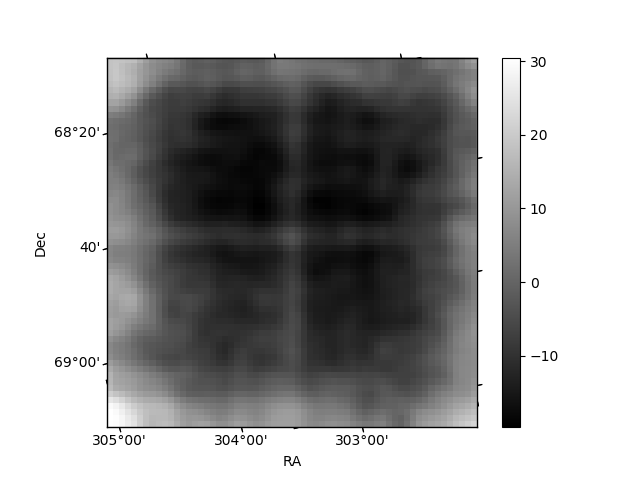
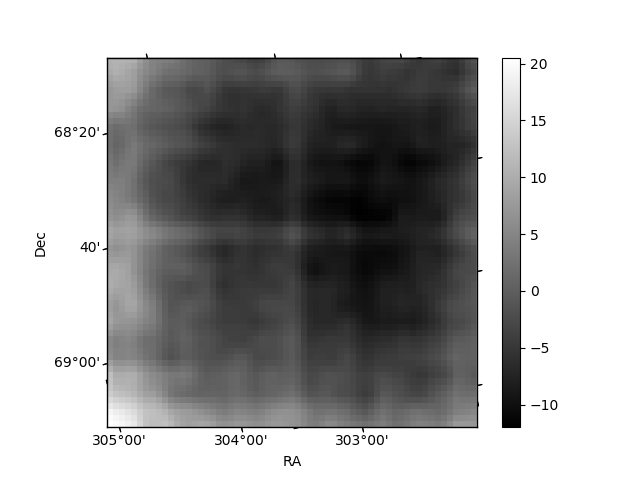
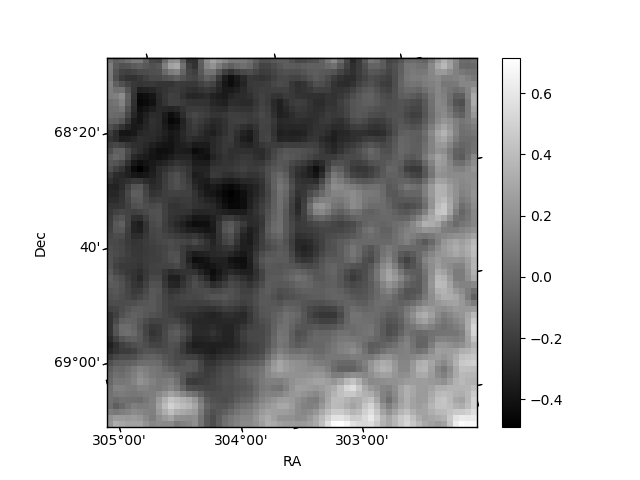
Histogram calculated using DETX and DETY for each event in the final _common_clean file
| Quadrant A | 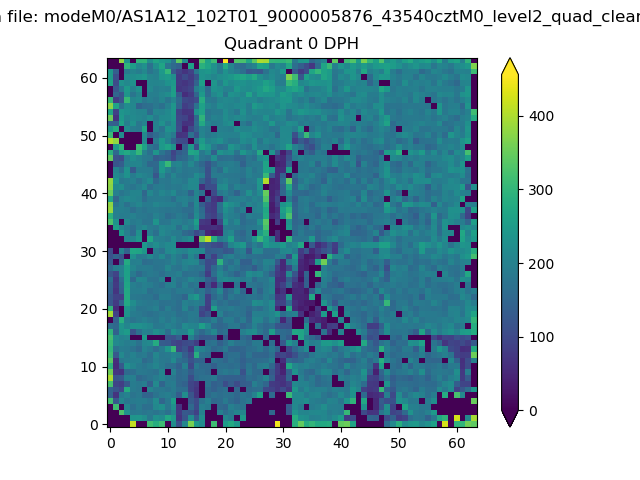 |
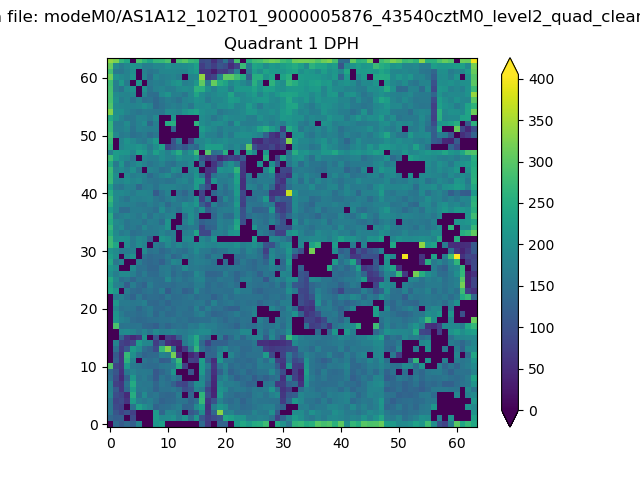 |
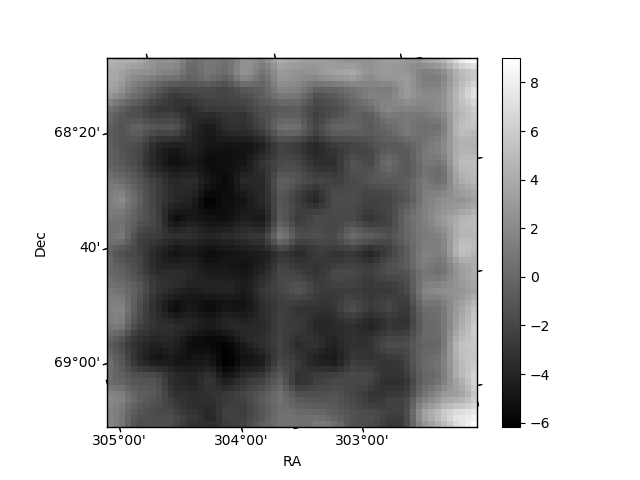
Quadrant B |
|---|---|---|---|
| Quadrant D | 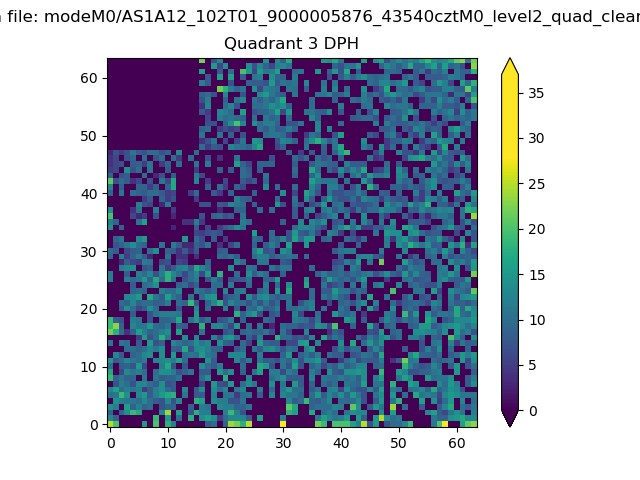 |
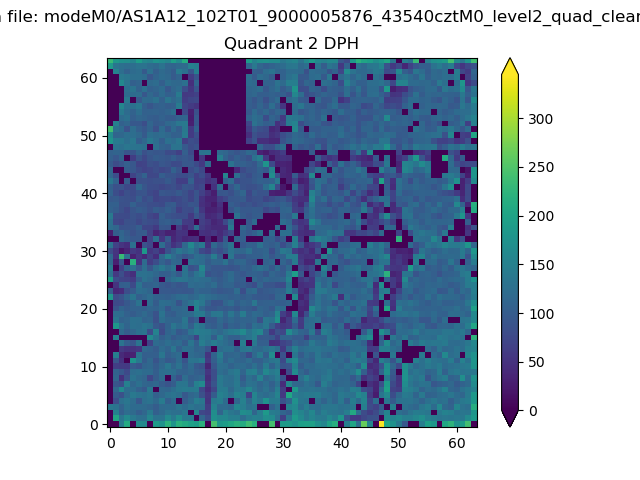 |
Quadrant C |
| Plot type | Count rate plots | Images |
|---|---|---|
| Comparison with Poisson distribution Blue bars denote a histogram of data divided into 1 sec bins. Red curve is a Poisson curve with rate = median count rate of data. |
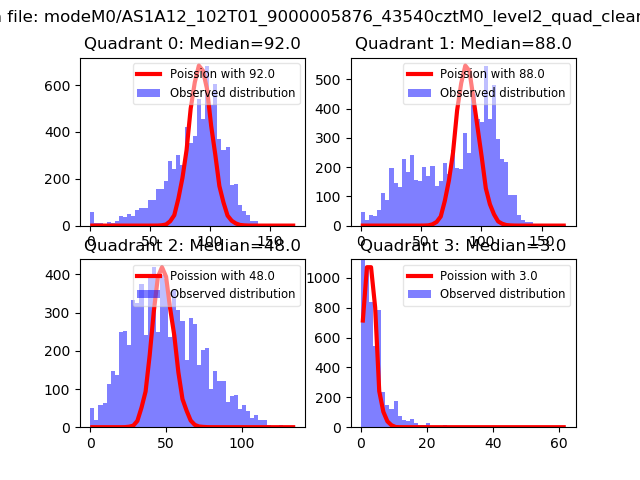 |
 |
| Quadrant-wise count rates Data is divided into 100 sec bins |
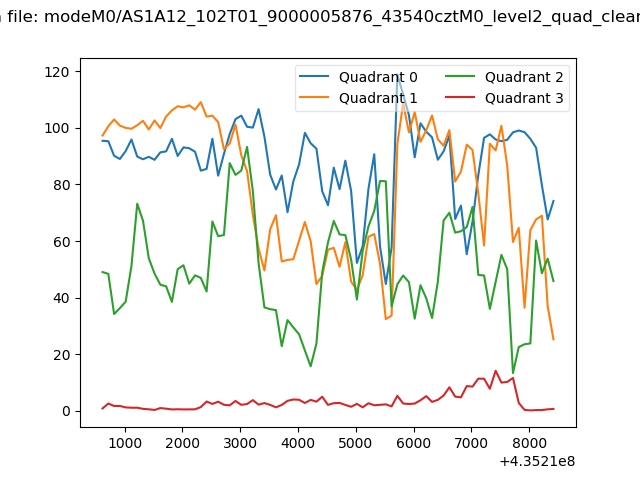 |
|
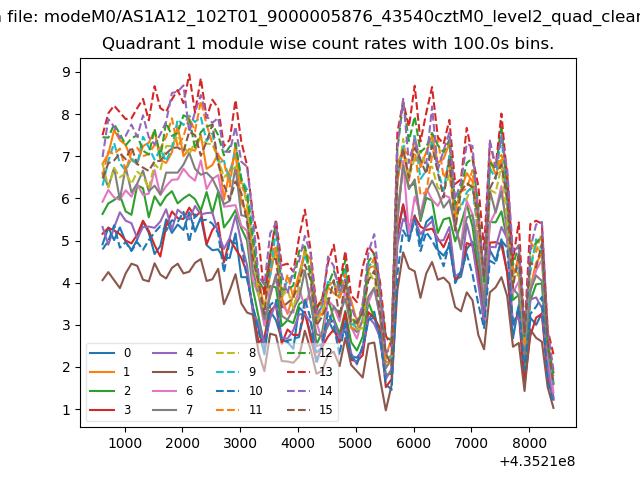
| Module-wise count rates for Quadrant A Data is divided into 100 sec bins |
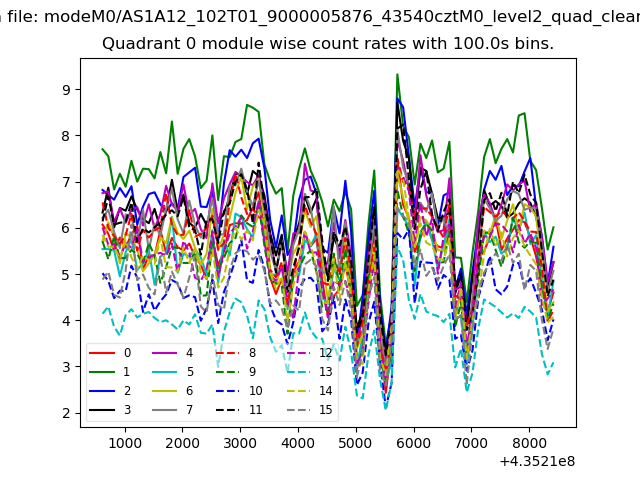 |
 |
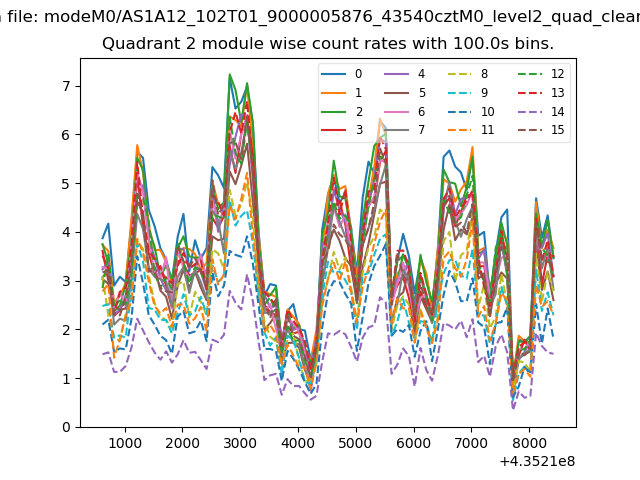
| Module-wise count rates for Quadrant B Data is divided into 100 sec bins |
 |
 |
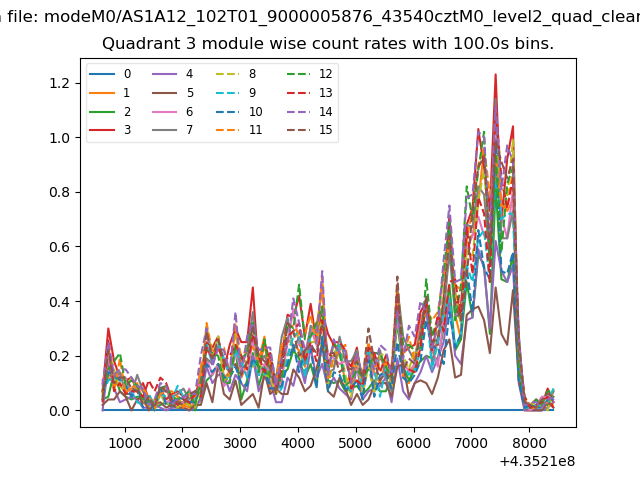
| Module-wise count rates for Quadrant C Data is divided into 100 sec bins |
 |
 |
| Module-wise count rates for Quadrant D Data is divided into 100 sec bins |
 |
 |
| Parameter | Plot |
|---|---|
| CZT HV Monitor | 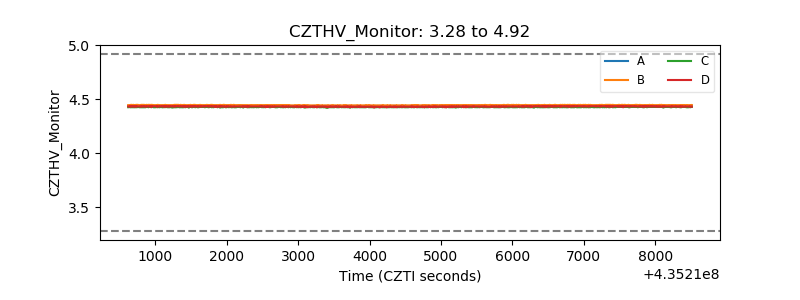 |
| D_VDD | 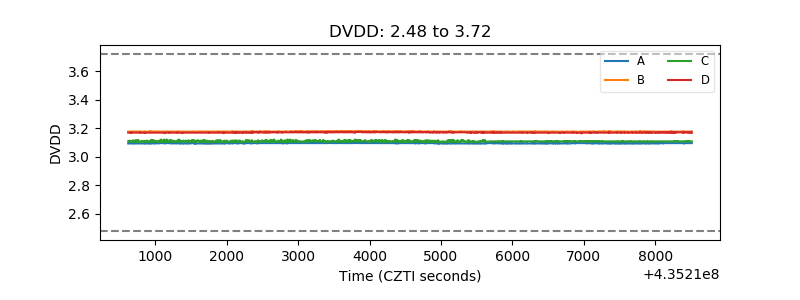 |
| Temperature 1 | 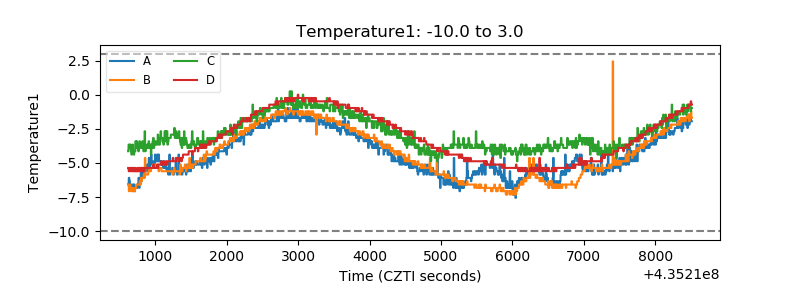 |
| Veto HV Monitor | 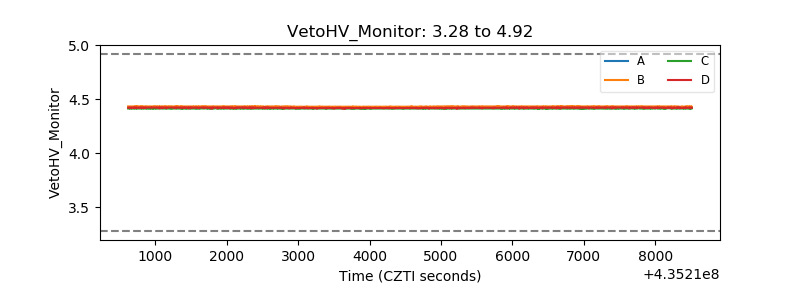 |
| Veto LLD | 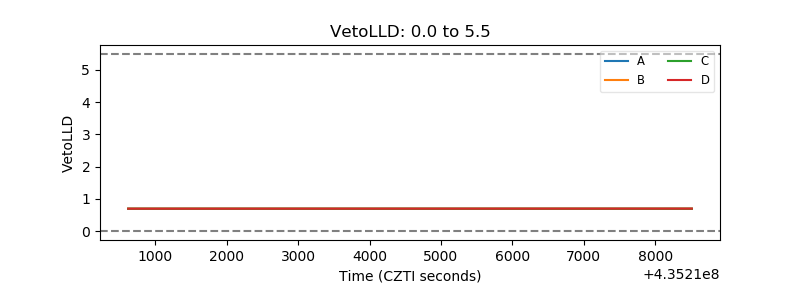 |
| Alpha Counter | 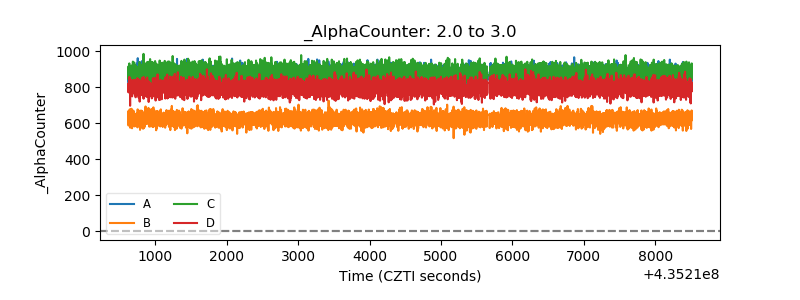 |
| _CPM_Rate | 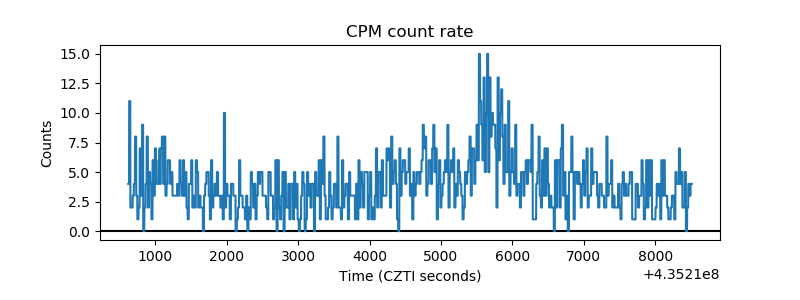 |
| CZT Counter | 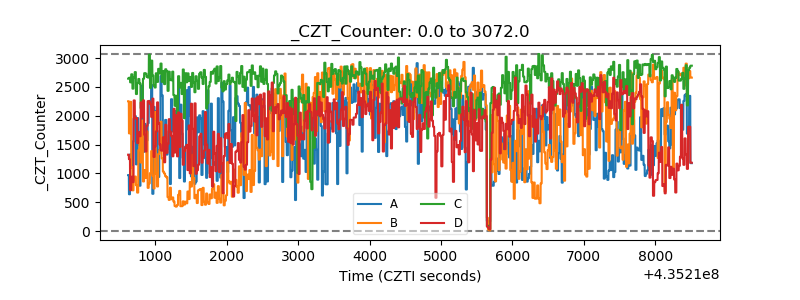 |
| +2.5 Volts monitor | 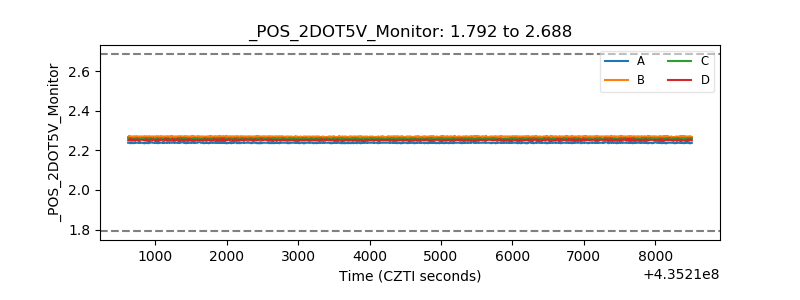 |
| +5 Volts monitor | 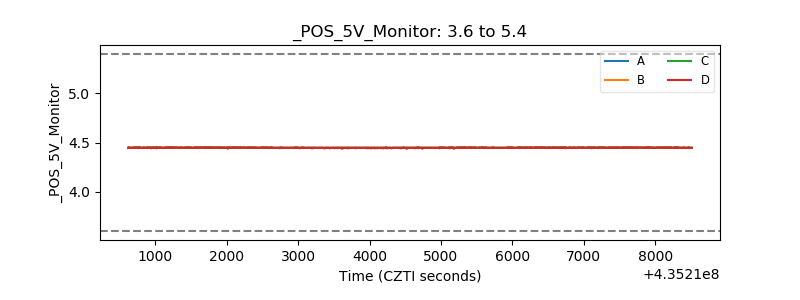 |
| _ROLL_ROT | 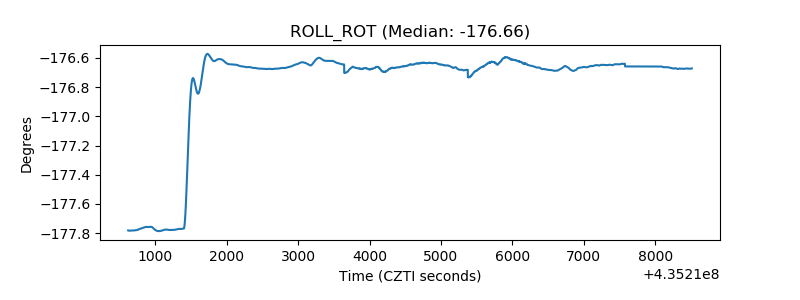 |
| _Roll_DEC | 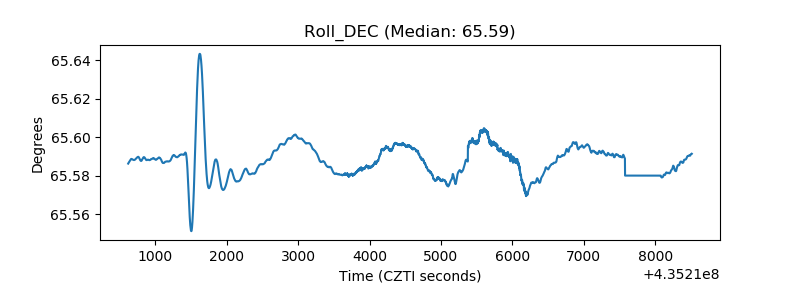 |
| _Roll_RA | 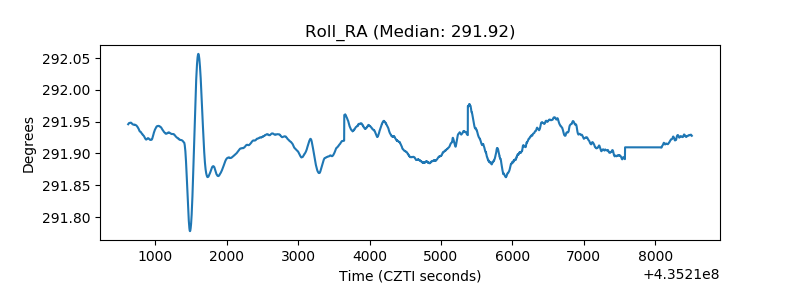 |
| Veto Counter | 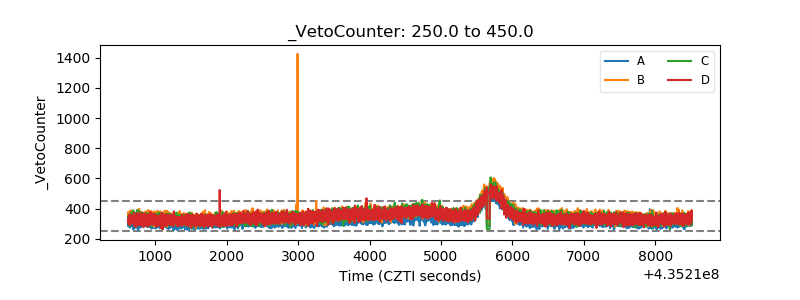 |