| Param | Original file | Final file |
|---|---|---|
| Filename | modeM0/AS1A12_102T01_9000005876_43541cztM0_level2.fits | modeM0/AS1A12_102T01_9000005876_43541cztM0_level2_quad_clean.evt |
| Size (bytes) | 1,734,675,840 | 69,275,520 |
| Size | 1.6 GB | 66.1 MB |
| Events in quadrant A | 12,097,710 | 750,945 |
| Events in quadrant B | 16,201,072 | 490,848 |
| Events in quadrant C | 19,957,631 | 259,910 |
| Events in quadrant D | 15,364,282 | 48,326 |
| Mode SS | |||
|---|---|---|---|
| Quadrant | BADHDUFLAG | Total packets | Discarded packets |
| A | 0 | 156 | 0 |
| B | 0 | 156 | 0 |
| C | 0 | 156 | 0 |
| D | 0 | 156 | 0 |
| Mode M9 | |||
|---|---|---|---|
| Quadrant | BADHDUFLAG | Total packets | Discarded packets |
| A | 0 | 4 | 0 |
| B | 0 | 4 | 0 |
| C | 0 | 4 | 0 |
| D | 0 | 4 | 0 |
| Mode M0 | |||
|---|---|---|---|
| Quadrant | BADHDUFLAG | Total packets | Discarded packets |
| A | 0 | 41363 | 1 |
| B | 0 | 53423 | 1 |
| C | 0 | 64442 | 1 |
| D | 0 | 50959 | 1 |
| Quadrant | Total seconds | Saturated seconds | Saturation percentage |
|---|---|---|---|
| A | 7709 | 2715 | 35.218576% |
| B | 7709 | 5463 | 70.865222% |
| C | 7710 | 7581 | 98.326848% |
| D | 7710 | 7710 | 100.000000% |
Noise dominated data is calculated using 1-second bins in cleaned event files. If a bin has >2000 counts, and if more than 50% of those come from <1% of pixels, then it is considered to be noise-dominated and hence unusable.
| Quadrant | # 1 sec bins | Bins with >0 counts | Bins with >2000 counts | High rate bins dominated by noise | Noise dominated (total time) | Noise dominated (detector-on time) | Marked lightcurve |
|---|---|---|---|---|---|---|---|
| A | 8114 | 7710 | 1828 | 1828 | 22.53% | 23.71% | 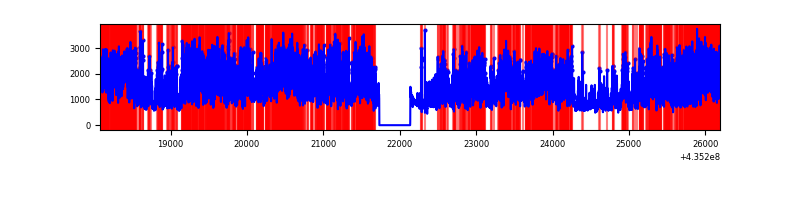 |
| B | 8113 | 7708 | 4922 | 4922 | 60.67% | 63.86% | 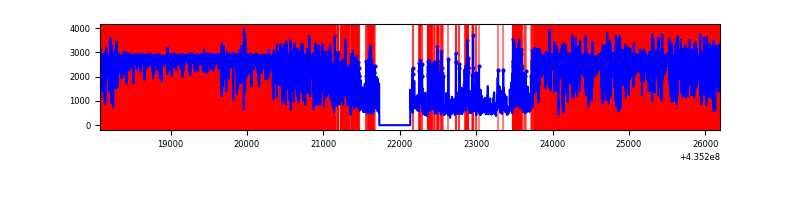 |
| C | 8114 | 7709 | 7115 | 7115 | 87.69% | 92.29% | 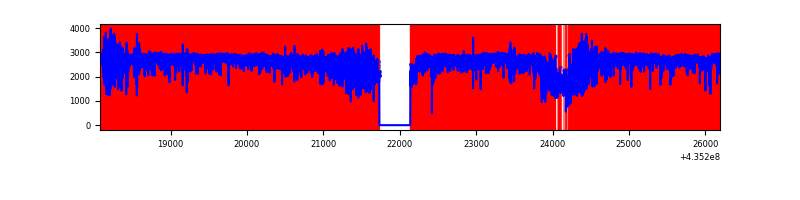 |
| D | 8114 | 7709 | 4446 | 4446 | 54.79% | 57.67% | 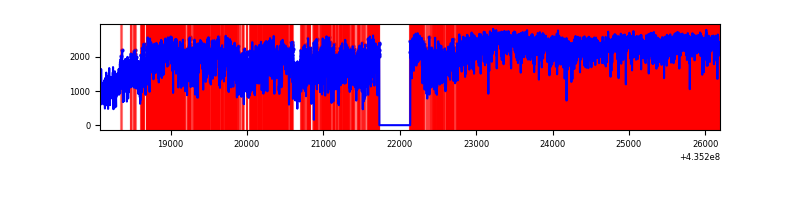 |
Top three noisy pixels from each quadrant. If the there are fewer than three noisy pixels in the level2.evt file, extra rows are filled as -1
| Pixel properties | Quadrant properties | ||||||
|---|---|---|---|---|---|---|---|
| Quadrant | DetID | PixID | Counts | Sigma | Mean | Median | Sigma |
| A | 0 | 228 | 5491858 | 34301.73 | 768 | 754 | 160.1 |
| A | 0 | 227 | 1003543 | 6264.2 | 768 | 754 | 160.1 |
| A | 10 | 83 | 810048 | 5055.48 | 768 | 754 | 160.1 |
| B | 3 | 42 | 12000640 | 119402.21 | 517 | 504 | 100.5 |
| B | 3 | 25 | 975685 | 9703.12 | 517 | 504 | 100.5 |
| B | 5 | 235 | 397538 | 3950.52 | 517 | 504 | 100.5 |
| C | 15 | 174 | 6481797 | 96884.2 | 280 | 282 | 66.9 |
| C | 15 | 142 | 6403110 | 95708.0 | 280 | 282 | 66.9 |
| C | 15 | 158 | 2325970 | 34763.85 | 280 | 282 | 66.9 |
| D | 4 | 216 | 9797694 | 267969.55 | 75 | 70 | 36.6 |
| D | 4 | 201 | 1739588 | 47576.62 | 75 | 70 | 36.6 |
| D | 4 | 212 | 901217 | 24646.79 | 75 | 70 | 36.6 |
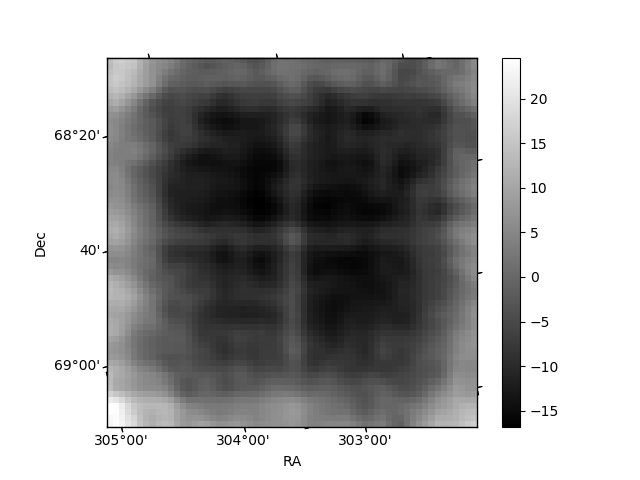
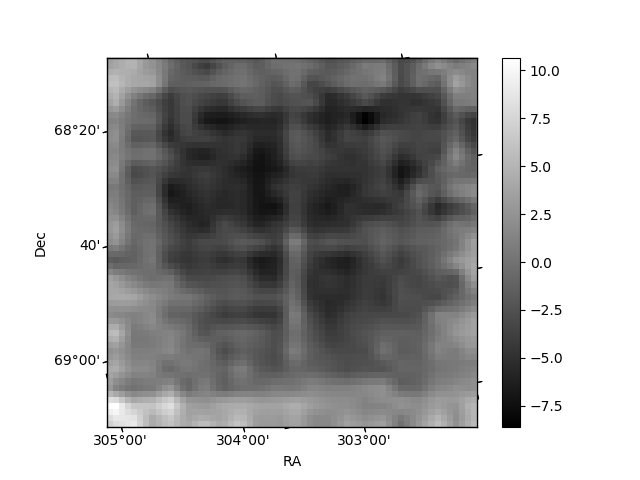
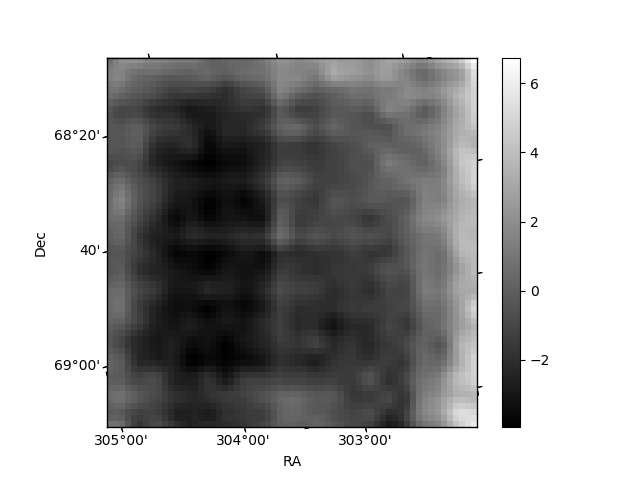
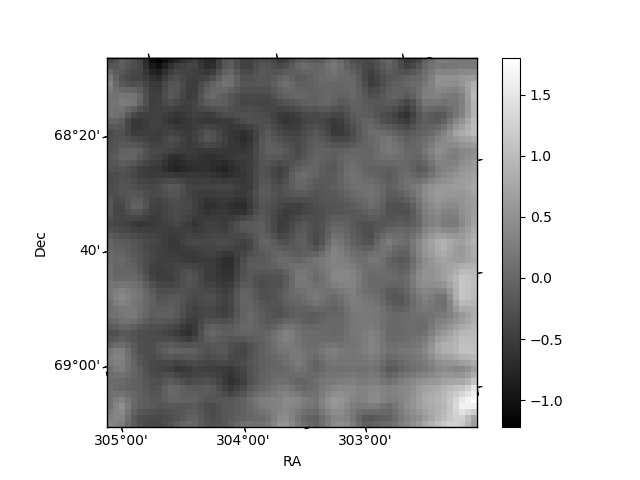
Histogram calculated using DETX and DETY for each event in the final _common_clean file
| Quadrant A | 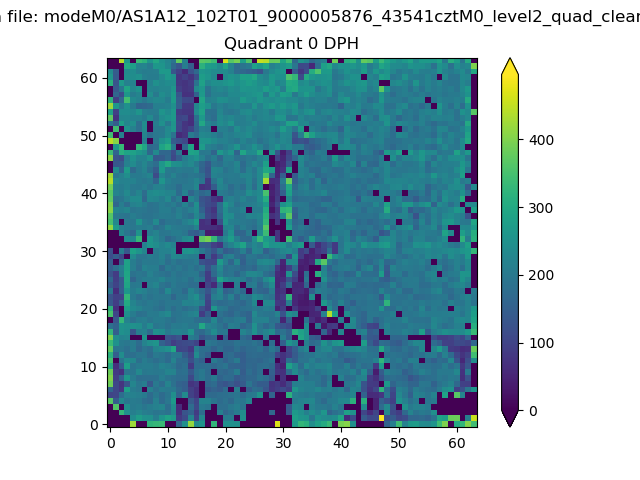 |
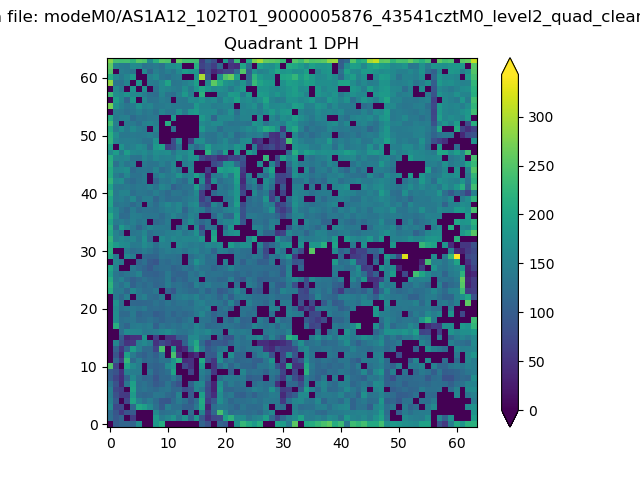 |
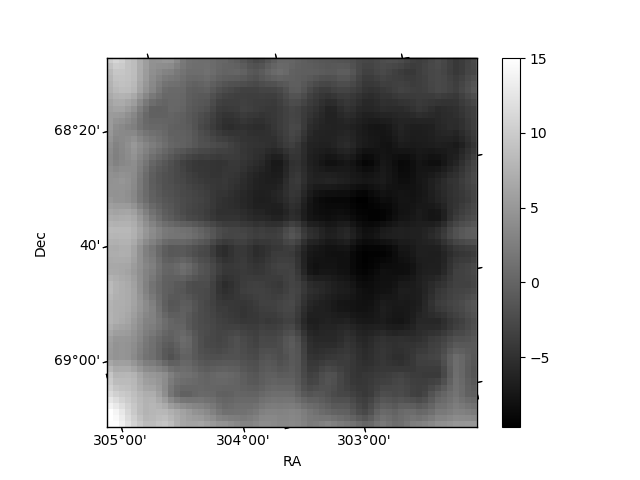
Quadrant B |
|---|---|---|---|
| Quadrant D | 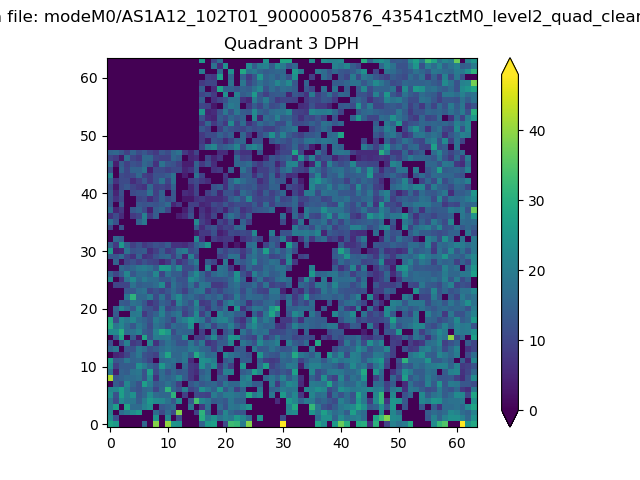 |
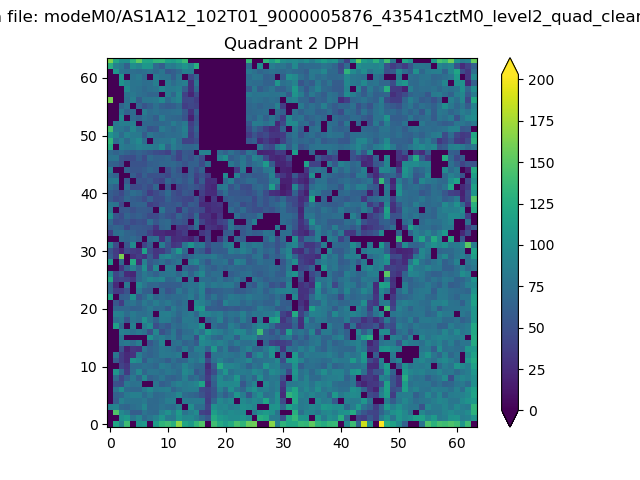 |
Quadrant C |
| Plot type | Count rate plots | Images |
|---|---|---|
| Comparison with Poisson distribution Blue bars denote a histogram of data divided into 1 sec bins. Red curve is a Poisson curve with rate = median count rate of data. |
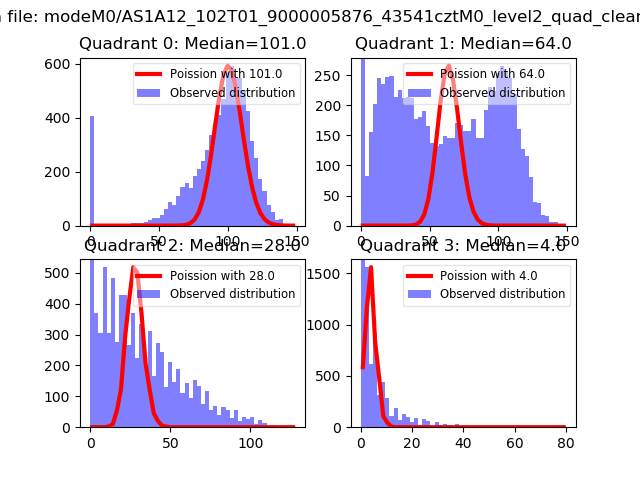 |
 |
| Quadrant-wise count rates Data is divided into 100 sec bins |
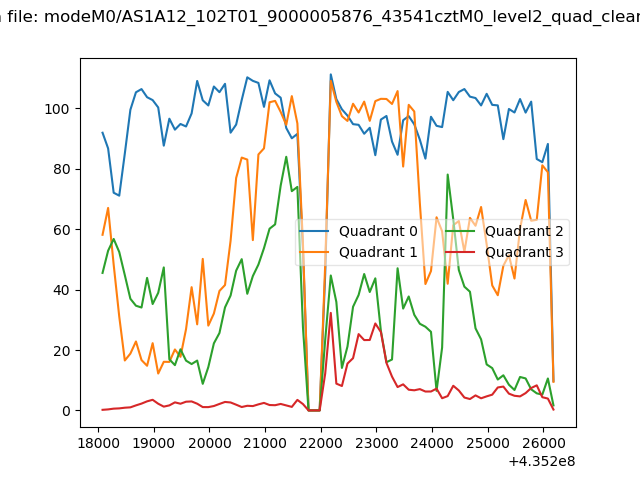 |
|
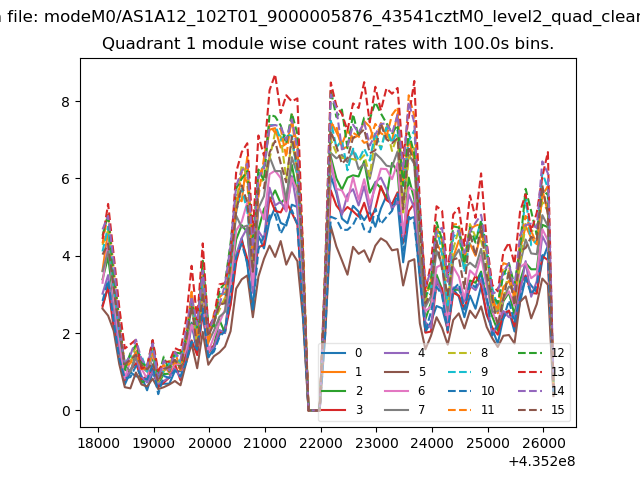
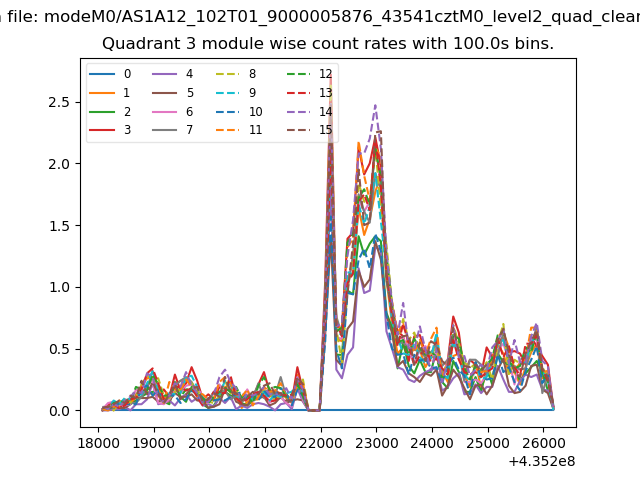
| Module-wise count rates for Quadrant A Data is divided into 100 sec bins |
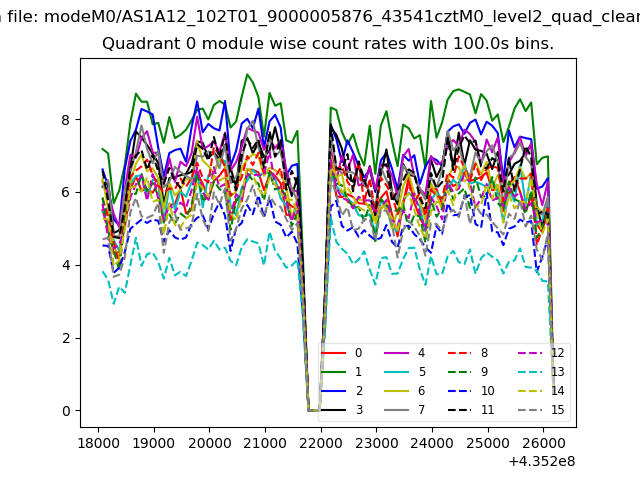 |
 |
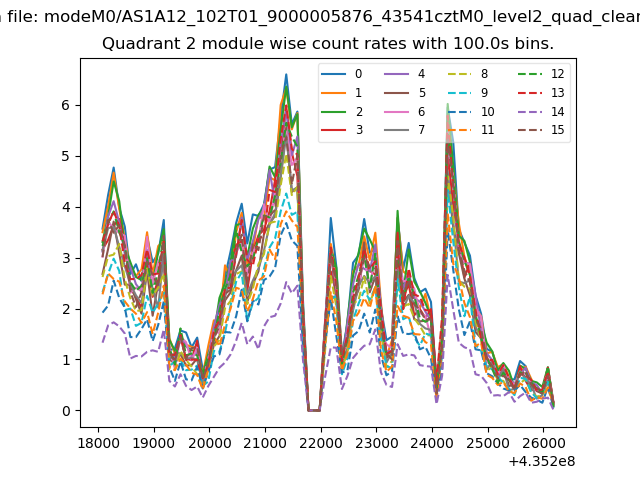
| Module-wise count rates for Quadrant B Data is divided into 100 sec bins |
 |
 |
| Module-wise count rates for Quadrant C Data is divided into 100 sec bins |
 |
 |
| Module-wise count rates for Quadrant D Data is divided into 100 sec bins |
 |
 |
| Parameter | Plot |
|---|---|
| CZT HV Monitor | 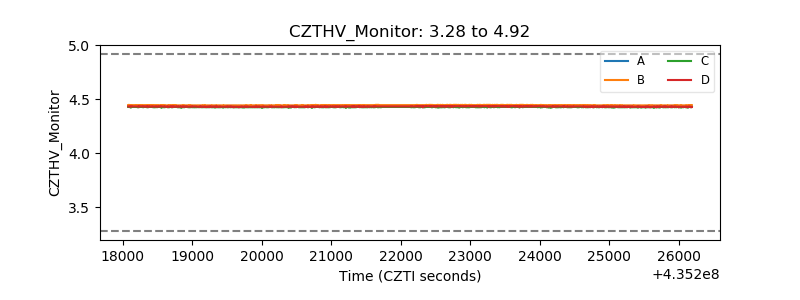 |
| D_VDD | 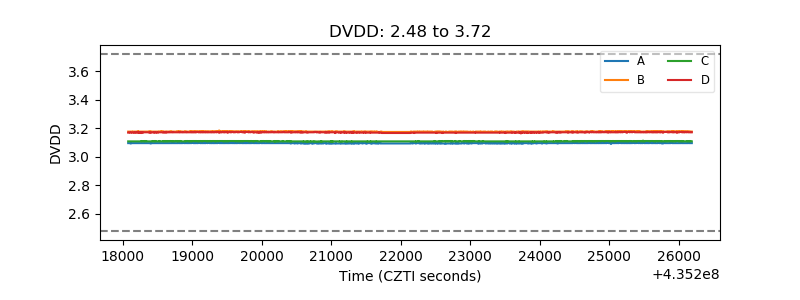 |
| Temperature 1 | 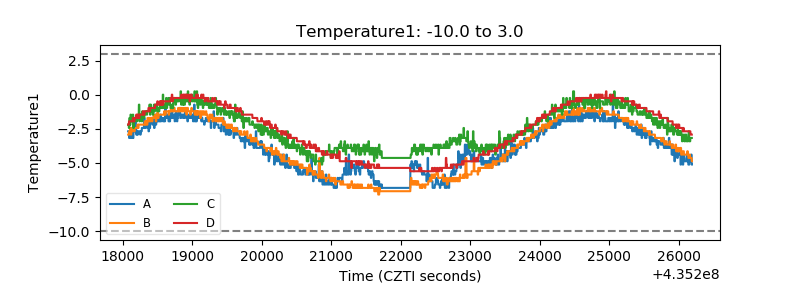 |
| Veto HV Monitor | 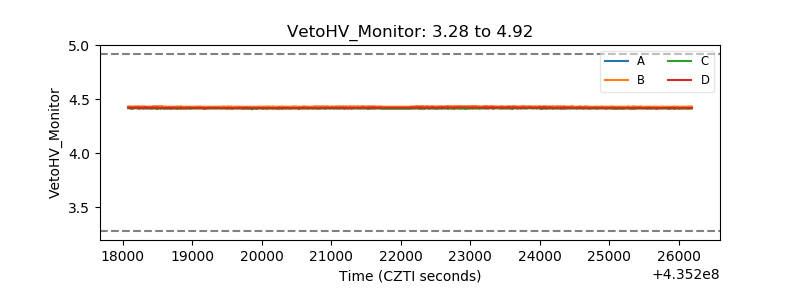 |
| Veto LLD | 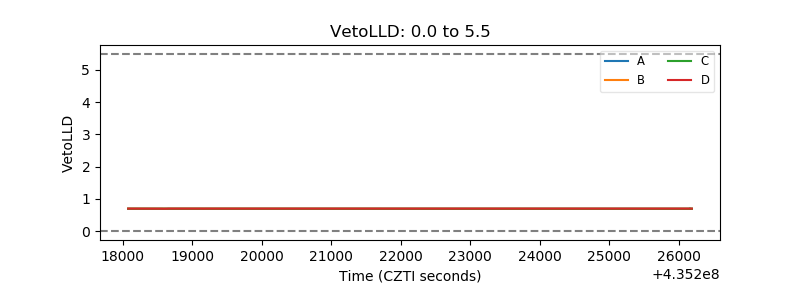 |
| Alpha Counter | 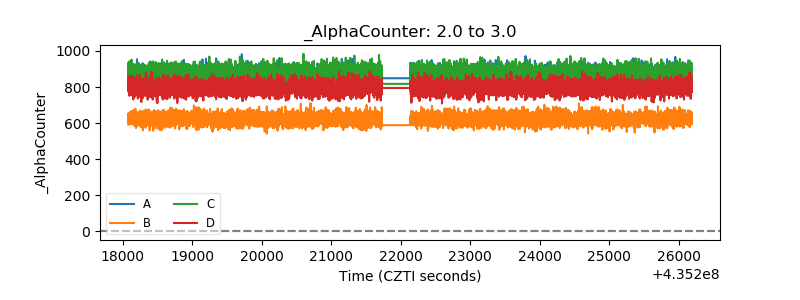 |
| _CPM_Rate |  |
| CZT Counter | 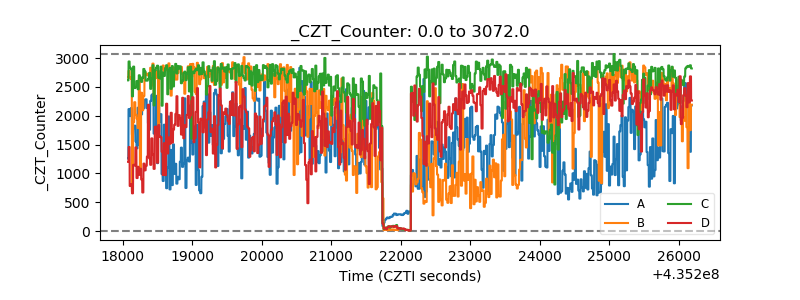 |
| +2.5 Volts monitor | 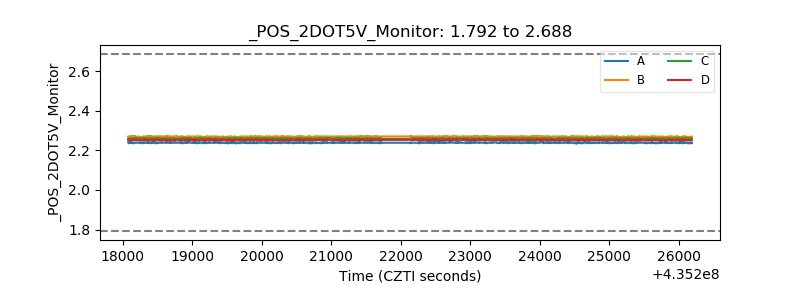 |
| +5 Volts monitor | 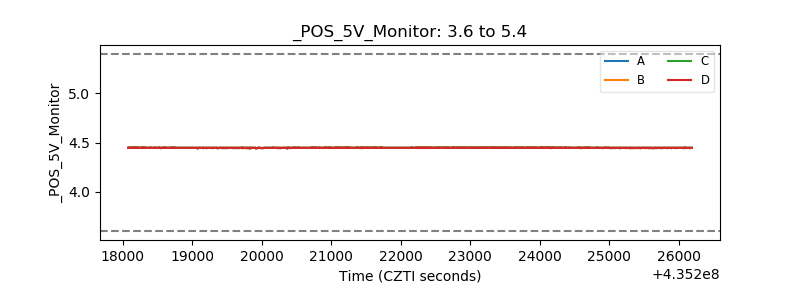 |
| _ROLL_ROT | 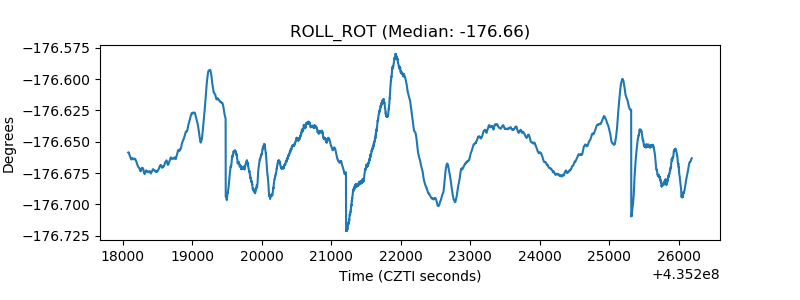 |
| _Roll_DEC | 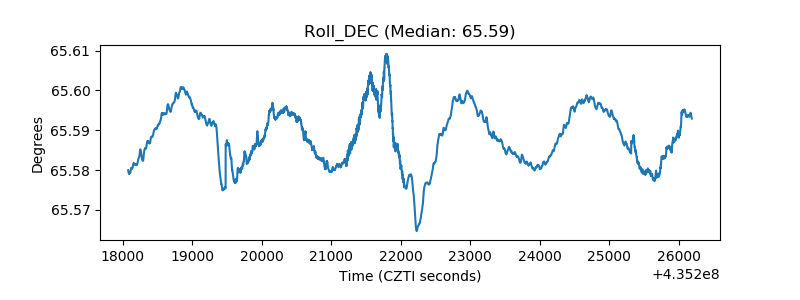 |
| _Roll_RA | 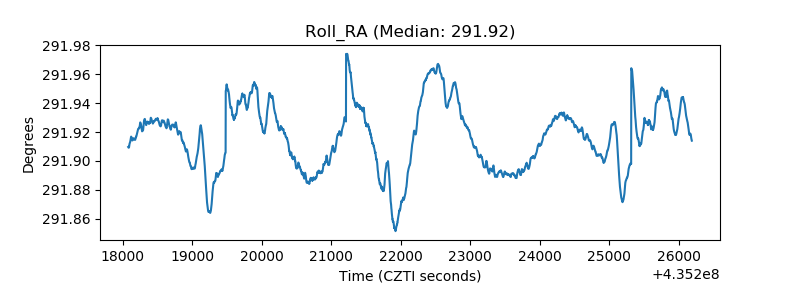 |
| Veto Counter | 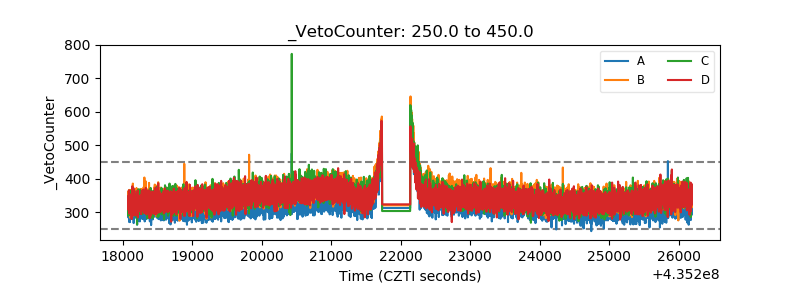 |