| Param | Original file | Final file |
|---|---|---|
| Filename | modeM0/AS1A05_174T01_9000005880_43544cztM0_level2.fits | modeM0/AS1A05_174T01_9000005880_43544cztM0_level2_quad_clean.evt |
| Size (bytes) | 1,135,739,520 | 70,980,480 |
| Size | 1.1 GB | 67.7 MB |
| Events in quadrant A | 7,245,410 | 725,041 |
| Events in quadrant B | 4,705,806 | 767,407 |
| Events in quadrant C | 16,946,076 | 85,294 |
| Events in quadrant D | 12,644,328 | 113,251 |
| Mode M9 | |||
|---|---|---|---|
| Quadrant | BADHDUFLAG | Total packets | Discarded packets |
| A | 0 | 11 | 0 |
| B | 0 | 11 | 0 |
| C | 0 | 11 | 0 |
| D | 0 | 11 | 0 |
| Mode M0 | |||
|---|---|---|---|
| Quadrant | BADHDUFLAG | Total packets | Discarded packets |
| A | 0 | 26197 | 1 |
| B | 0 | 18517 | 1 |
| C | 0 | 54845 | 1 |
| D | 0 | 42023 | 1 |
| Mode SS | |||
|---|---|---|---|
| Quadrant | BADHDUFLAG | Total packets | Discarded packets |
| A | 0 | 132 | 0 |
| B | 0 | 132 | 0 |
| C | 0 | 132 | 0 |
| D | 0 | 132 | 0 |
| Quadrant | Total seconds | Saturated seconds | Saturation percentage |
|---|---|---|---|
| A | 6471 | 813 | 12.563746% |
| B | 6472 | 231 | 3.569221% |
| C | 6472 | 6469 | 99.953646% |
| D | 6472 | 6472 | 100.000000% |
Noise dominated data is calculated using 1-second bins in cleaned event files. If a bin has >2000 counts, and if more than 50% of those come from <1% of pixels, then it is considered to be noise-dominated and hence unusable.
| Quadrant | # 1 sec bins | Bins with >0 counts | Bins with >2000 counts | High rate bins dominated by noise | Noise dominated (total time) | Noise dominated (detector-on time) | Marked lightcurve |
|---|---|---|---|---|---|---|---|
| A | 7551 | 6471 | 372 | 372 | 4.93% | 5.75% | 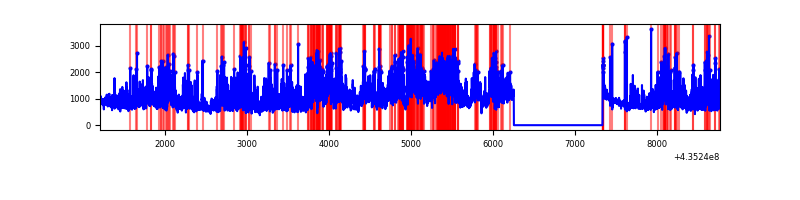 |
| B | 7552 | 6472 | 121 | 121 | 1.60% | 1.87% | 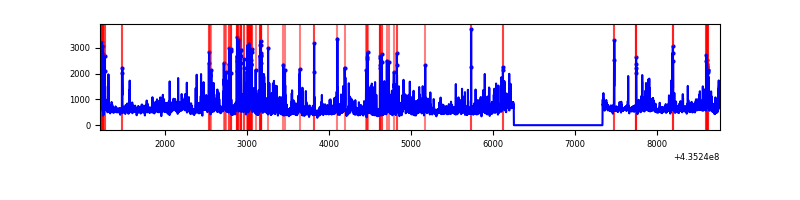 |
| C | 7551 | 6471 | 6148 | 6148 | 81.42% | 95.01% | 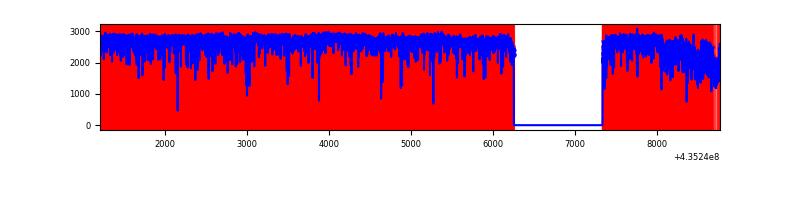 |
| D | 7551 | 6471 | 3651 | 3651 | 48.35% | 56.42% | 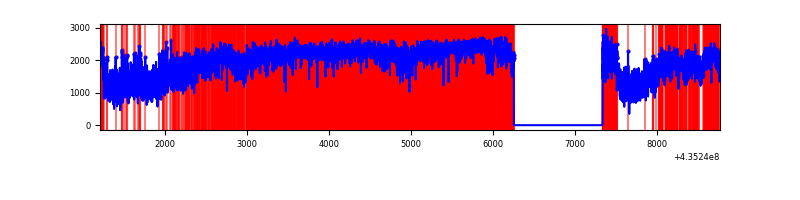 |
Top three noisy pixels from each quadrant. If the there are fewer than three noisy pixels in the level2.evt file, extra rows are filled as -1
| Pixel properties | Quadrant properties | ||||||
|---|---|---|---|---|---|---|---|
| Quadrant | DetID | PixID | Counts | Sigma | Mean | Median | Sigma |
| A | 0 | 228 | 3038696 | 19809.4 | 738 | 724 | 153.4 |
| A | 10 | 83 | 745550 | 4856.71 | 738 | 724 | 153.4 |
| A | 0 | 226 | 159445 | 1034.96 | 738 | 724 | 153.4 |
| B | 3 | 42 | 622588 | 4193.1 | 754 | 733 | 148.3 |
| B | 3 | 25 | 363419 | 2445.55 | 754 | 733 | 148.3 |
| B | 0 | 230 | 113782 | 762.28 | 754 | 733 | 148.3 |
| C | 15 | 174 | 9605145 | 385288.22 | 101 | 101 | 24.9 |
| C | 15 | 142 | 4834337 | 193916.26 | 101 | 101 | 24.9 |
| C | 15 | 126 | 1193210 | 47859.32 | 101 | 101 | 24.9 |
| D | 4 | 216 | 5077488 | 101475.22 | 146 | 138 | 50.0 |
| D | 4 | 212 | 2519470 | 50351.02 | 146 | 138 | 50.0 |
| D | 14 | 210 | 589336 | 11775.63 | 146 | 138 | 50.0 |
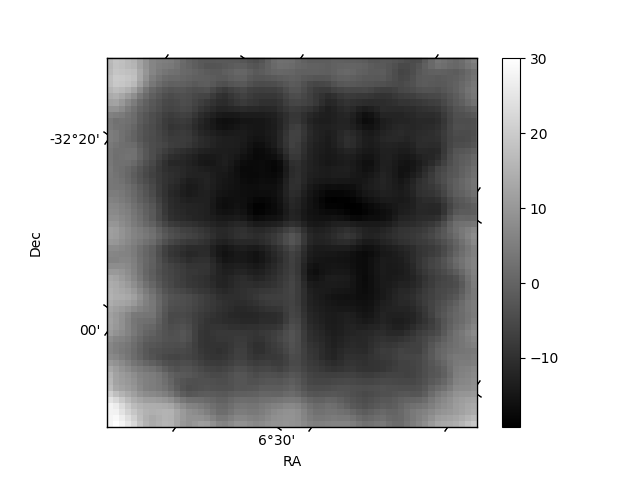
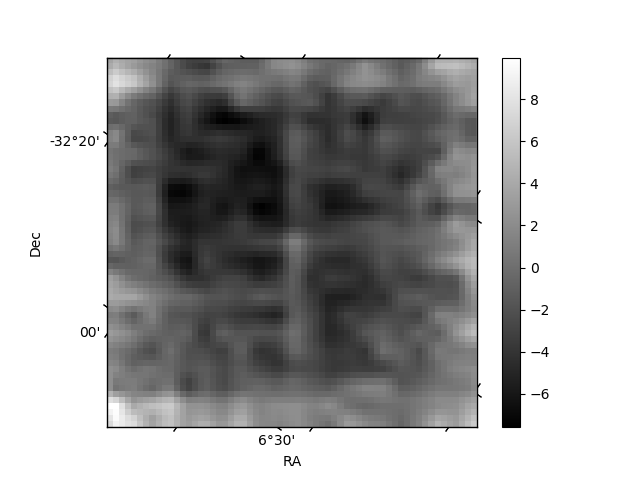
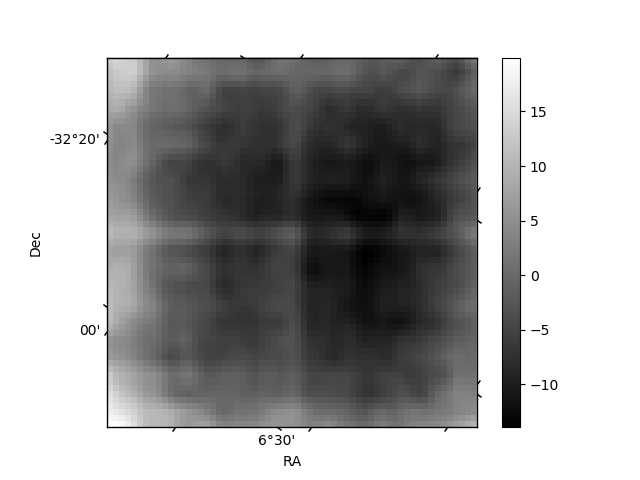
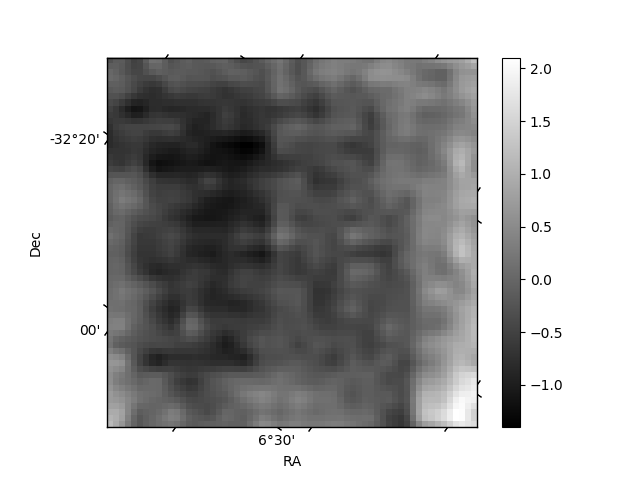
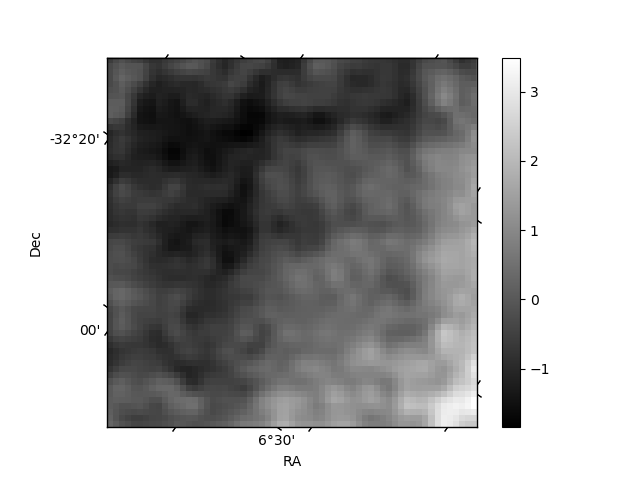
Histogram calculated using DETX and DETY for each event in the final _common_clean file
| Quadrant A | 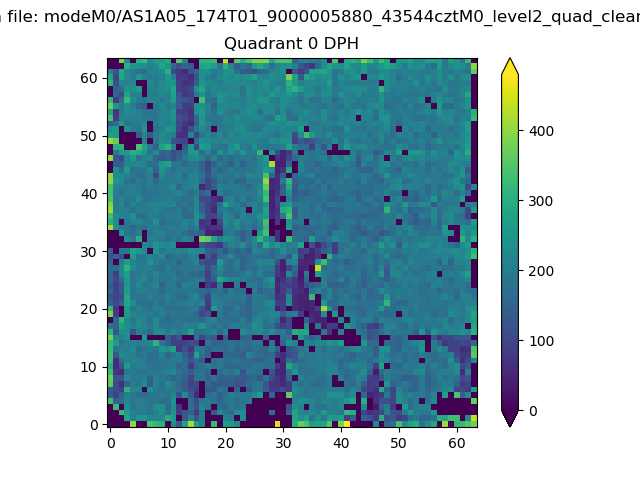 |
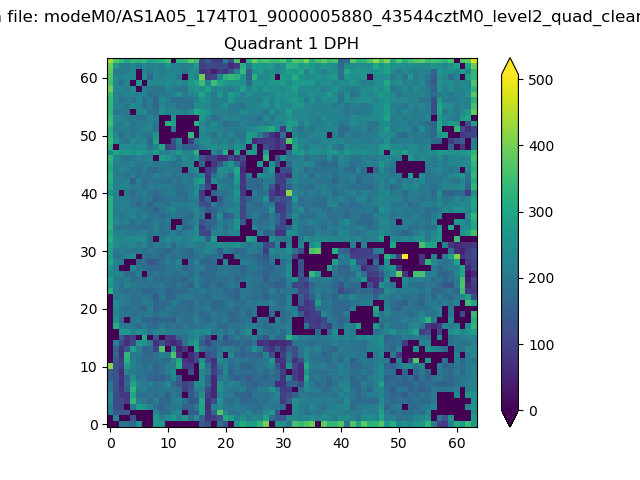 |
Quadrant B |
|---|---|---|---|
| Quadrant D | 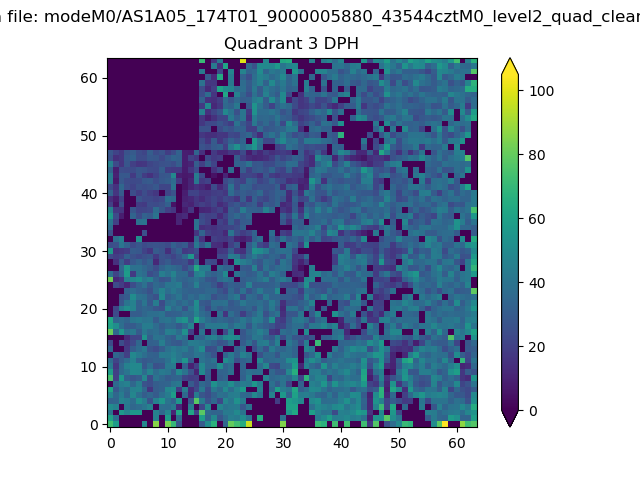 |
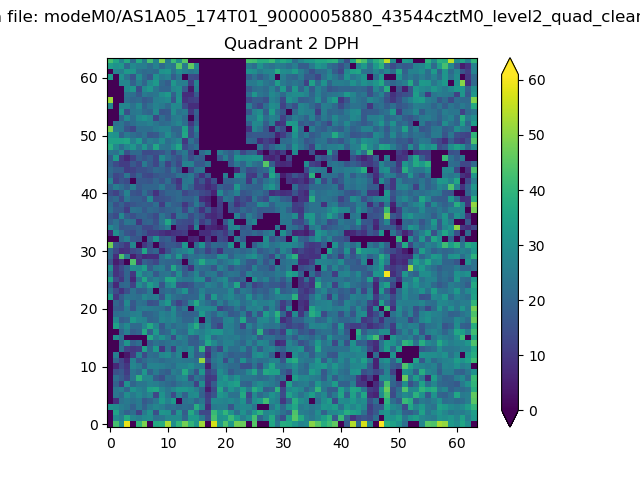 |
Quadrant C |
| Plot type | Count rate plots | Images |
|---|---|---|
| Comparison with Poisson distribution Blue bars denote a histogram of data divided into 1 sec bins. Red curve is a Poisson curve with rate = median count rate of data. |
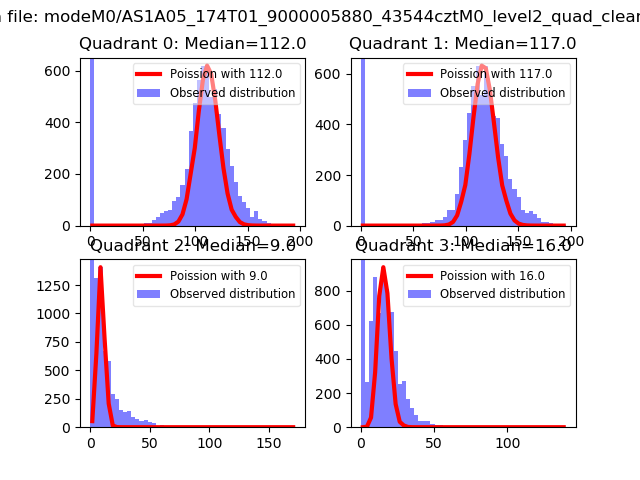 |
 |
| Quadrant-wise count rates Data is divided into 100 sec bins |
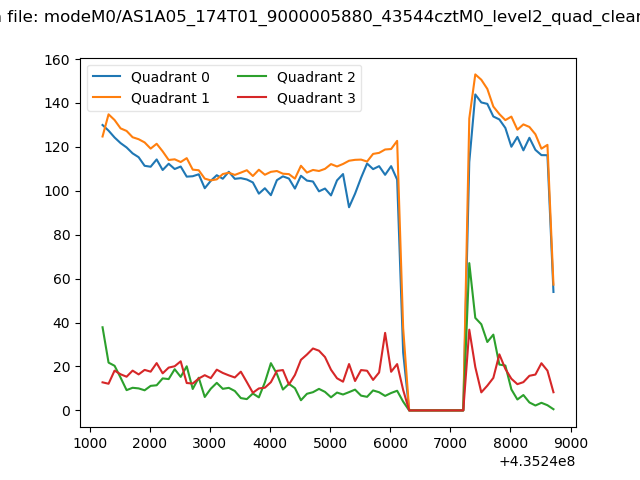 |
|
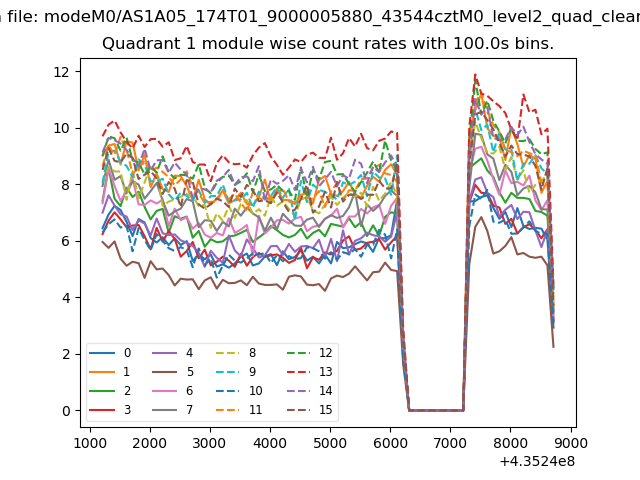
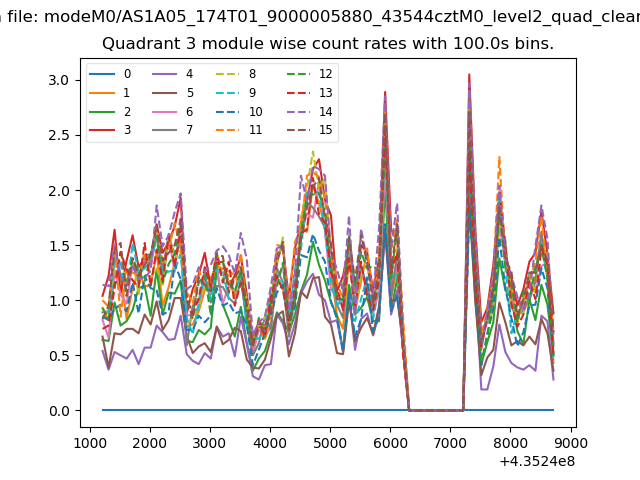
| Module-wise count rates for Quadrant A Data is divided into 100 sec bins |
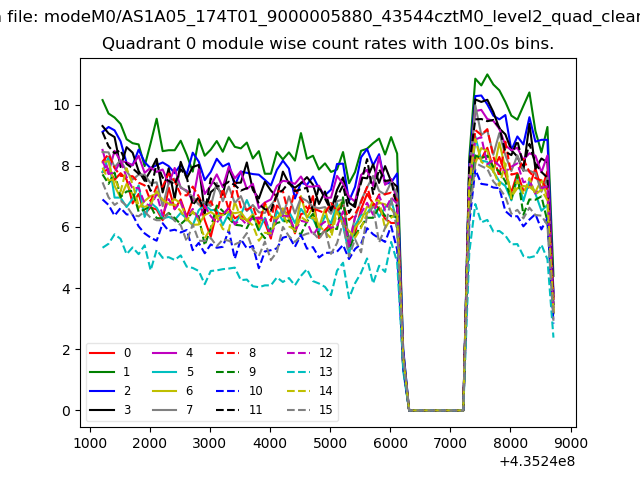 |
 |
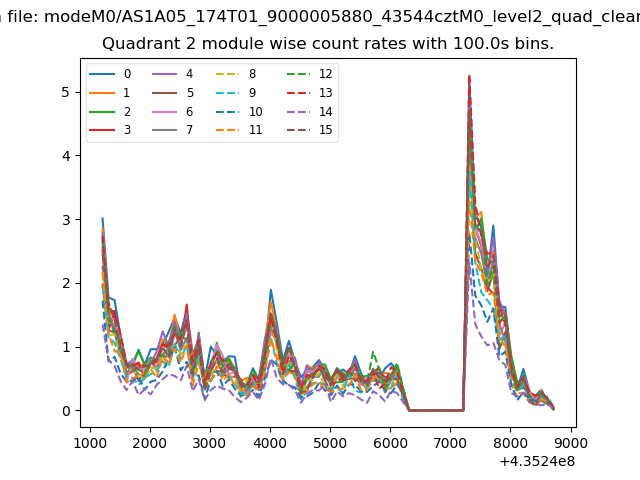
| Module-wise count rates for Quadrant B Data is divided into 100 sec bins |
 |
 |
| Module-wise count rates for Quadrant C Data is divided into 100 sec bins |
 |
 |
| Module-wise count rates for Quadrant D Data is divided into 100 sec bins |
 |
 |
| Parameter | Plot |
|---|---|
| CZT HV Monitor | 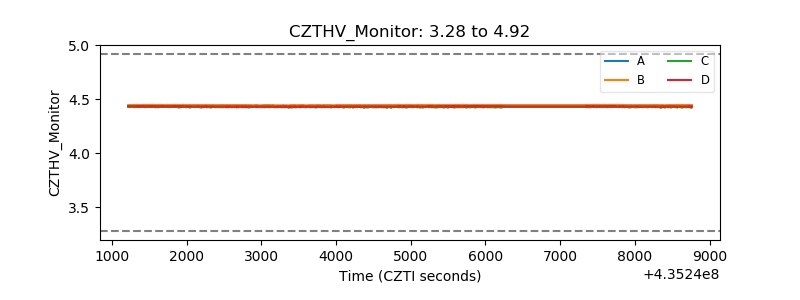 |
| D_VDD | 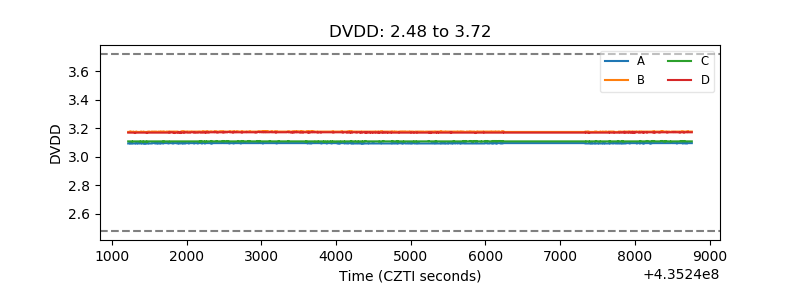 |
| Temperature 1 | 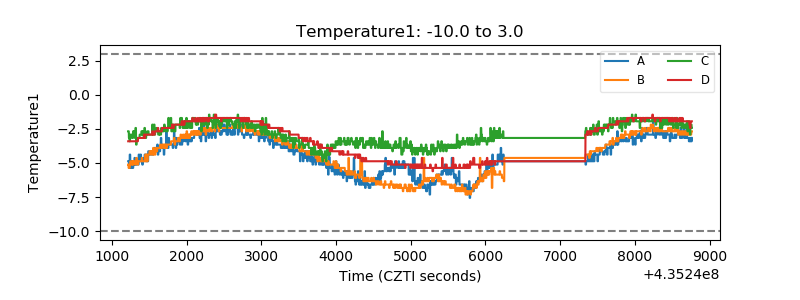 |
| Veto HV Monitor | 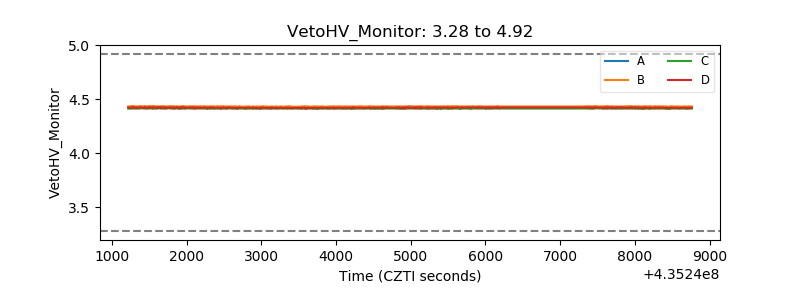 |
| Veto LLD | 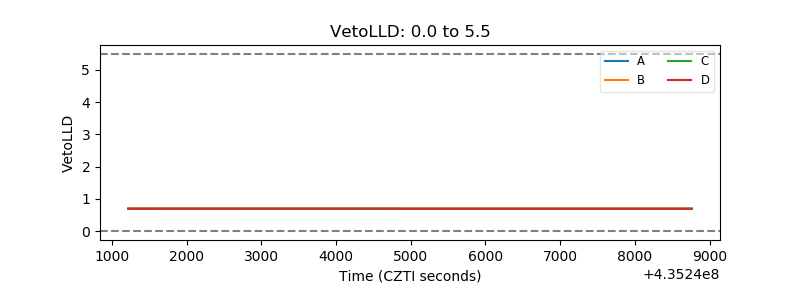 |
| Alpha Counter | 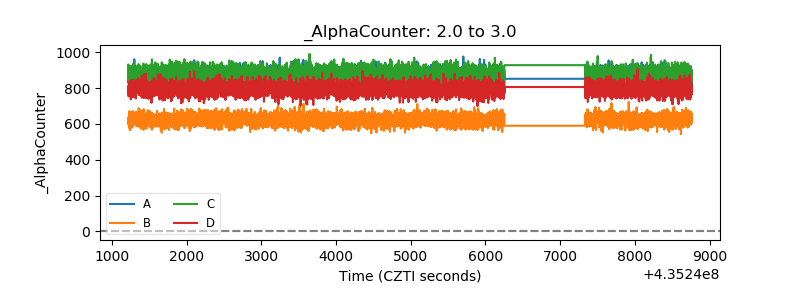 |
| _CPM_Rate | 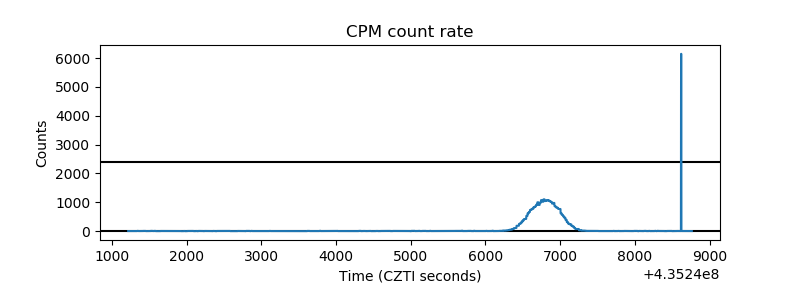 |
| CZT Counter | 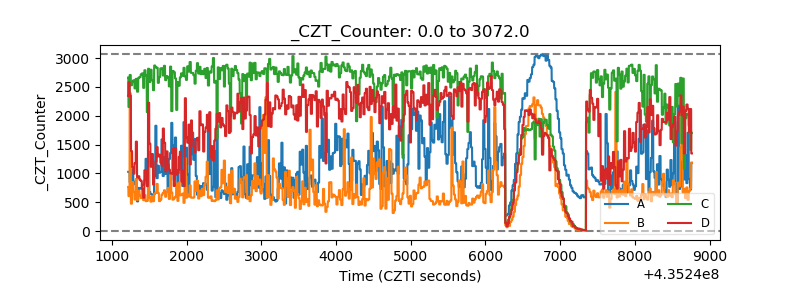 |
| +2.5 Volts monitor | 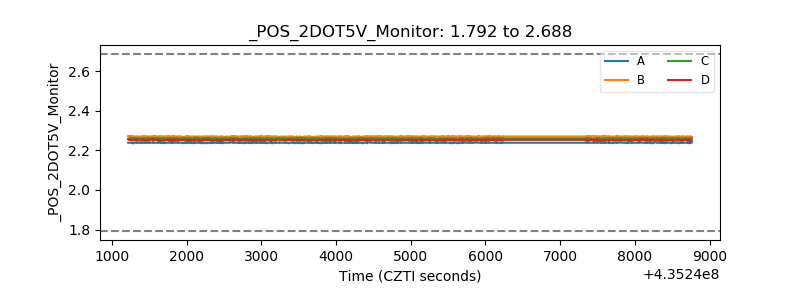 |
| +5 Volts monitor | 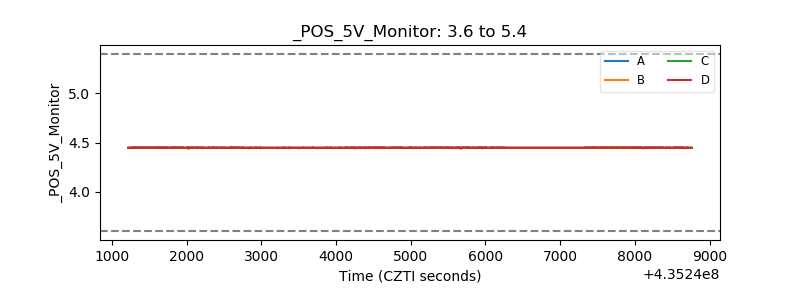 |
| _ROLL_ROT |  |
| _Roll_DEC | 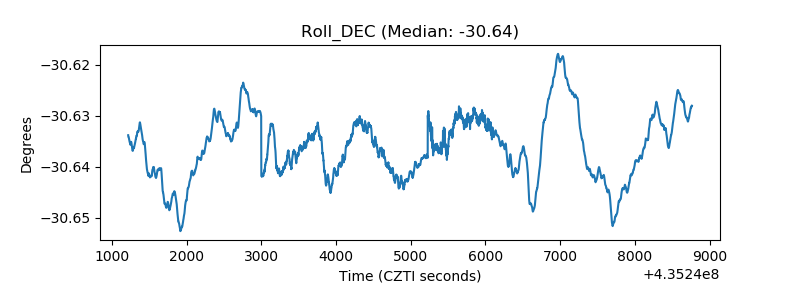 |
| _Roll_RA | 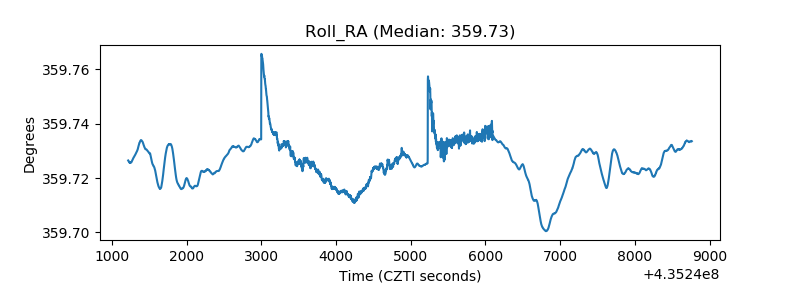 |
| Veto Counter | 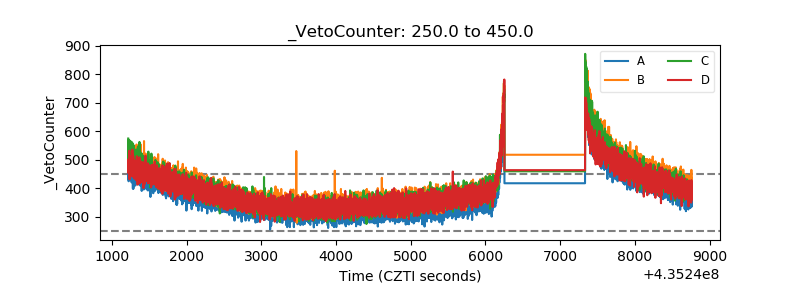 |