| Param | Original file | Final file |
|---|---|---|
| Filename | modeM0/AS1A05_174T01_9000005880_43545cztM0_level2.fits | modeM0/AS1A05_174T01_9000005880_43545cztM0_level2_quad_clean.evt |
| Size (bytes) | 1,083,772,800 | 72,999,360 |
| Size | 1.0 GB | 69.6 MB |
| Events in quadrant A | 7,565,018 | 729,243 |
| Events in quadrant B | 4,613,627 | 776,405 |
| Events in quadrant C | 14,539,993 | 110,358 |
| Events in quadrant D | 12,912,136 | 148,594 |
| Mode M9 | |||
|---|---|---|---|
| Quadrant | BADHDUFLAG | Total packets | Discarded packets |
| A | 0 | 12 | 0 |
| B | 0 | 12 | 0 |
| C | 0 | 12 | 0 |
| D | 0 | 12 | 0 |
| Mode M0 | |||
|---|---|---|---|
| Quadrant | BADHDUFLAG | Total packets | Discarded packets |
| A | 0 | 26983 | 1 |
| B | 0 | 18039 | 1 |
| C | 0 | 47492 | 5 |
| D | 0 | 42698 | 1 |
| Mode SS | |||
|---|---|---|---|
| Quadrant | BADHDUFLAG | Total packets | Discarded packets |
| A | 0 | 128 | 0 |
| B | 0 | 128 | 0 |
| C | 0 | 128 | 0 |
| D | 0 | 128 | 0 |
| Quadrant | Total seconds | Saturated seconds | Saturation percentage |
|---|---|---|---|
| A | 6296 | 950 | 15.088945% |
| B | 6296 | 191 | 3.033672% |
| C | 6295 | 6232 | 98.999206% |
| D | 6295 | 6263 | 99.491660% |
Noise dominated data is calculated using 1-second bins in cleaned event files. If a bin has >2000 counts, and if more than 50% of those come from <1% of pixels, then it is considered to be noise-dominated and hence unusable.
| Quadrant | # 1 sec bins | Bins with >0 counts | Bins with >2000 counts | High rate bins dominated by noise | Noise dominated (total time) | Noise dominated (detector-on time) | Marked lightcurve |
|---|---|---|---|---|---|---|---|
| A | 7486 | 6296 | 421 | 421 | 5.62% | 6.69% | 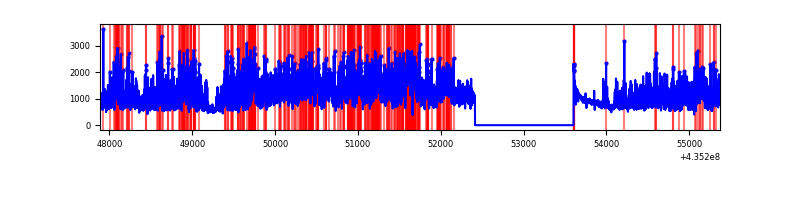 |
| B | 7486 | 6297 | 98 | 98 | 1.31% | 1.56% | 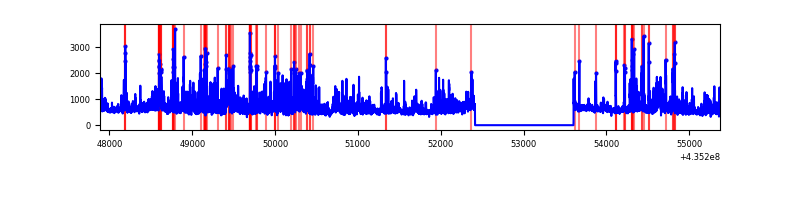 |
| C | 7484 | 6294 | 4873 | 4873 | 65.11% | 77.42% | 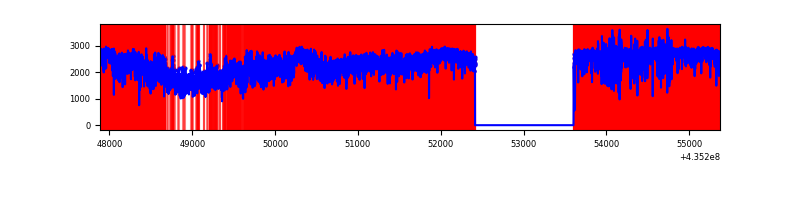 |
| D | 7484 | 6294 | 3932 | 3932 | 52.54% | 62.47% | 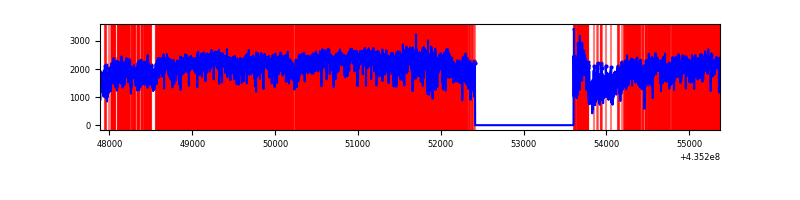 |
Top three noisy pixels from each quadrant. If the there are fewer than three noisy pixels in the level2.evt file, extra rows are filled as -1
| Pixel properties | Quadrant properties | ||||||
|---|---|---|---|---|---|---|---|
| Quadrant | DetID | PixID | Counts | Sigma | Mean | Median | Sigma |
| A | 0 | 228 | 3592104 | 24361.74 | 720 | 708 | 147.4 |
| A | 10 | 83 | 691823 | 4688.08 | 720 | 708 | 147.4 |
| A | 0 | 226 | 189390 | 1279.9 | 720 | 708 | 147.4 |
| B | 3 | 42 | 849195 | 5936.98 | 736 | 718 | 142.9 |
| B | 3 | 25 | 344505 | 2405.55 | 736 | 718 | 142.9 |
| B | 12 | 5 | 98672 | 685.41 | 736 | 718 | 142.9 |
| C | 15 | 126 | 6089618 | 212563.16 | 117 | 118 | 28.6 |
| C | 15 | 174 | 4474439 | 156182.9 | 117 | 118 | 28.6 |
| C | 15 | 142 | 2971740 | 103728.94 | 117 | 118 | 28.6 |
| D | 4 | 216 | 5382801 | 84813.8 | 184 | 175 | 63.5 |
| D | 4 | 212 | 2072915 | 32660.07 | 184 | 175 | 63.5 |
| D | 4 | 201 | 760021 | 11972.86 | 184 | 175 | 63.5 |
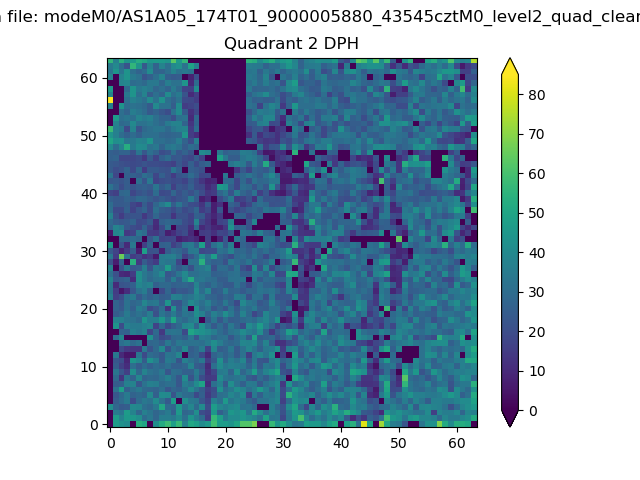
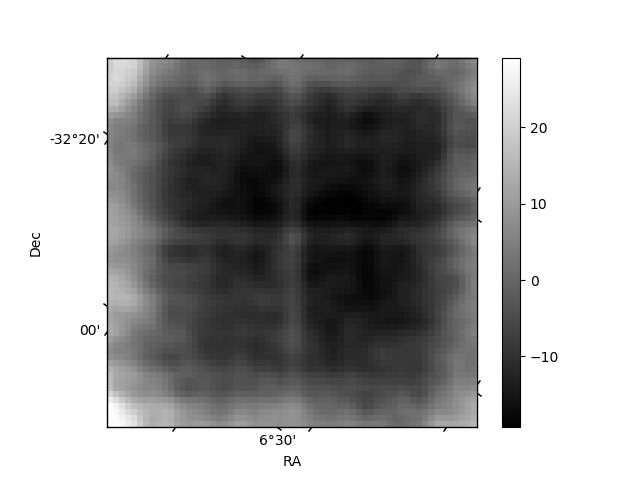
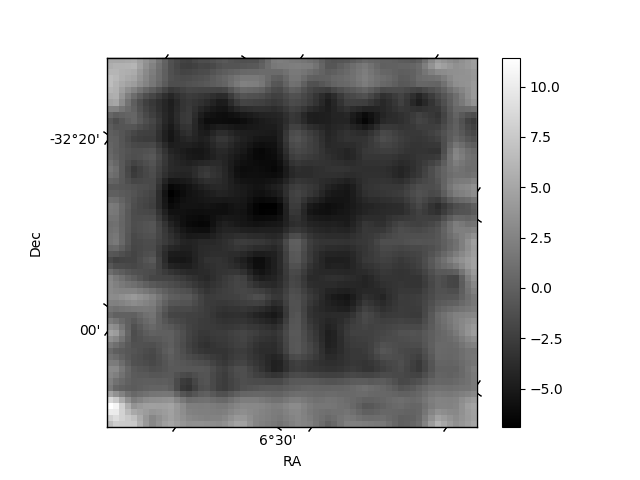
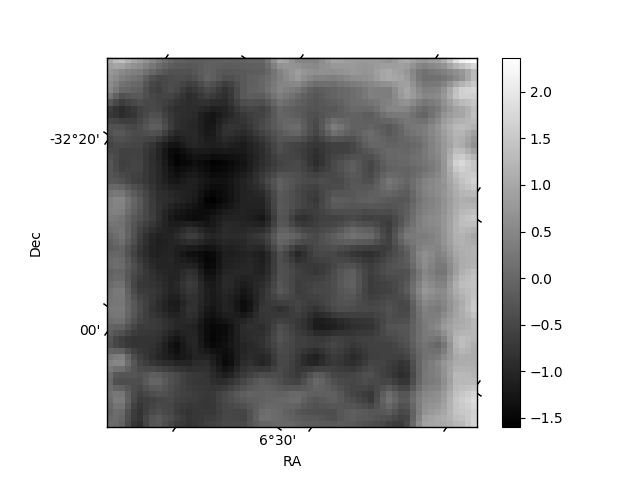
Histogram calculated using DETX and DETY for each event in the final _common_clean file
| Quadrant A | 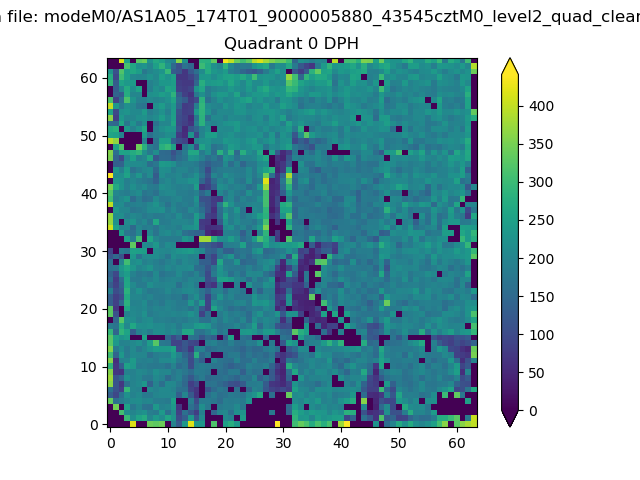 |
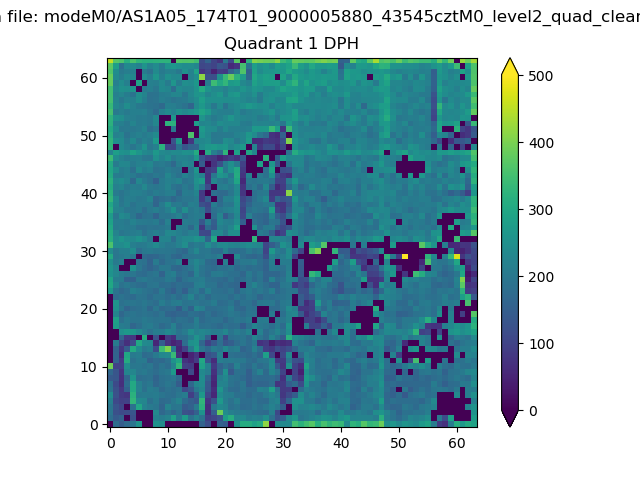 |
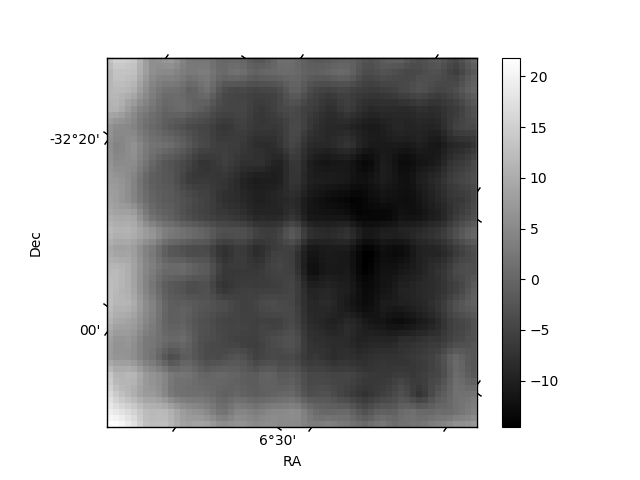
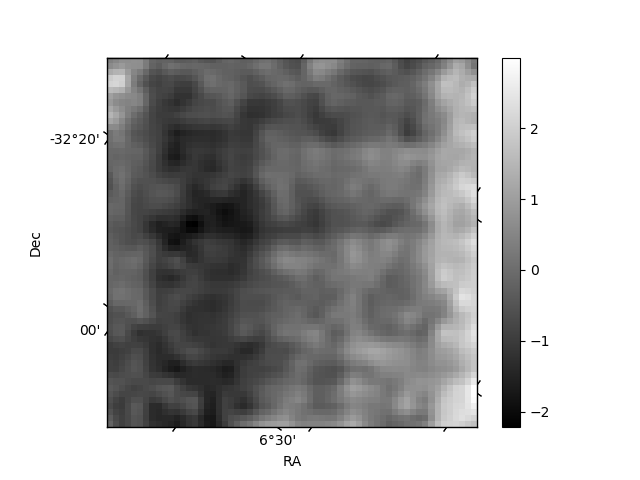
Quadrant B |
|---|---|---|---|
| Quadrant D | 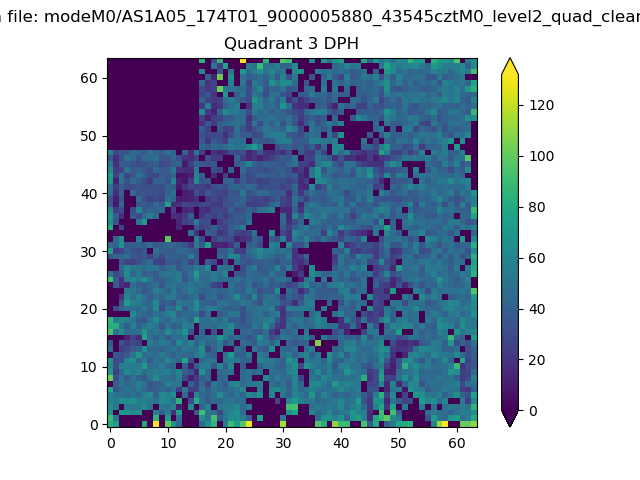 |
 |
Quadrant C |
| Plot type | Count rate plots | Images |
|---|---|---|
| Comparison with Poisson distribution Blue bars denote a histogram of data divided into 1 sec bins. Red curve is a Poisson curve with rate = median count rate of data. |
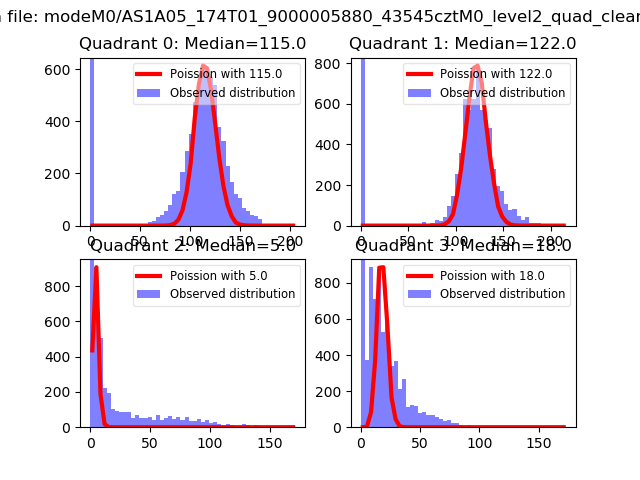 |
 |
| Quadrant-wise count rates Data is divided into 100 sec bins |
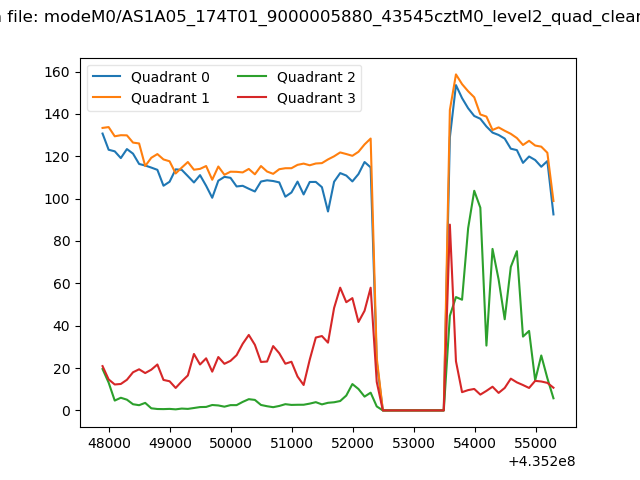 |
|
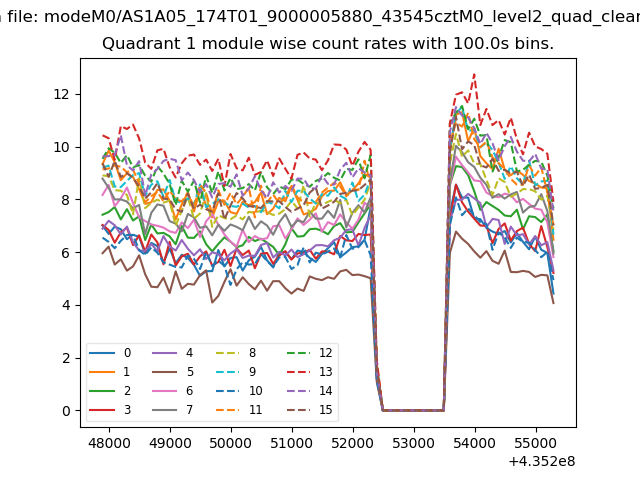
| Module-wise count rates for Quadrant A Data is divided into 100 sec bins |
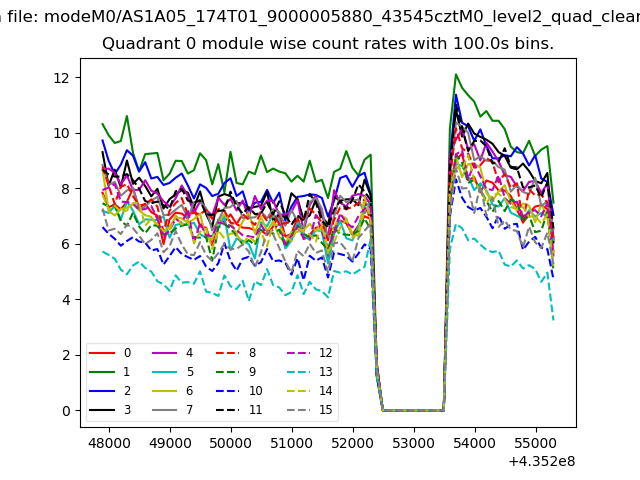 |
 |
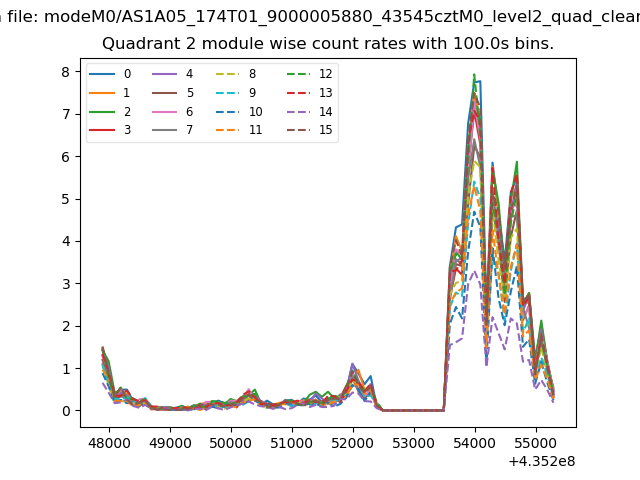
| Module-wise count rates for Quadrant B Data is divided into 100 sec bins |
 |
 |
| Module-wise count rates for Quadrant C Data is divided into 100 sec bins |
 |
 |
| Module-wise count rates for Quadrant D Data is divided into 100 sec bins |
 |
 |
| Parameter | Plot |
|---|---|
| CZT HV Monitor | 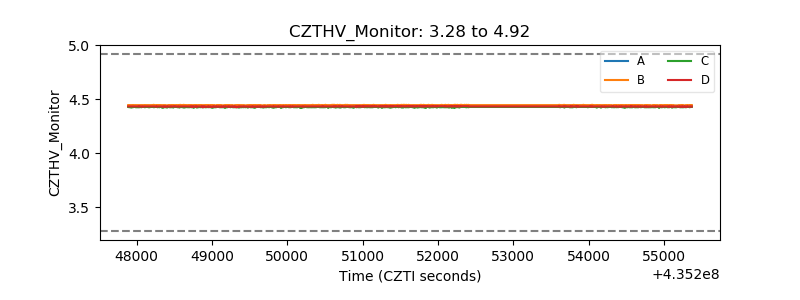 |
| D_VDD | 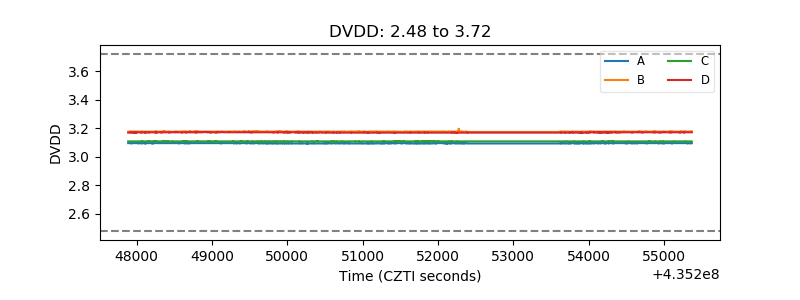 |
| Temperature 1 | 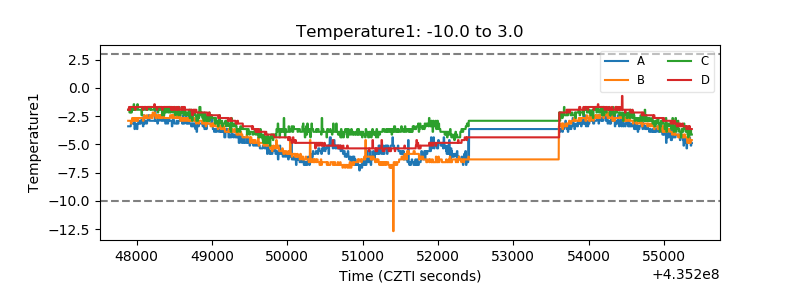 |
| Veto HV Monitor |  |
| Veto LLD | 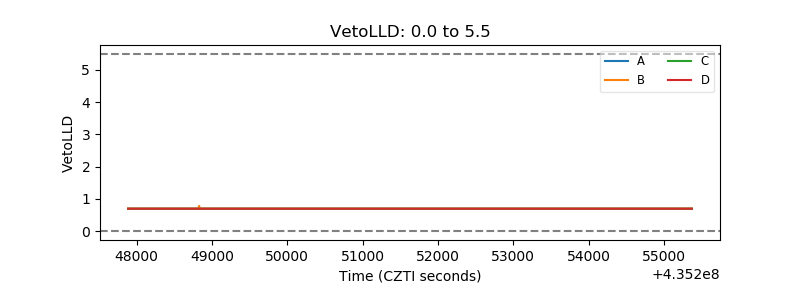 |
| Alpha Counter | 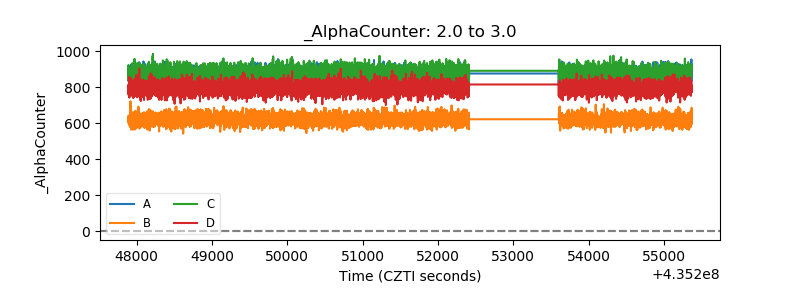 |
| _CPM_Rate | 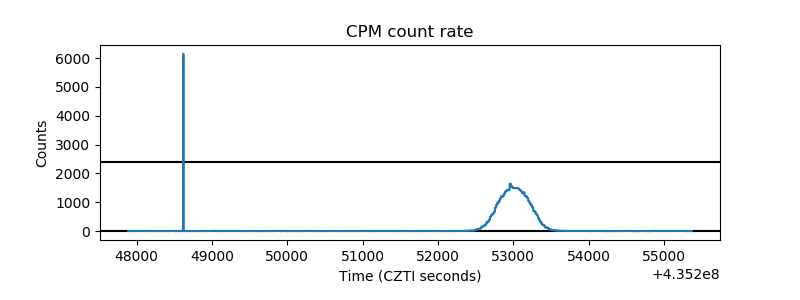 |
| CZT Counter | 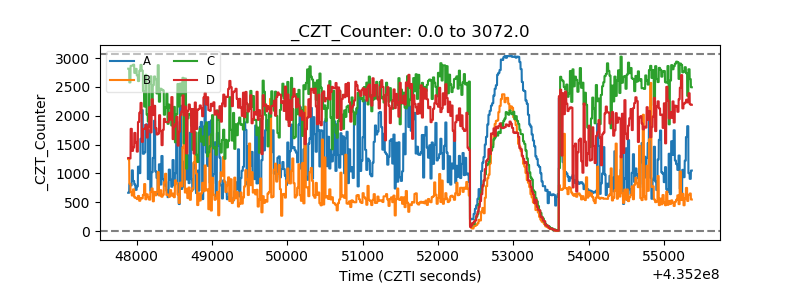 |
| +2.5 Volts monitor | 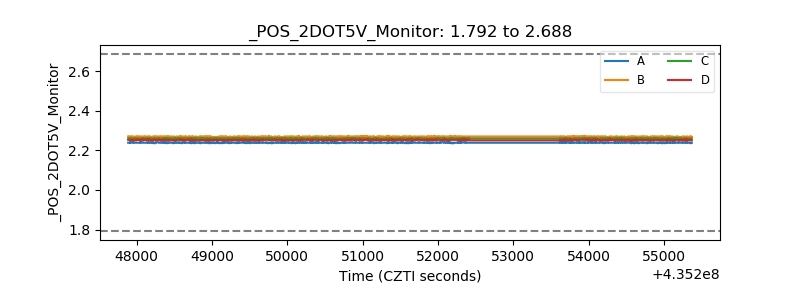 |
| +5 Volts monitor | 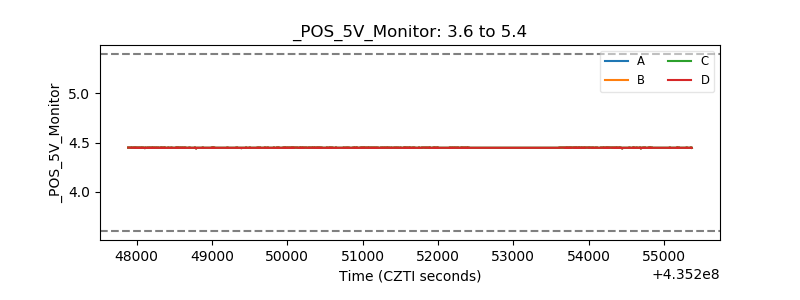 |
| _ROLL_ROT |  |
| _Roll_DEC | 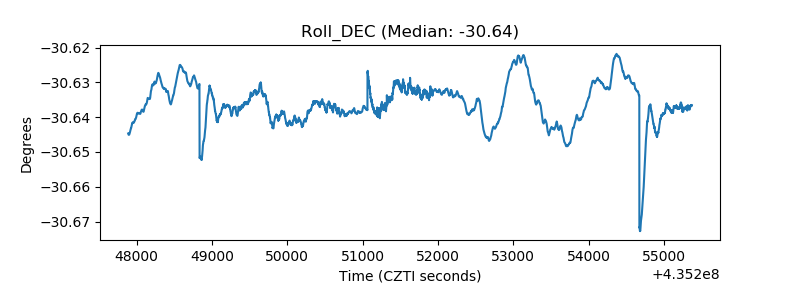 |
| _Roll_RA | 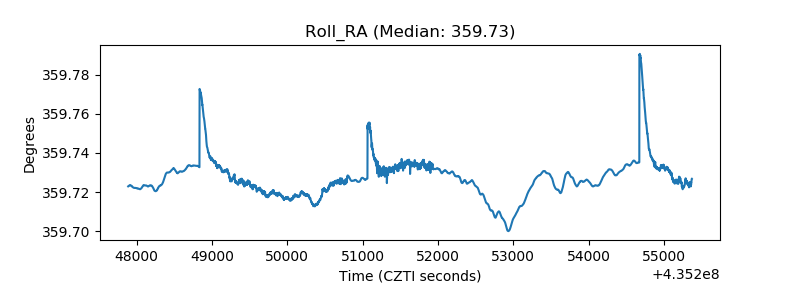 |
| Veto Counter | 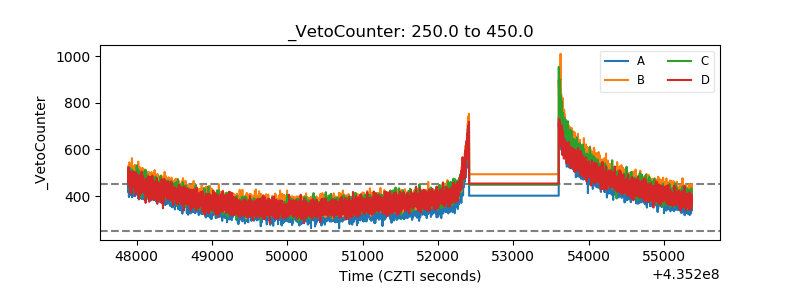 |