| Param | Original file | Final file |
|---|---|---|
| Filename | modeM0/AS1A05_174T01_9000005880_43546cztM0_level2.fits | modeM0/AS1A05_174T01_9000005880_43546cztM0_level2_quad_clean.evt |
| Size (bytes) | 962,861,760 | 65,332,800 |
| Size | 918.3 MB | 62.3 MB |
| Events in quadrant A | 5,521,302 | 667,154 |
| Events in quadrant B | 3,488,266 | 703,202 |
| Events in quadrant C | 13,998,765 | 129,141 |
| Events in quadrant D | 12,198,740 | 80,405 |
| Mode M9 | |||
|---|---|---|---|
| Quadrant | BADHDUFLAG | Total packets | Discarded packets |
| A | 0 | 12 | 0 |
| B | 0 | 12 | 0 |
| C | 0 | 12 | 0 |
| D | 0 | 12 | 0 |
| Mode M0 | |||
|---|---|---|---|
| Quadrant | BADHDUFLAG | Total packets | Discarded packets |
| A | 0 | 20562 | 1 |
| B | 0 | 14029 | 1 |
| C | 0 | 45394 | 4 |
| D | 0 | 40065 | 1 |
| Mode SS | |||
|---|---|---|---|
| Quadrant | BADHDUFLAG | Total packets | Discarded packets |
| A | 0 | 114 | 0 |
| B | 0 | 114 | 0 |
| C | 0 | 114 | 0 |
| D | 0 | 114 | 0 |
| Quadrant | Total seconds | Saturated seconds | Saturation percentage |
|---|---|---|---|
| A | 5619 | 325 | 5.783947% |
| B | 5620 | 157 | 2.793594% |
| C | 5619 | 5478 | 97.490657% |
| D | 5619 | 5611 | 99.857626% |
Noise dominated data is calculated using 1-second bins in cleaned event files. If a bin has >2000 counts, and if more than 50% of those come from <1% of pixels, then it is considered to be noise-dominated and hence unusable.
| Quadrant | # 1 sec bins | Bins with >0 counts | Bins with >2000 counts | High rate bins dominated by noise | Noise dominated (total time) | Noise dominated (detector-on time) | Marked lightcurve |
|---|---|---|---|---|---|---|---|
| A | 6829 | 5619 | 83 | 83 | 1.22% | 1.48% | 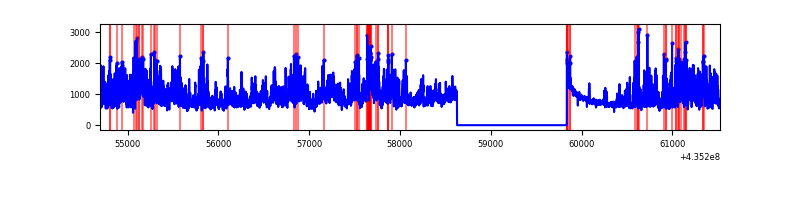 |
| B | 6830 | 5621 | 47 | 47 | 0.69% | 0.84% | 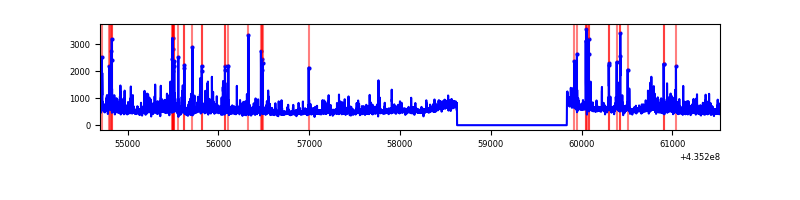 |
| C | 6828 | 5618 | 5135 | 5135 | 75.21% | 91.40% | 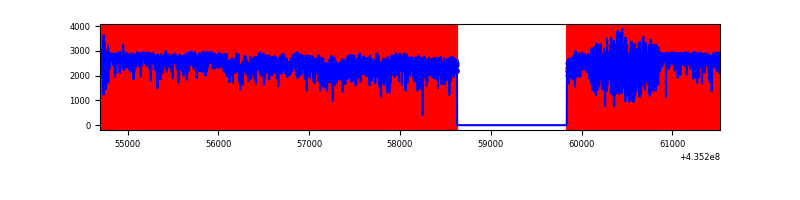 |
| D | 6828 | 5618 | 4246 | 4246 | 62.19% | 75.58% |  |
Top three noisy pixels from each quadrant. If the there are fewer than three noisy pixels in the level2.evt file, extra rows are filled as -1
| Pixel properties | Quadrant properties | ||||||
|---|---|---|---|---|---|---|---|
| Quadrant | DetID | PixID | Counts | Sigma | Mean | Median | Sigma |
| A | 0 | 228 | 1882223 | 14023.16 | 650 | 638 | 134.2 |
| A | 10 | 83 | 619231 | 4610.28 | 650 | 638 | 134.2 |
| A | 14 | 235 | 206659 | 1535.44 | 650 | 638 | 134.2 |
| B | 3 | 42 | 412821 | 3233.85 | 660 | 643 | 127.5 |
| B | 3 | 25 | 183381 | 1433.72 | 660 | 643 | 127.5 |
| B | 0 | 85 | 65579 | 509.47 | 660 | 643 | 127.5 |
| C | 15 | 174 | 5628235 | 172002.19 | 133 | 134 | 32.7 |
| C | 15 | 142 | 3635601 | 111104.67 | 133 | 134 | 32.7 |
| C | 15 | 126 | 3597197 | 109930.99 | 133 | 134 | 32.7 |
| D | 4 | 216 | 7858736 | 193997.56 | 103 | 97 | 40.5 |
| D | 4 | 212 | 1322136 | 32635.72 | 103 | 97 | 40.5 |
| D | 8 | 48 | 431759 | 10655.96 | 103 | 97 | 40.5 |
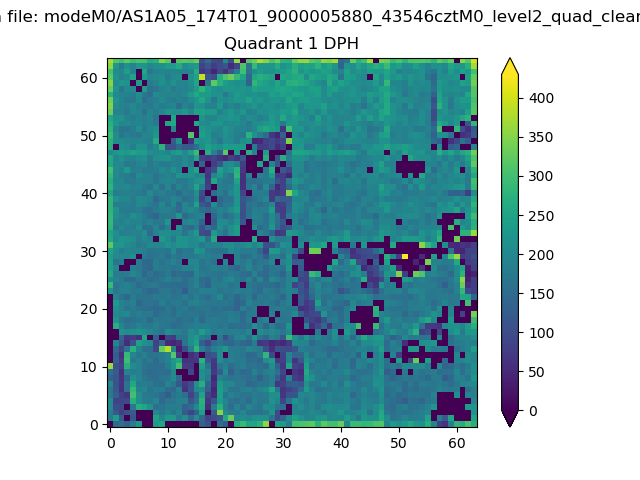
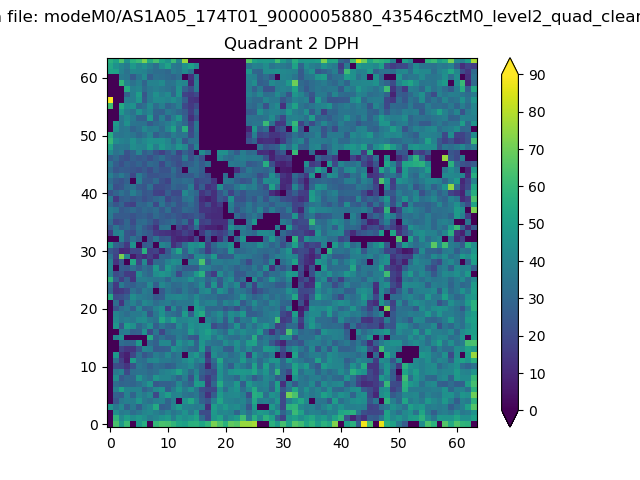
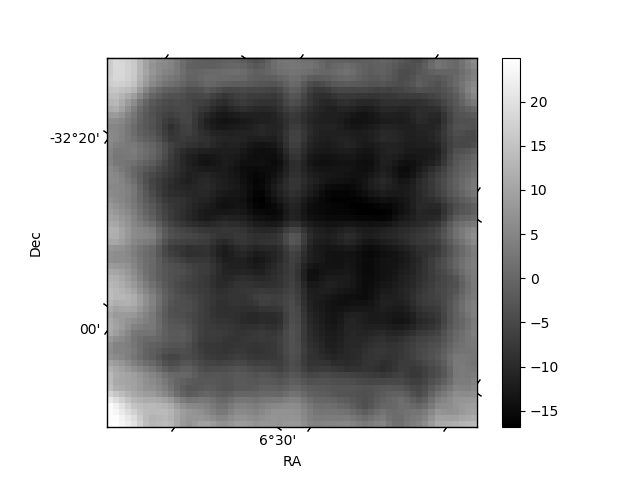
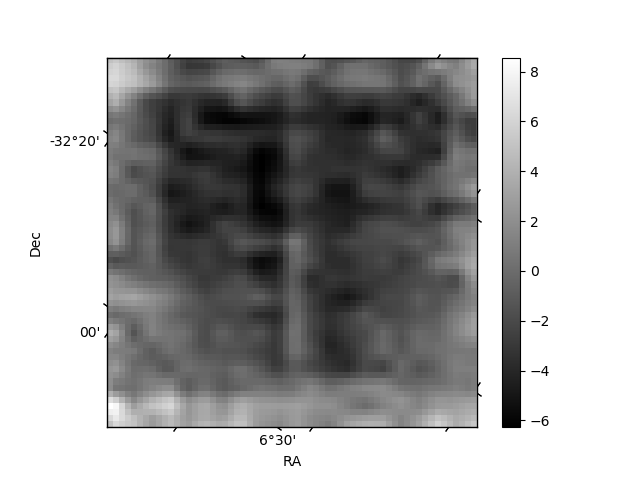
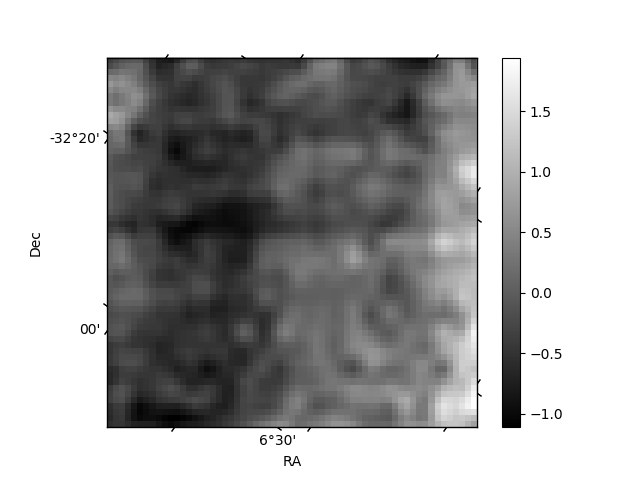
Histogram calculated using DETX and DETY for each event in the final _common_clean file
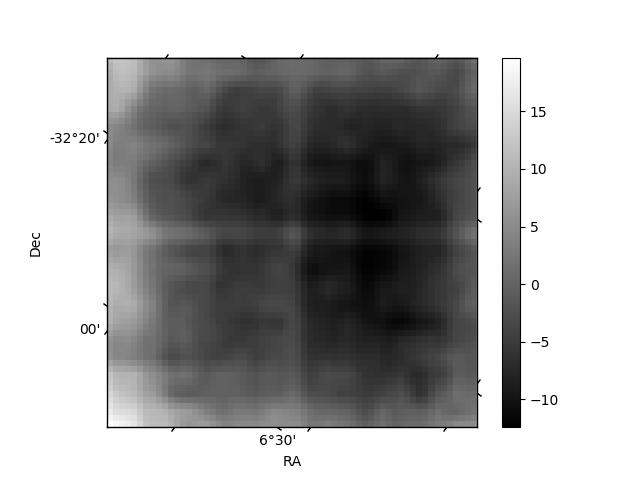
| Quadrant A | 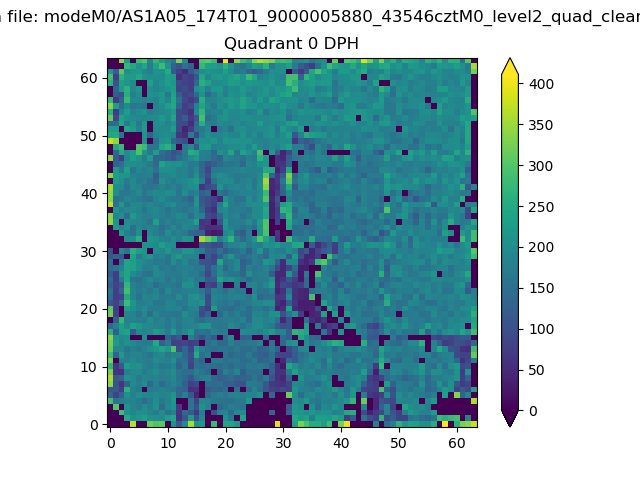 |
 |
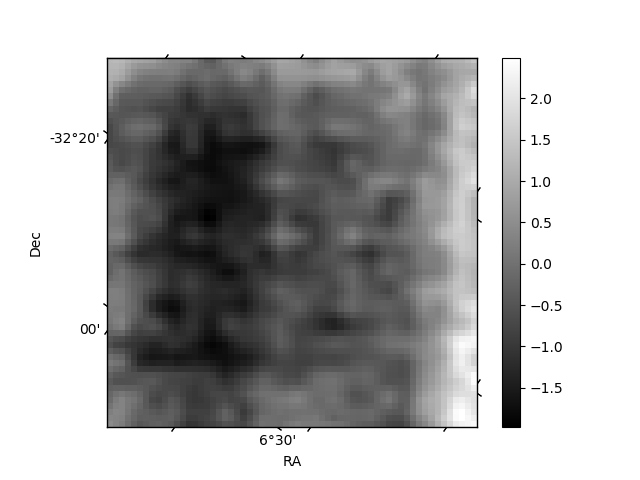
Quadrant B |
|---|---|---|---|
| Quadrant D | 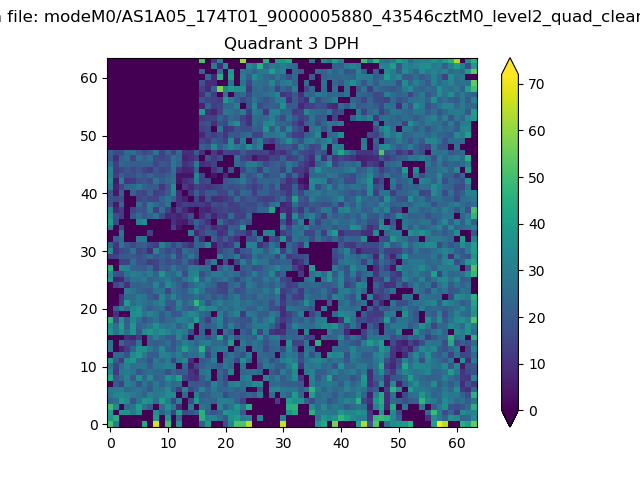 |
 |
Quadrant C |
| Plot type | Count rate plots | Images |
|---|---|---|
| Comparison with Poisson distribution Blue bars denote a histogram of data divided into 1 sec bins. Red curve is a Poisson curve with rate = median count rate of data. |
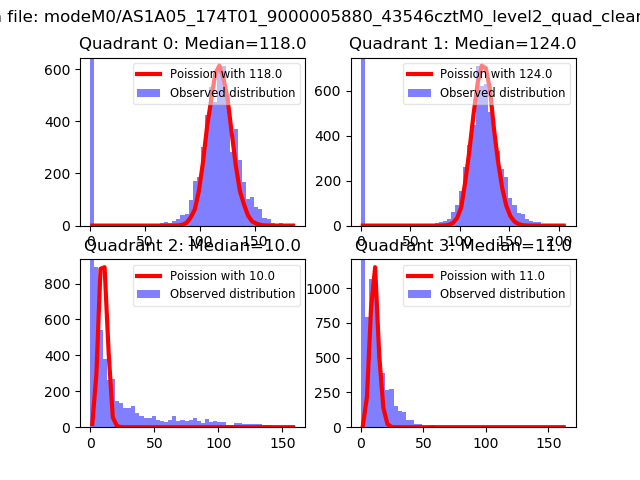 |
 |
| Quadrant-wise count rates Data is divided into 100 sec bins |
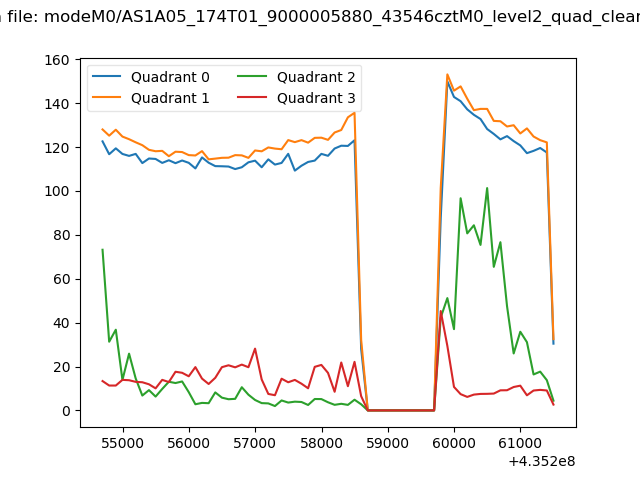 |
|
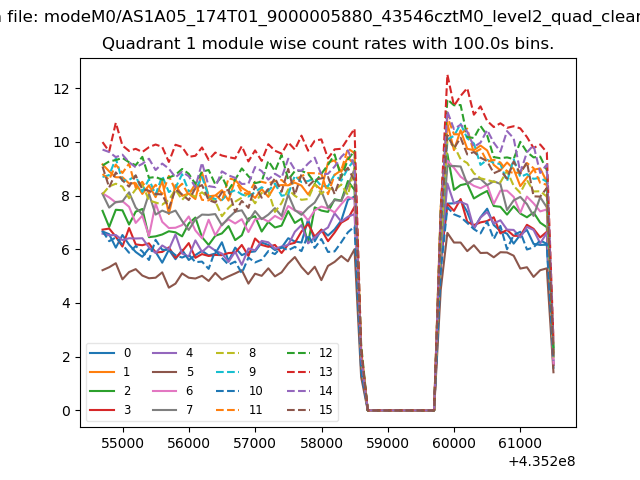
| Module-wise count rates for Quadrant A Data is divided into 100 sec bins |
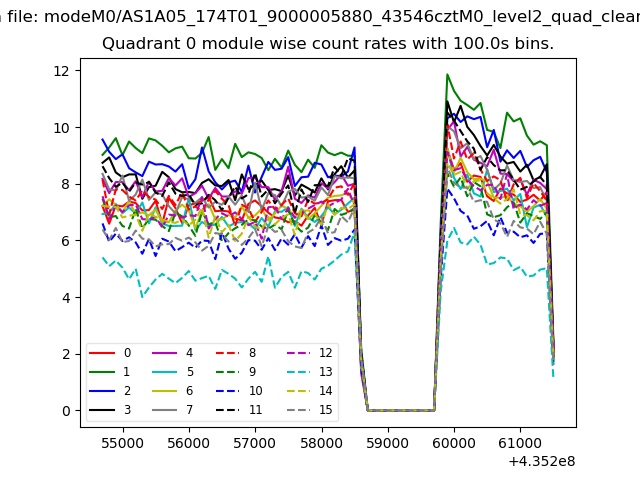 |
 |
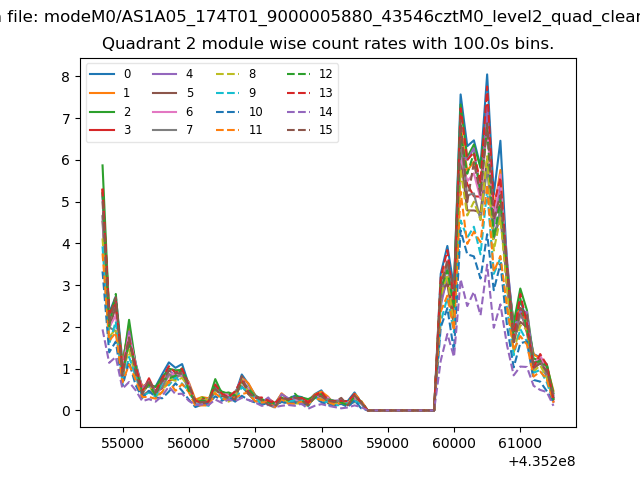
| Module-wise count rates for Quadrant B Data is divided into 100 sec bins |
 |
 |
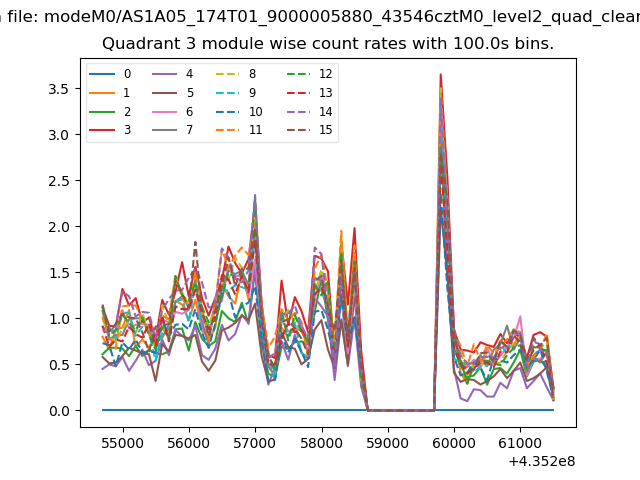
| Module-wise count rates for Quadrant C Data is divided into 100 sec bins |
 |
 |
| Module-wise count rates for Quadrant D Data is divided into 100 sec bins |
 |
 |
| Parameter | Plot |
|---|---|
| CZT HV Monitor |  |
| D_VDD | 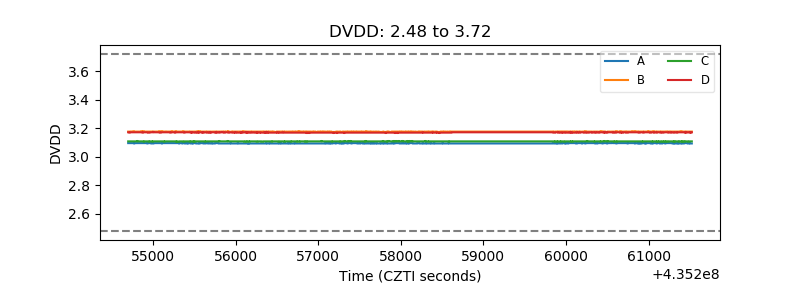 |
| Temperature 1 | 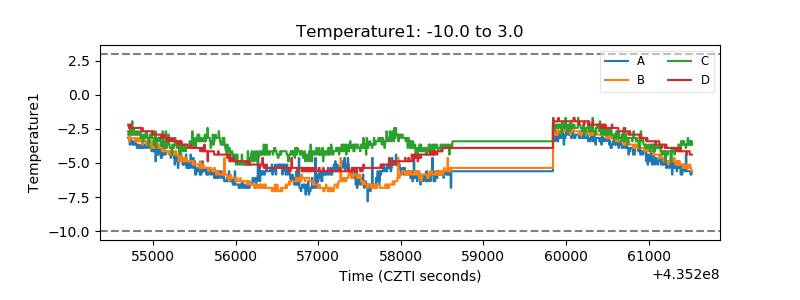 |
| Veto HV Monitor | 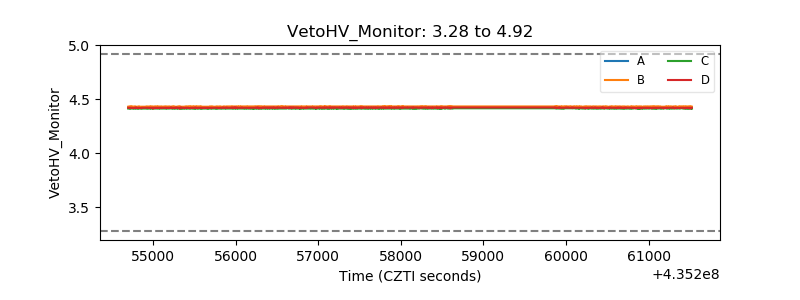 |
| Veto LLD | 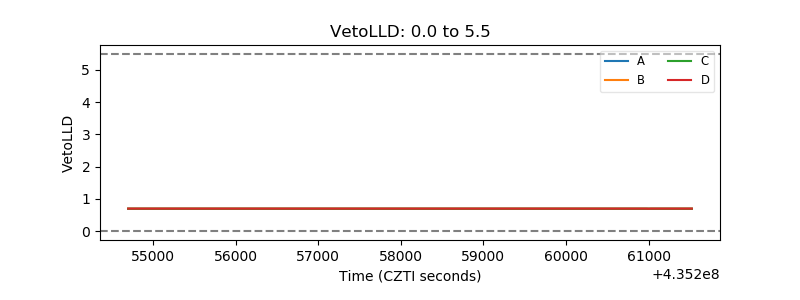 |
| Alpha Counter | 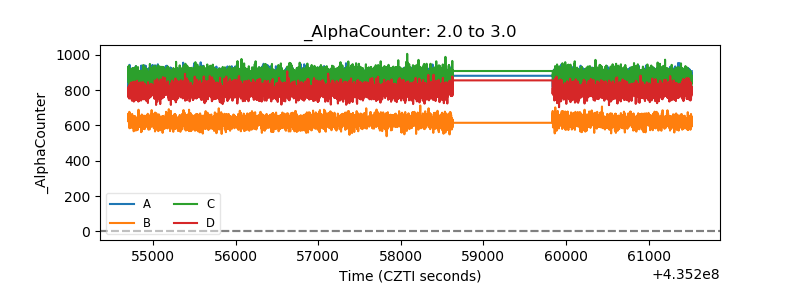 |
| _CPM_Rate | 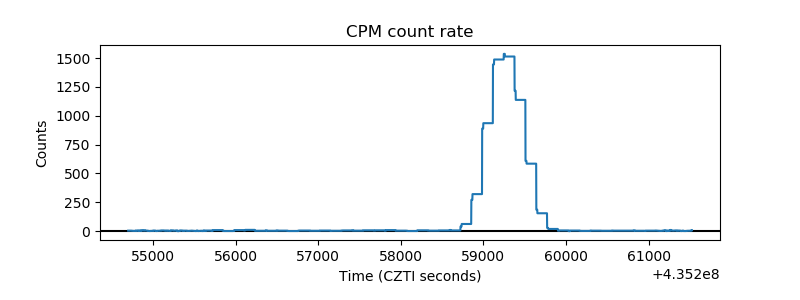 |
| CZT Counter | 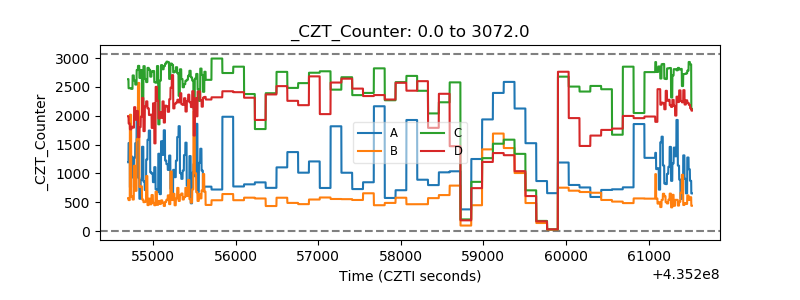 |
| +2.5 Volts monitor | 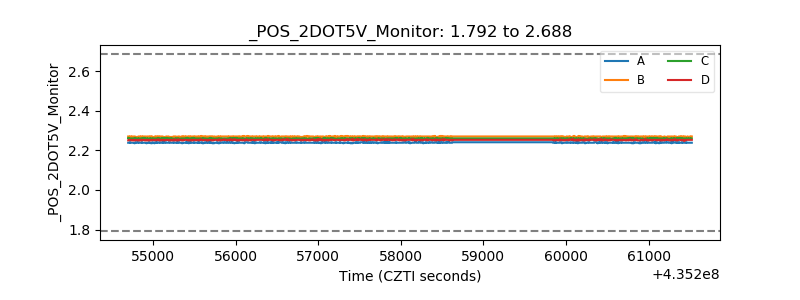 |
| +5 Volts monitor | 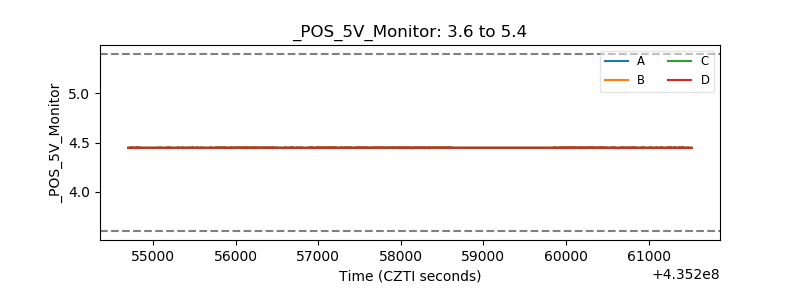 |
| _ROLL_ROT | 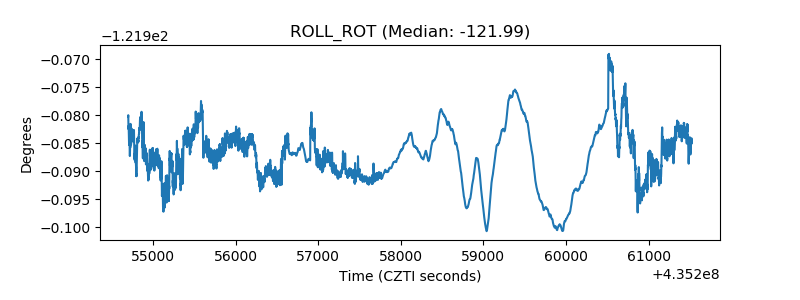 |
| _Roll_DEC | 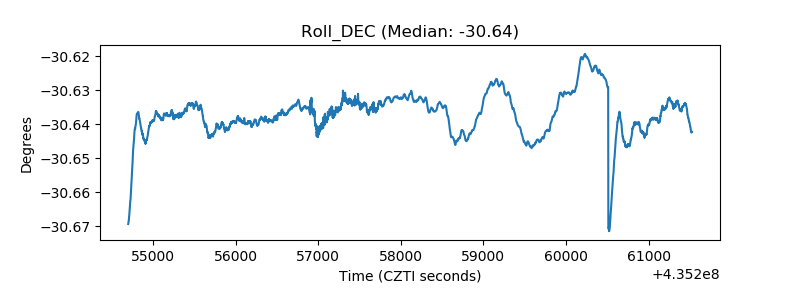 |
| _Roll_RA | 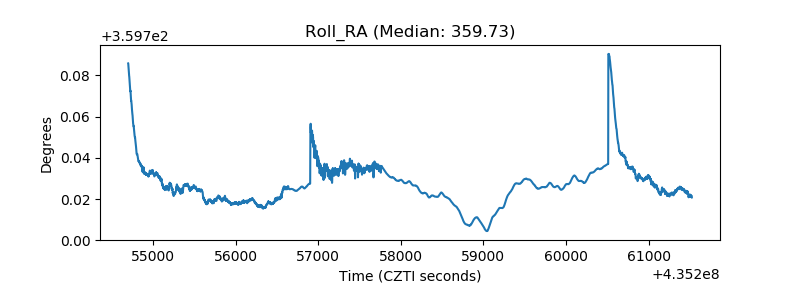 |
| Veto Counter | 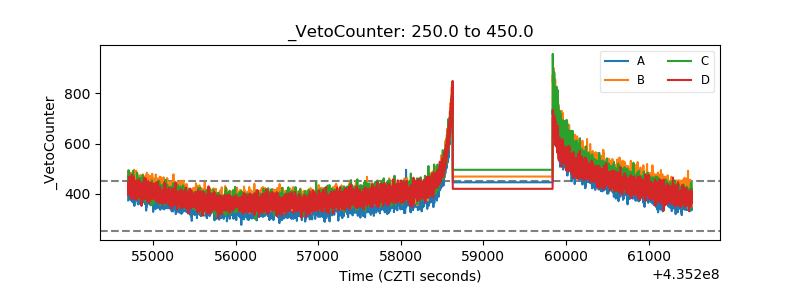 |