| Param | Original file | Final file |
|---|---|---|
| Filename | modeM0/AS1A05_174T01_9000005880_43547cztM0_level2.fits | modeM0/AS1A05_174T01_9000005880_43547cztM0_level2_quad_clean.evt |
| Size (bytes) | 1,022,561,280 | 64,048,320 |
| Size | 975.2 MB | 61.1 MB |
| Events in quadrant A | 6,792,698 | 648,982 |
| Events in quadrant B | 3,224,612 | 701,895 |
| Events in quadrant C | 14,919,066 | 126,179 |
| Events in quadrant D | 12,475,835 | 58,522 |
| Mode M9 | |||
|---|---|---|---|
| Quadrant | BADHDUFLAG | Total packets | Discarded packets |
| A | 0 | 12 | 0 |
| B | 0 | 12 | 0 |
| C | 0 | 12 | 0 |
| D | 0 | 12 | 0 |
| Mode M0 | |||
|---|---|---|---|
| Quadrant | BADHDUFLAG | Total packets | Discarded packets |
| A | 0 | 24212 | 1 |
| B | 0 | 13283 | 1 |
| C | 0 | 48130 | 1 |
| D | 0 | 40926 | 1 |
| Mode SS | |||
|---|---|---|---|
| Quadrant | BADHDUFLAG | Total packets | Discarded packets |
| A | 0 | 116 | 0 |
| B | 0 | 116 | 0 |
| C | 0 | 116 | 0 |
| D | 0 | 116 | 0 |
| Quadrant | Total seconds | Saturated seconds | Saturation percentage |
|---|---|---|---|
| A | 5691 | 813 | 14.285714% |
| B | 5691 | 127 | 2.231594% |
| C | 5691 | 5642 | 99.138991% |
| D | 5692 | 5671 | 99.631061% |
Noise dominated data is calculated using 1-second bins in cleaned event files. If a bin has >2000 counts, and if more than 50% of those come from <1% of pixels, then it is considered to be noise-dominated and hence unusable.
| Quadrant | # 1 sec bins | Bins with >0 counts | Bins with >2000 counts | High rate bins dominated by noise | Noise dominated (total time) | Noise dominated (detector-on time) | Marked lightcurve |
|---|---|---|---|---|---|---|---|
| A | 6886 | 5691 | 293 | 293 | 4.26% | 5.15% | 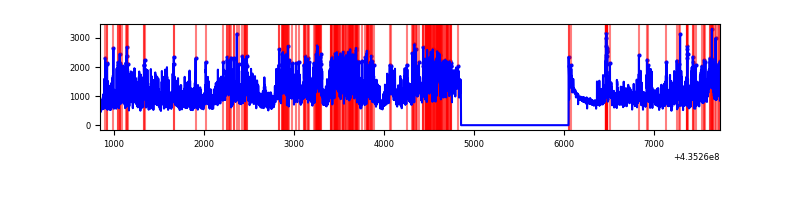 |
| B | 6886 | 5692 | 23 | 23 | 0.33% | 0.40% |  |
| C | 6885 | 5690 | 5483 | 5483 | 79.64% | 96.36% | 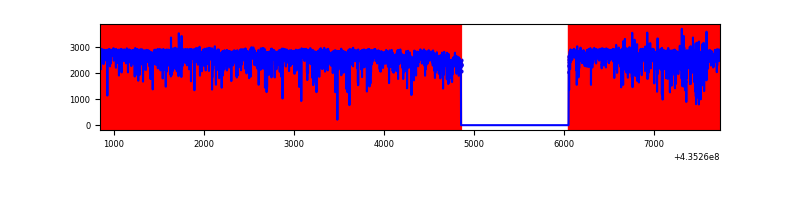 |
| D | 6886 | 5691 | 4490 | 4490 | 65.20% | 78.90% | 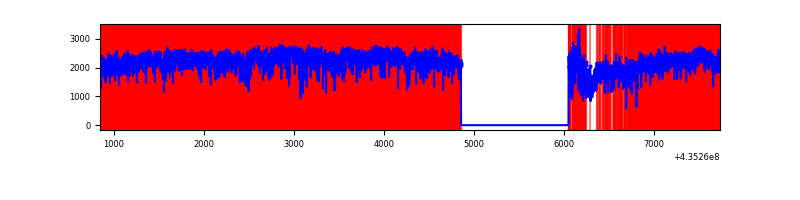 |
Top three noisy pixels from each quadrant. If the there are fewer than three noisy pixels in the level2.evt file, extra rows are filled as -1
| Pixel properties | Quadrant properties | ||||||
|---|---|---|---|---|---|---|---|
| Quadrant | DetID | PixID | Counts | Sigma | Mean | Median | Sigma |
| A | 0 | 228 | 2896378 | 22028.74 | 631 | 618 | 131.5 |
| A | 10 | 83 | 607001 | 4612.9 | 631 | 618 | 131.5 |
| A | 15 | 222 | 391731 | 2975.29 | 631 | 618 | 131.5 |
| B | 3 | 42 | 362557 | 2787.43 | 664 | 646 | 129.8 |
| B | 0 | 155 | 52425 | 398.8 | 664 | 646 | 129.8 |
| B | 0 | 85 | 50682 | 385.38 | 664 | 646 | 129.8 |
| C | 15 | 126 | 6321980 | 200290.68 | 129 | 130 | 31.6 |
| C | 15 | 142 | 3646935 | 115539.13 | 129 | 130 | 31.6 |
| C | 15 | 174 | 2972428 | 94169.2 | 129 | 130 | 31.6 |
| D | 4 | 216 | 9161243 | 292140.27 | 78 | 73 | 31.4 |
| D | 4 | 212 | 1214184 | 38716.75 | 78 | 73 | 31.4 |
| D | 14 | 210 | 265725 | 8471.37 | 78 | 73 | 31.4 |
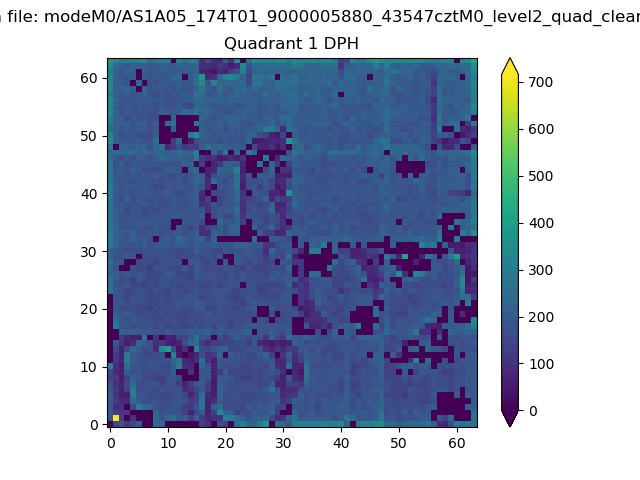
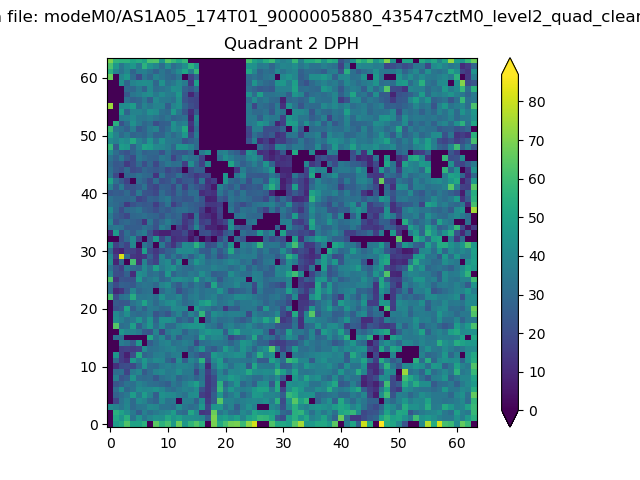
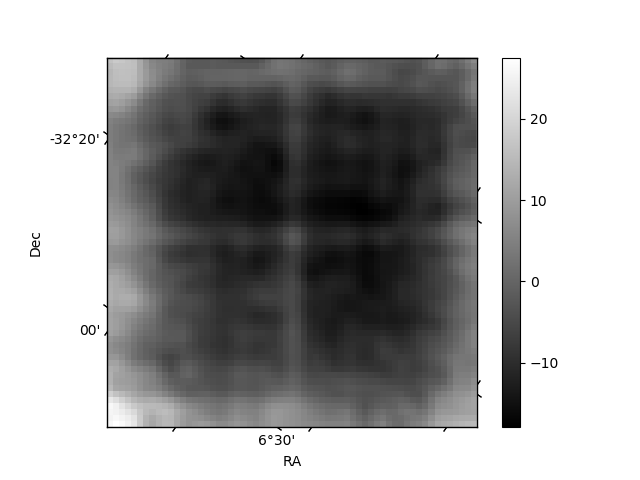
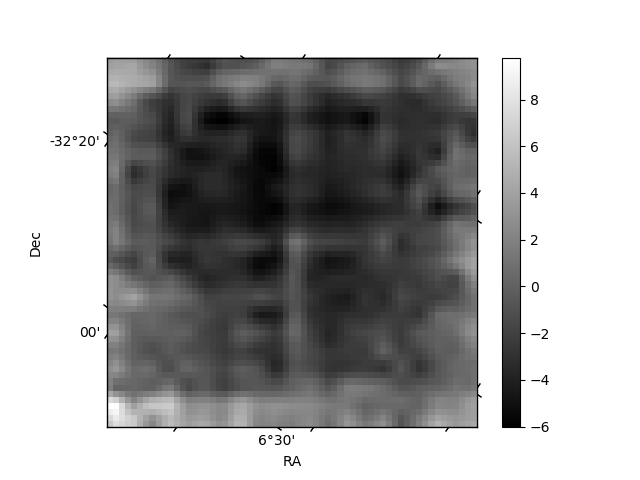
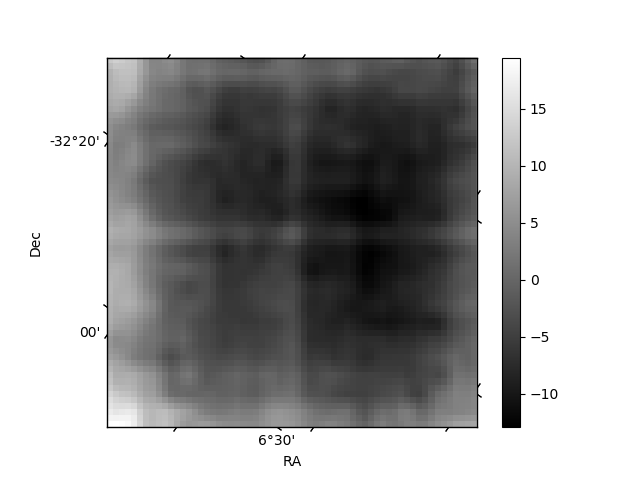
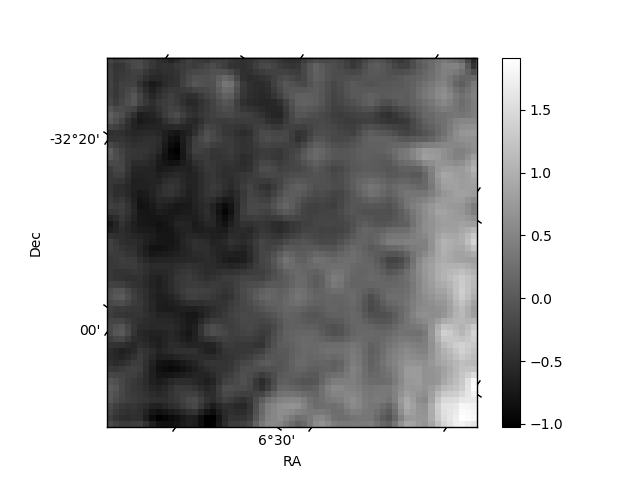
Histogram calculated using DETX and DETY for each event in the final _common_clean file
| Quadrant A | 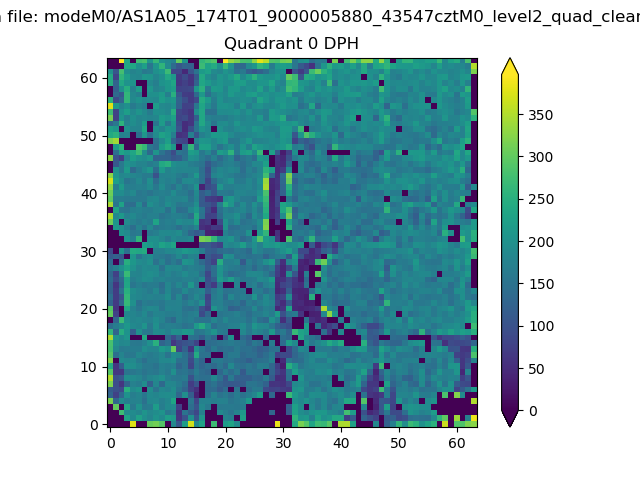 |
 |
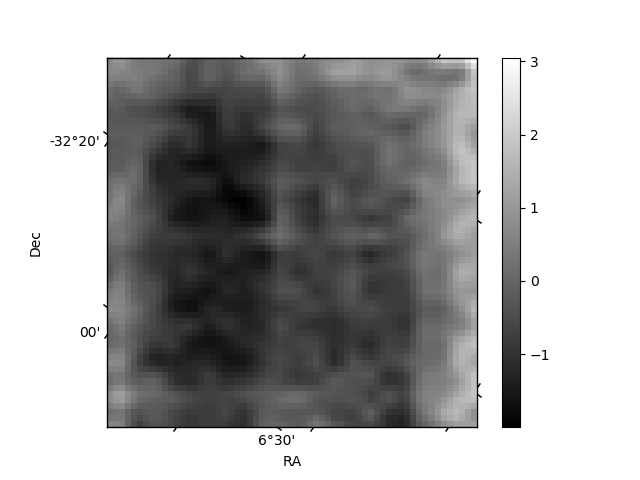
Quadrant B |
|---|---|---|---|
| Quadrant D | 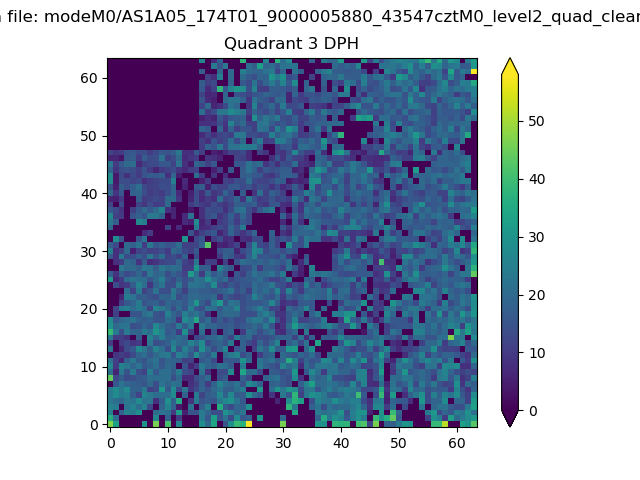 |
 |
Quadrant C |
| Plot type | Count rate plots | Images |
|---|---|---|
| Comparison with Poisson distribution Blue bars denote a histogram of data divided into 1 sec bins. Red curve is a Poisson curve with rate = median count rate of data. |
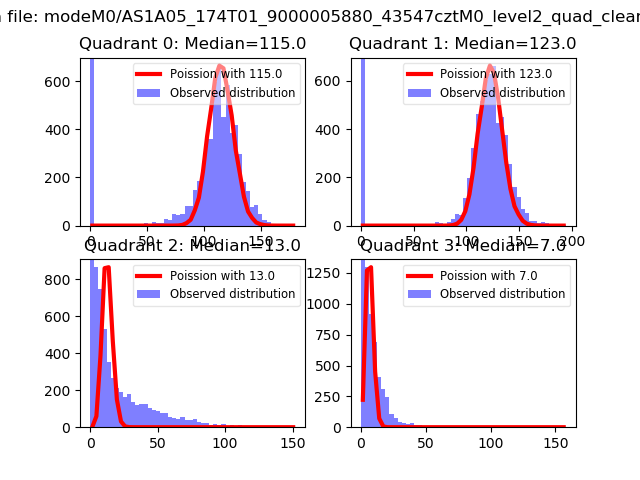 |
 |
| Quadrant-wise count rates Data is divided into 100 sec bins |
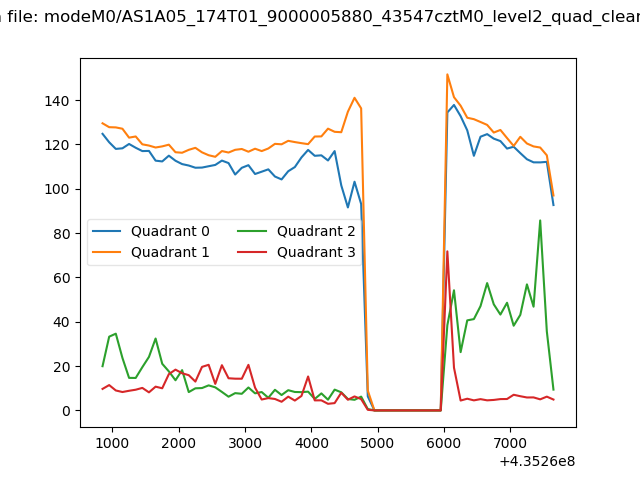 |
|
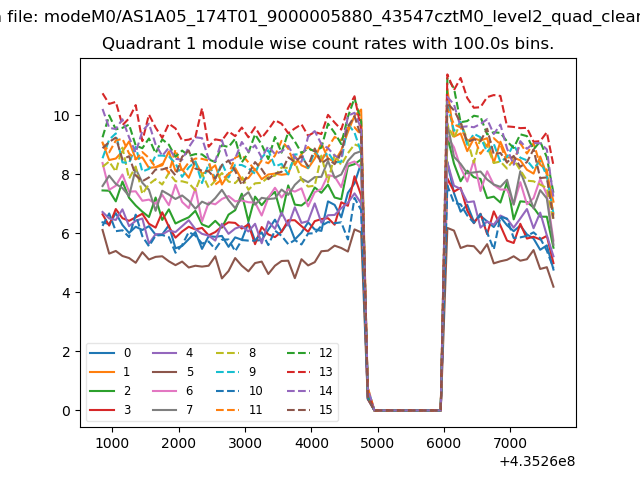
| Module-wise count rates for Quadrant A Data is divided into 100 sec bins |
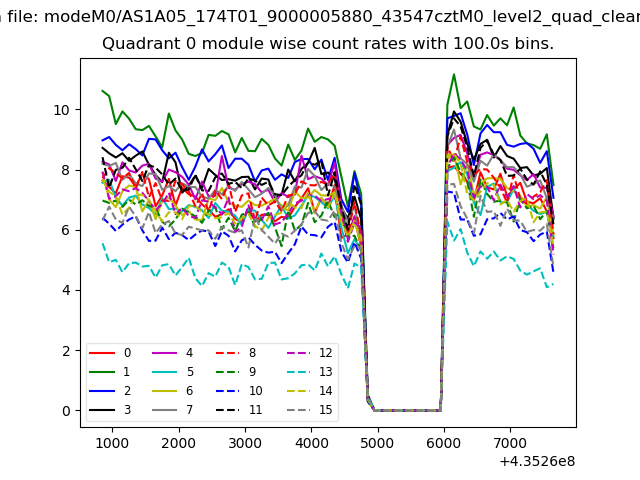 |
 |
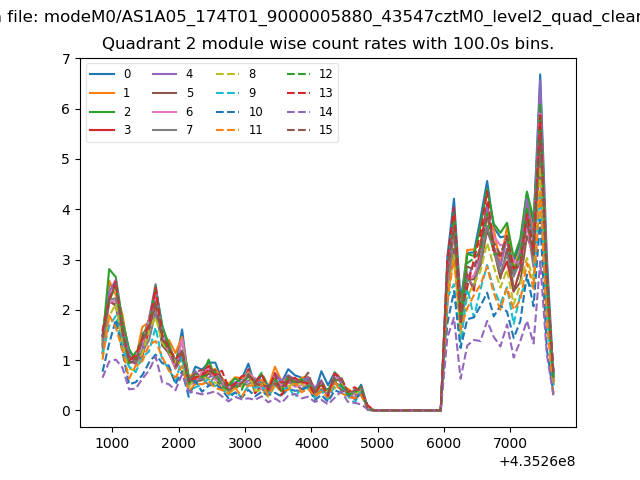
| Module-wise count rates for Quadrant B Data is divided into 100 sec bins |
 |
 |
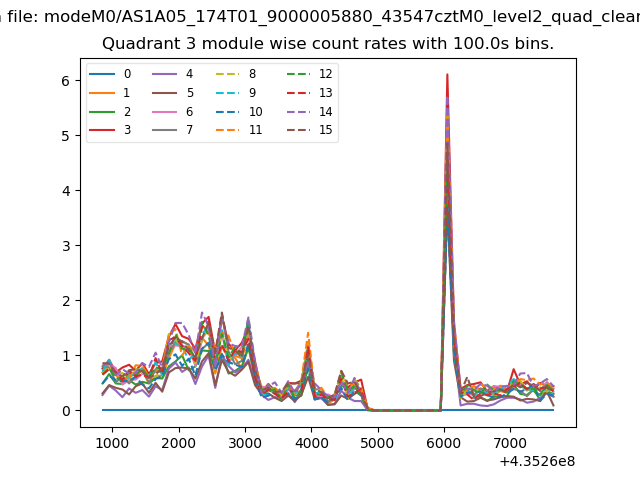
| Module-wise count rates for Quadrant C Data is divided into 100 sec bins |
 |
 |
| Module-wise count rates for Quadrant D Data is divided into 100 sec bins |
 |
 |
| Parameter | Plot |
|---|---|
| CZT HV Monitor | 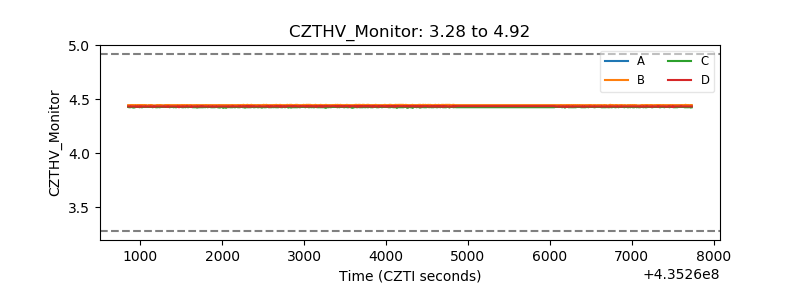 |
| D_VDD | 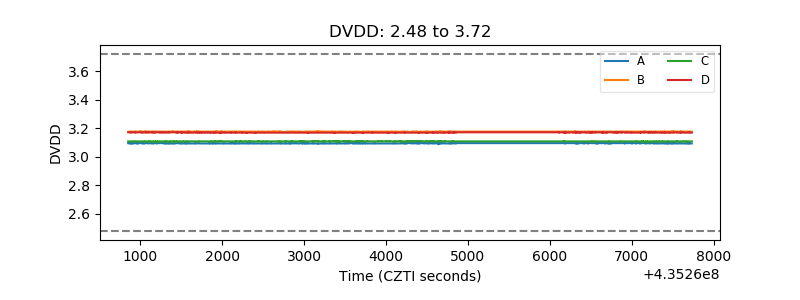 |
| Temperature 1 | 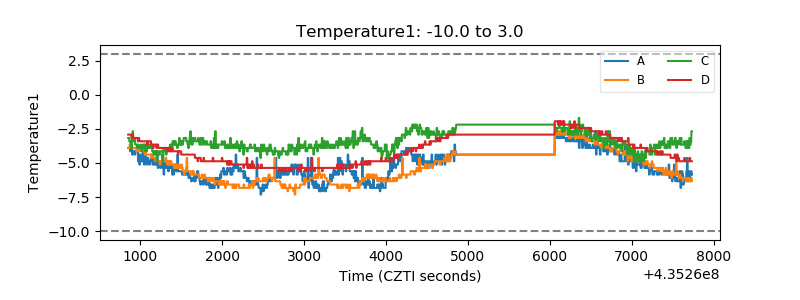 |
| Veto HV Monitor | 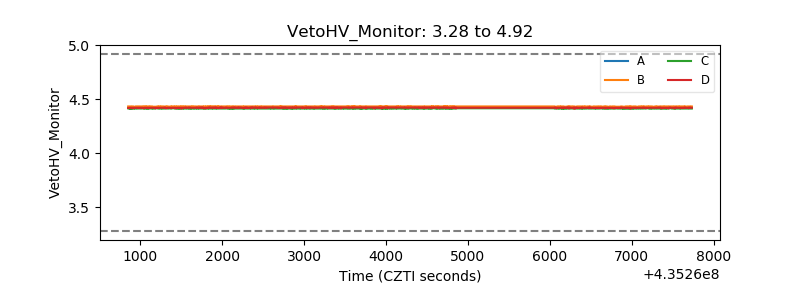 |
| Veto LLD | 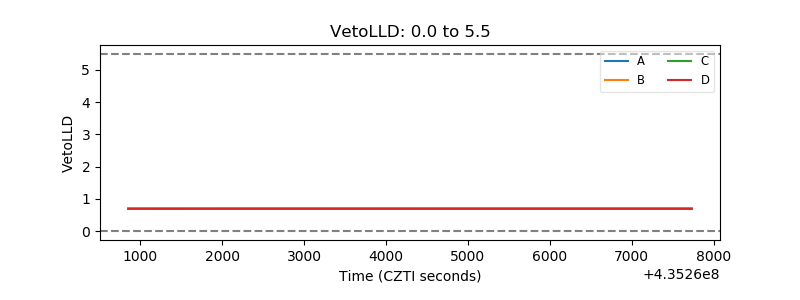 |
| Alpha Counter | 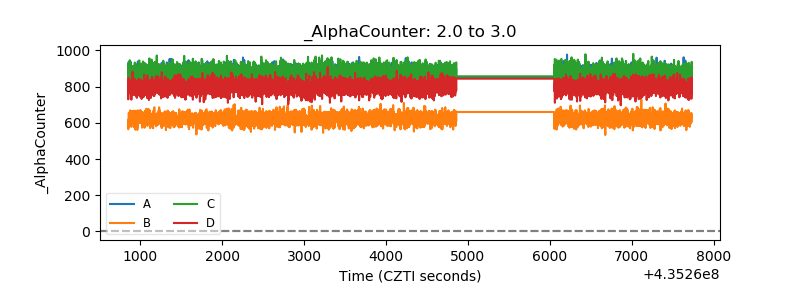 |
| _CPM_Rate | 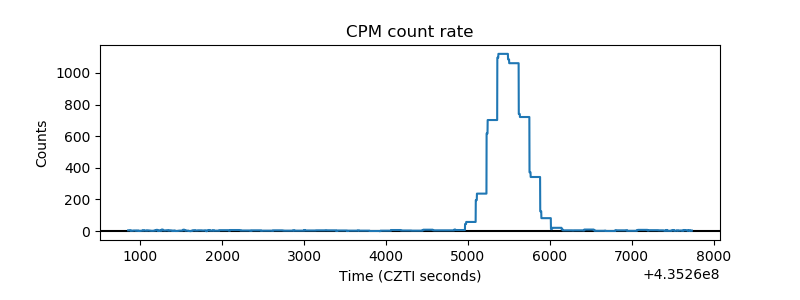 |
| CZT Counter | 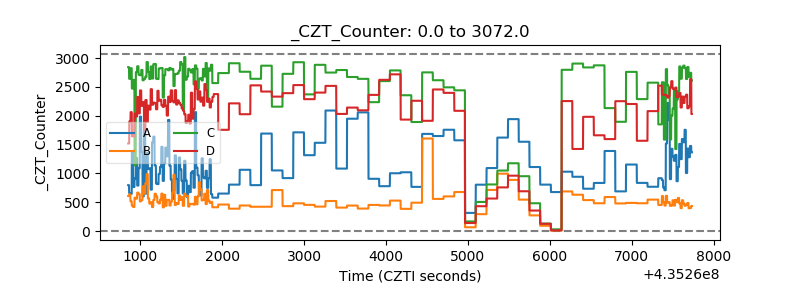 |
| +2.5 Volts monitor | 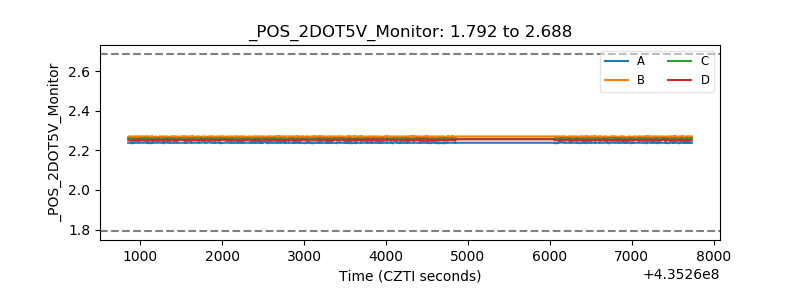 |
| +5 Volts monitor | 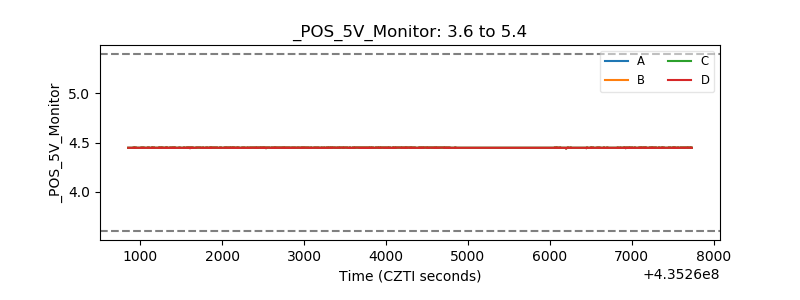 |
| _ROLL_ROT | 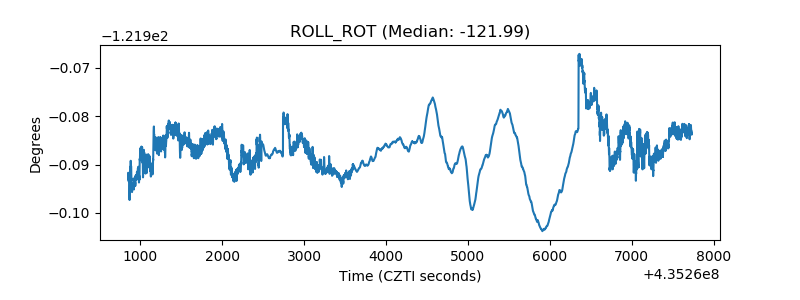 |
| _Roll_DEC | 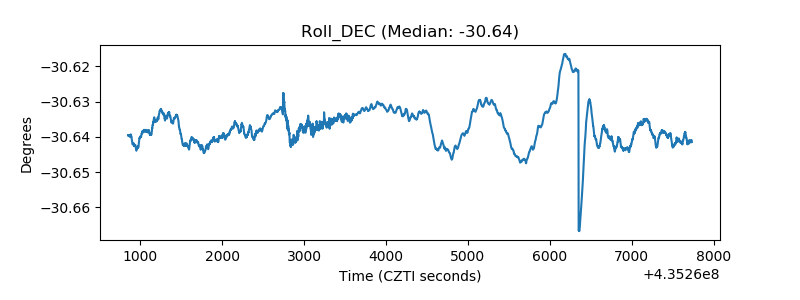 |
| _Roll_RA | 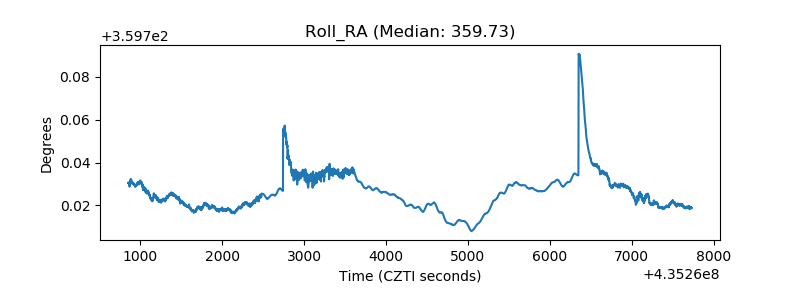 |
| Veto Counter | 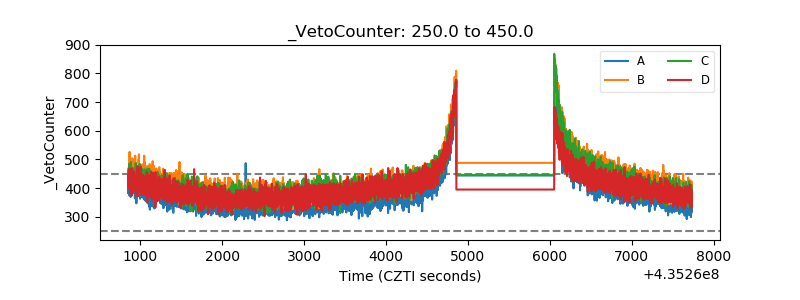 |