| Param | Original file | Final file |
|---|---|---|
| Filename | modeM0/AS1A05_174T01_9000005880_43548cztM0_level2.fits | modeM0/AS1A05_174T01_9000005880_43548cztM0_level2_quad_clean.evt |
| Size (bytes) | 1,050,001,920 | 70,156,800 |
| Size | 1001.4 MB | 66.9 MB |
| Events in quadrant A | 7,281,965 | 656,907 |
| Events in quadrant B | 3,283,991 | 706,180 |
| Events in quadrant C | 15,067,854 | 265,890 |
| Events in quadrant D | 12,773,294 | 72,626 |
| Mode M9 | |||
|---|---|---|---|
| Quadrant | BADHDUFLAG | Total packets | Discarded packets |
| A | 0 | 11 | 0 |
| B | 0 | 11 | 0 |
| C | 0 | 11 | 0 |
| D | 0 | 11 | 0 |
| Mode M0 | |||
|---|---|---|---|
| Quadrant | BADHDUFLAG | Total packets | Discarded packets |
| A | 0 | 25846 | 2 |
| B | 0 | 13657 | 2 |
| C | 0 | 48695 | 6 |
| D | 0 | 42015 | 2 |
| Mode SS | |||
|---|---|---|---|
| Quadrant | BADHDUFLAG | Total packets | Discarded packets |
| A | 0 | 122 | 0 |
| B | 0 | 122 | 0 |
| C | 0 | 122 | 0 |
| D | 0 | 122 | 0 |
| Quadrant | Total seconds | Saturated seconds | Saturation percentage |
|---|---|---|---|
| A | 5959 | 890 | 14.935392% |
| B | 5959 | 134 | 2.248699% |
| C | 5958 | 5732 | 96.206781% |
| D | 5959 | 5958 | 99.983219% |
Noise dominated data is calculated using 1-second bins in cleaned event files. If a bin has >2000 counts, and if more than 50% of those come from <1% of pixels, then it is considered to be noise-dominated and hence unusable.
| Quadrant | # 1 sec bins | Bins with >0 counts | Bins with >2000 counts | High rate bins dominated by noise | Noise dominated (total time) | Noise dominated (detector-on time) | Marked lightcurve |
|---|---|---|---|---|---|---|---|
| A | 7074 | 5961 | 391 | 391 | 5.53% | 6.56% |  |
| B | 7074 | 5961 | 33 | 33 | 0.47% | 0.55% | 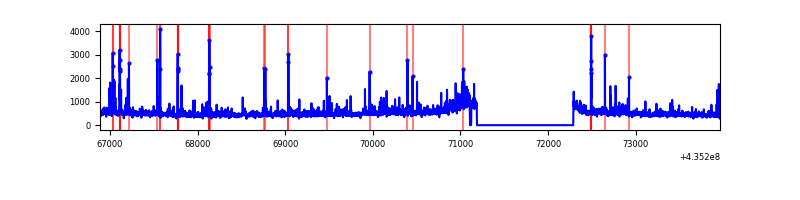 |
| C | 7073 | 5958 | 5331 | 5331 | 75.37% | 89.48% | 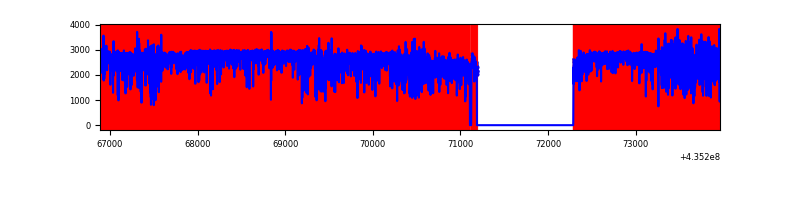 |
| D | 7073 | 5958 | 4321 | 4321 | 61.09% | 72.52% | 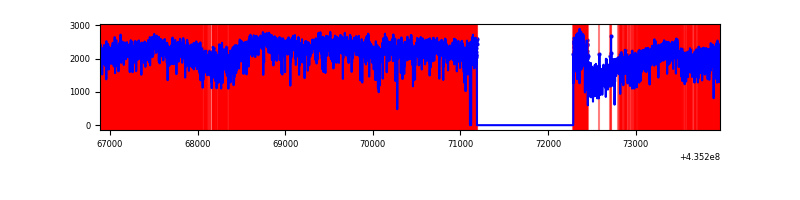 |
Top three noisy pixels from each quadrant. If the there are fewer than three noisy pixels in the level2.evt file, extra rows are filled as -1
| Pixel properties | Quadrant properties | ||||||
|---|---|---|---|---|---|---|---|
| Quadrant | DetID | PixID | Counts | Sigma | Mean | Median | Sigma |
| A | 0 | 228 | 2369601 | 17589.36 | 649 | 638 | 134.7 |
| A | 15 | 222 | 1140365 | 8462.38 | 649 | 638 | 134.7 |
| A | 10 | 83 | 626939 | 4650.23 | 649 | 638 | 134.7 |
| B | 3 | 42 | 247679 | 1843.56 | 682 | 662 | 134.0 |
| B | 3 | 25 | 99109 | 734.74 | 682 | 662 | 134.0 |
| B | 0 | 155 | 62265 | 459.76 | 682 | 662 | 134.0 |
| C | 15 | 142 | 4920214 | 75112.11 | 275 | 277 | 65.5 |
| C | 15 | 126 | 3692842 | 56373.96 | 275 | 277 | 65.5 |
| C | 15 | 174 | 3153856 | 48145.33 | 275 | 277 | 65.5 |
| D | 4 | 216 | 8440740 | 242444.87 | 94 | 88 | 34.8 |
| D | 4 | 212 | 1433849 | 41182.59 | 94 | 88 | 34.8 |
| D | 8 | 48 | 490159 | 14076.53 | 94 | 88 | 34.8 |
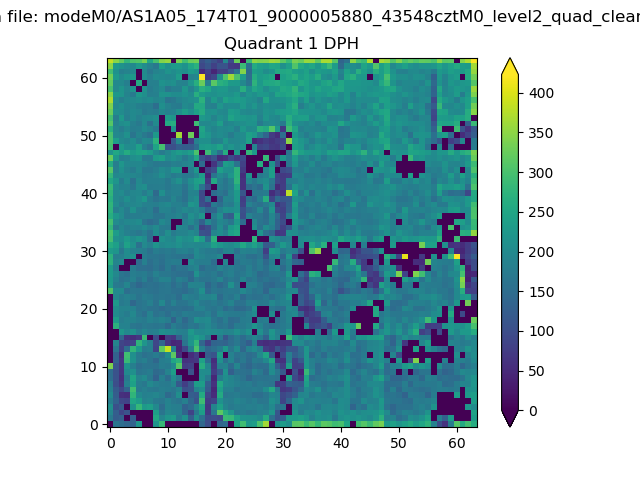
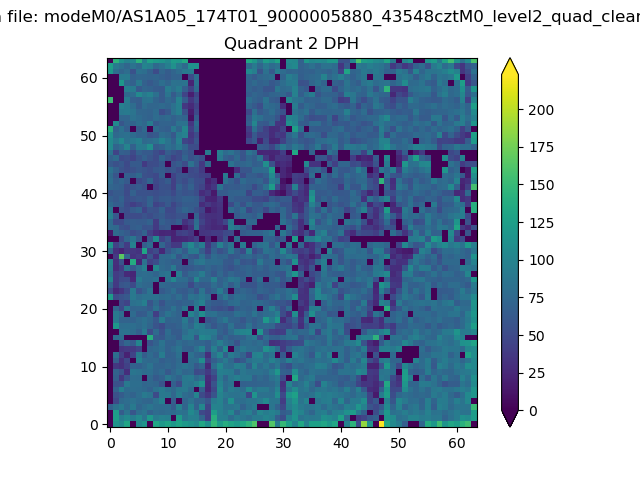
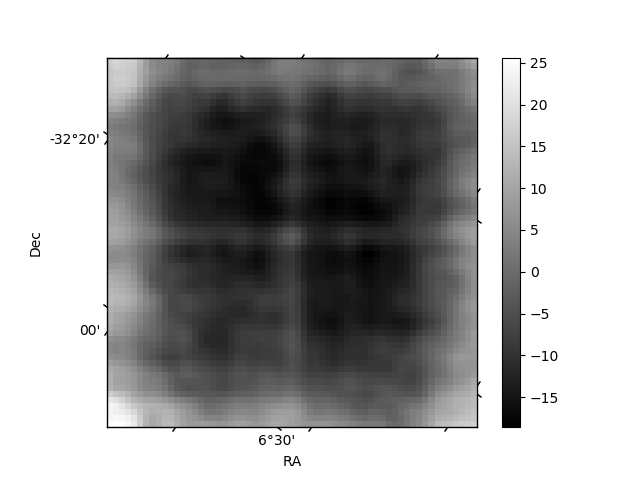
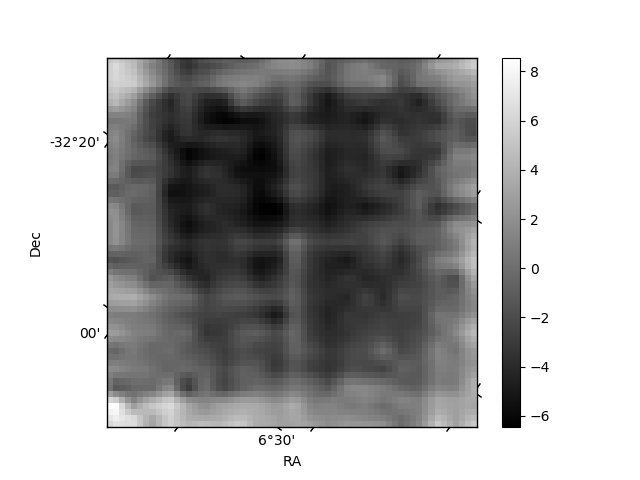
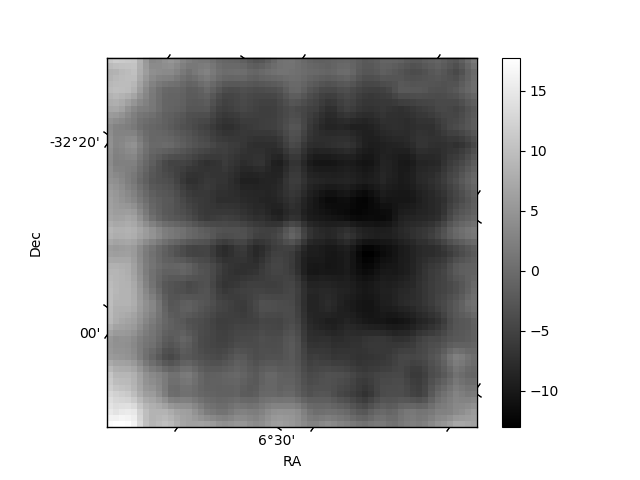
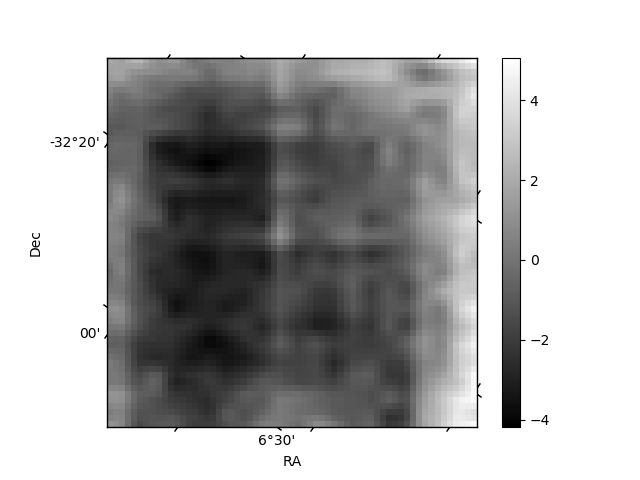
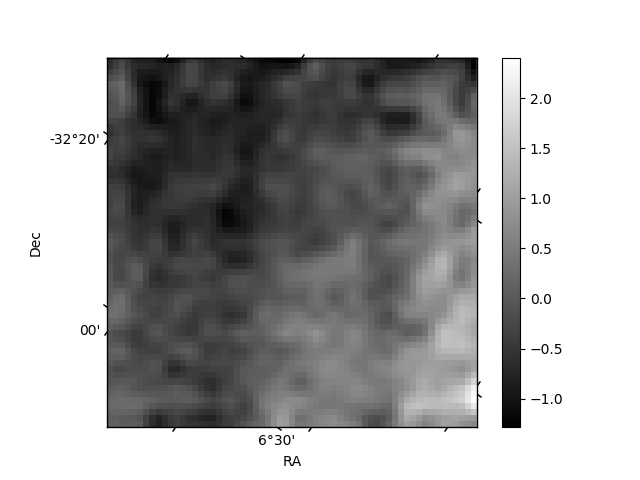
Histogram calculated using DETX and DETY for each event in the final _common_clean file
| Quadrant A | 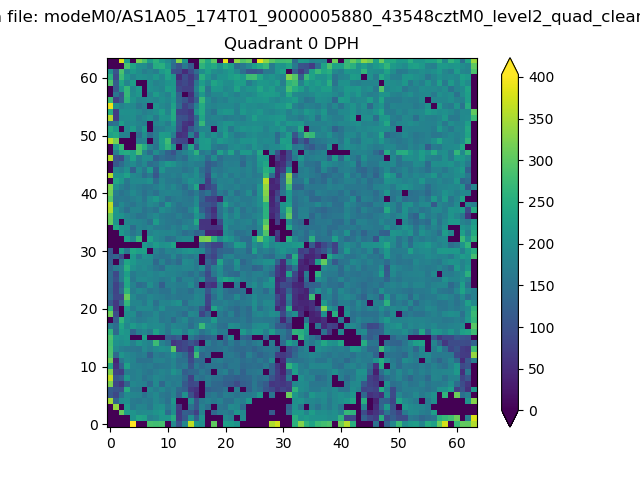 |
 |
Quadrant B |
|---|---|---|---|
| Quadrant D | 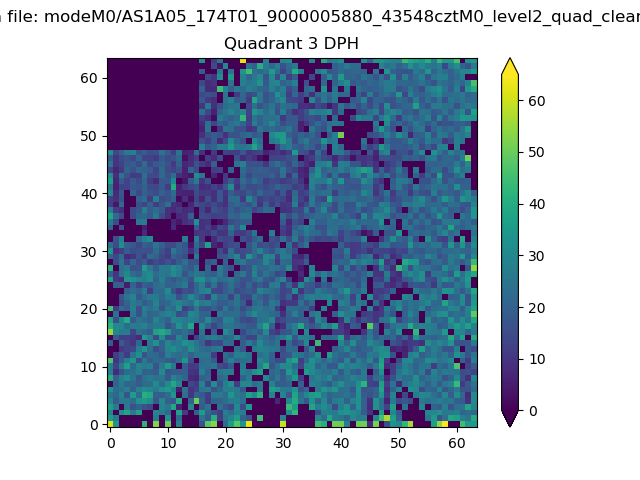 |
 |
Quadrant C |
| Plot type | Count rate plots | Images |
|---|---|---|
| Comparison with Poisson distribution Blue bars denote a histogram of data divided into 1 sec bins. Red curve is a Poisson curve with rate = median count rate of data. |
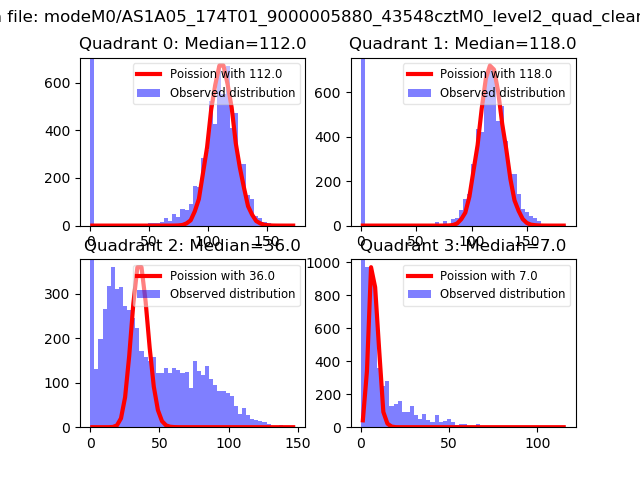 |
 |
| Quadrant-wise count rates Data is divided into 100 sec bins |
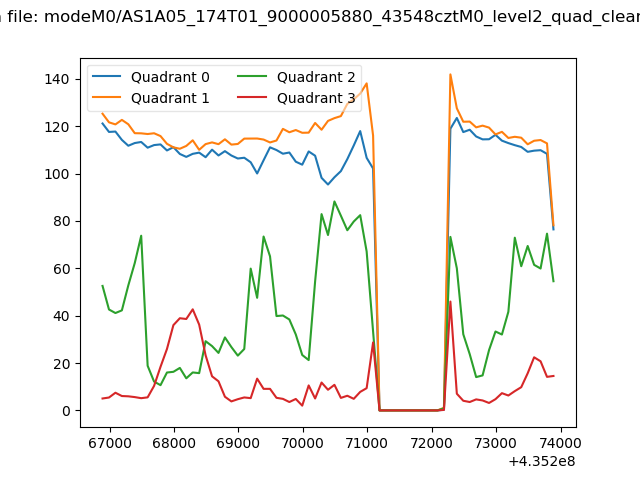 |
|
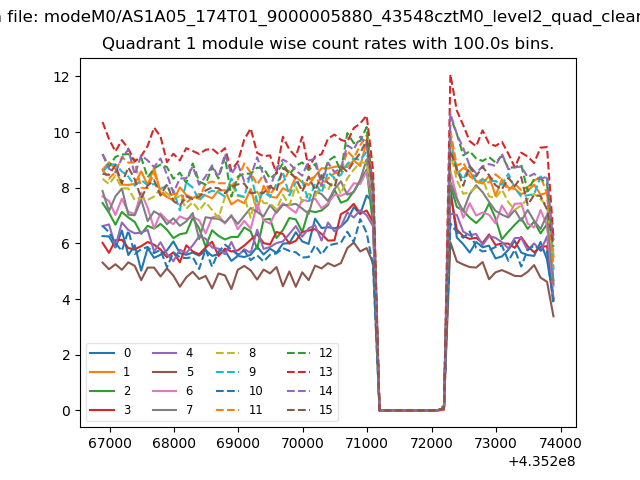
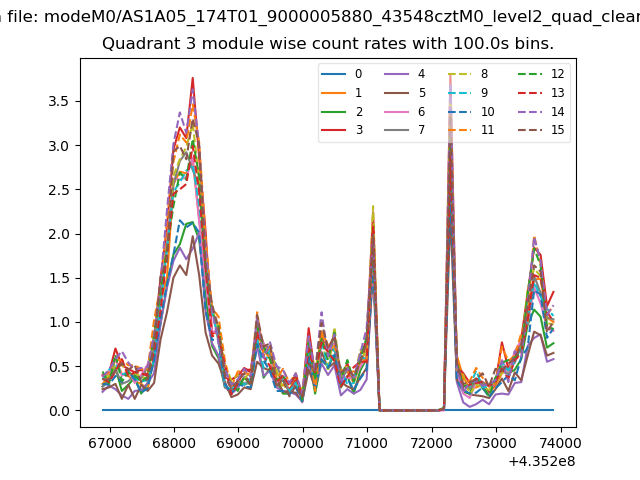
| Module-wise count rates for Quadrant A Data is divided into 100 sec bins |
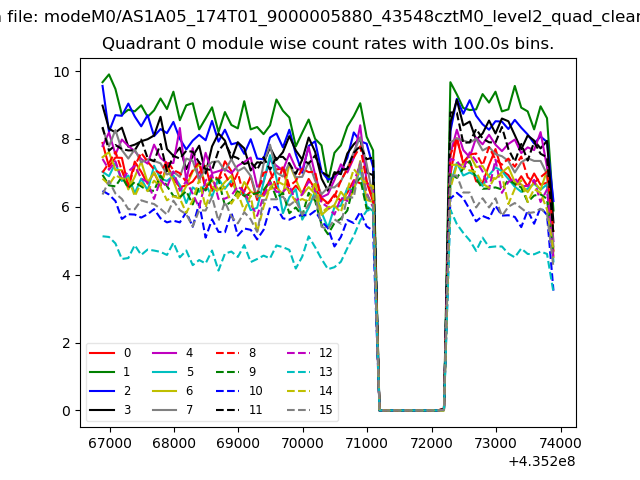 |
 |
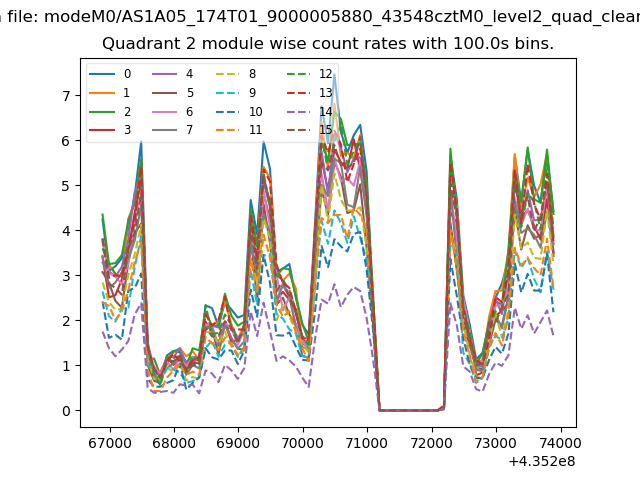
| Module-wise count rates for Quadrant B Data is divided into 100 sec bins |
 |
 |
| Module-wise count rates for Quadrant C Data is divided into 100 sec bins |
 |
 |
| Module-wise count rates for Quadrant D Data is divided into 100 sec bins |
 |
 |
| Parameter | Plot |
|---|---|
| CZT HV Monitor | 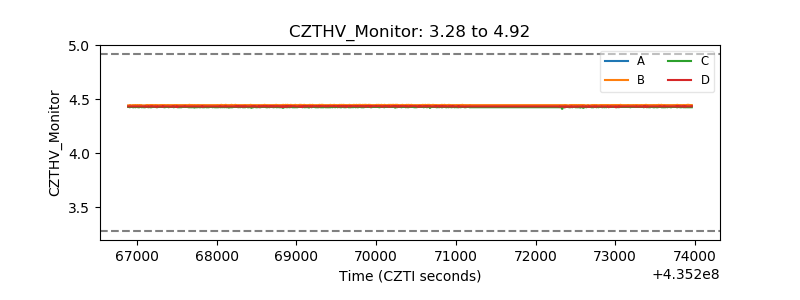 |
| D_VDD | 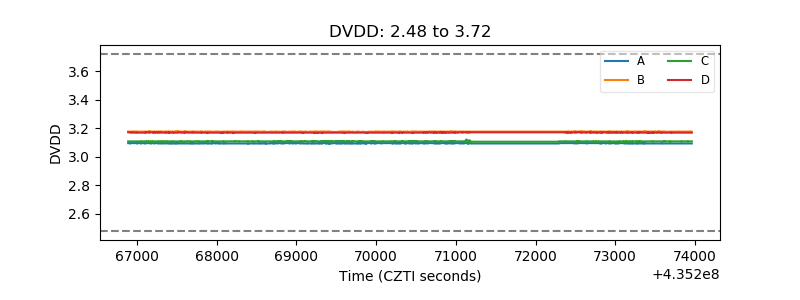 |
| Temperature 1 | 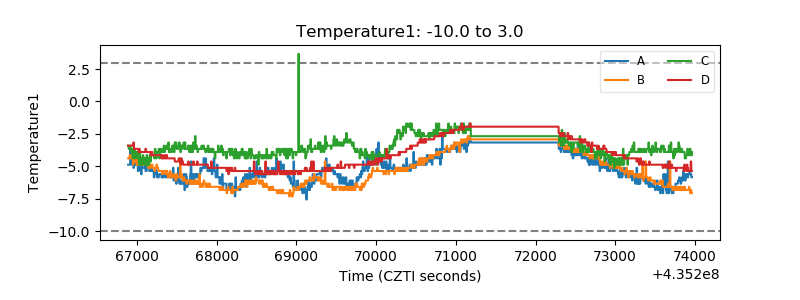 |
| Veto HV Monitor | 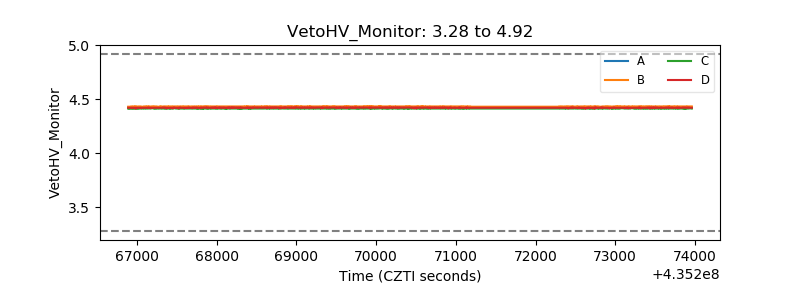 |
| Veto LLD | 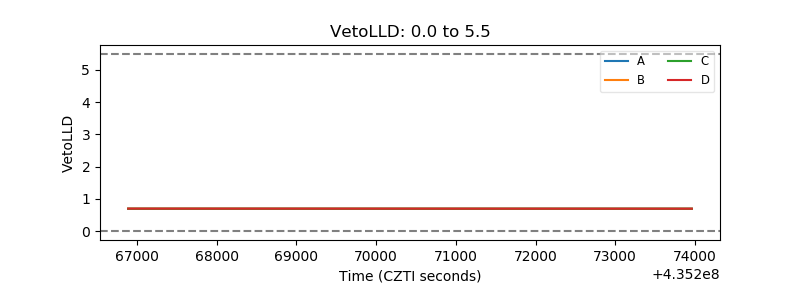 |
| Alpha Counter | 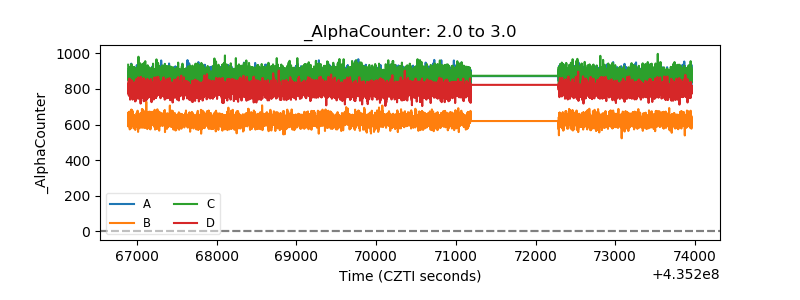 |
| _CPM_Rate | 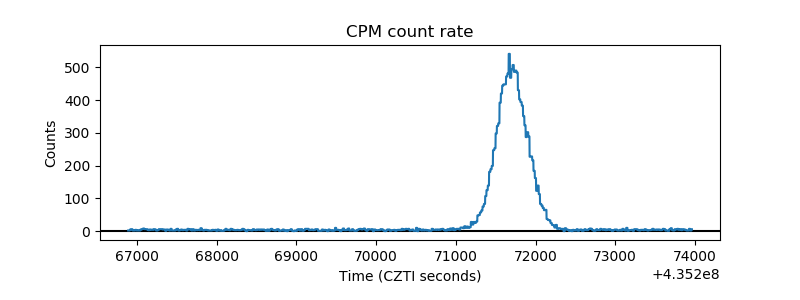 |
| CZT Counter | 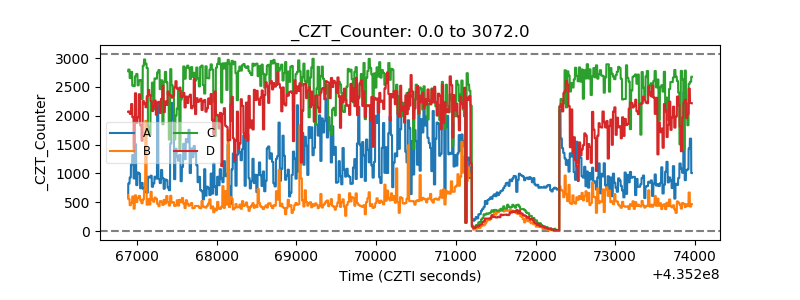 |
| +2.5 Volts monitor | 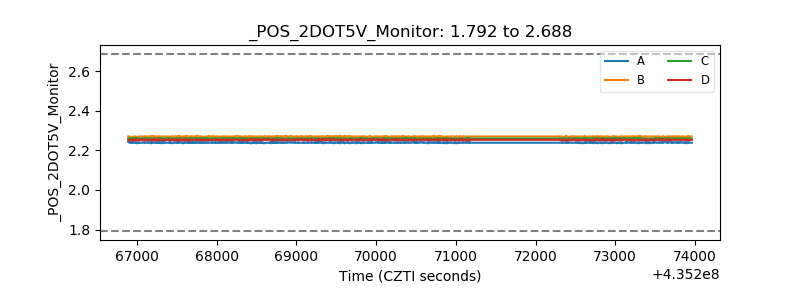 |
| +5 Volts monitor | 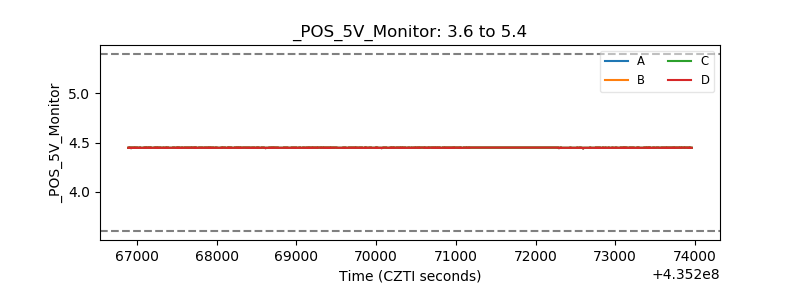 |
| _ROLL_ROT | 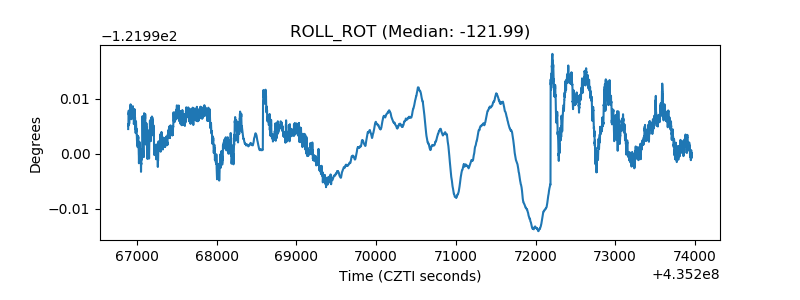 |
| _Roll_DEC | 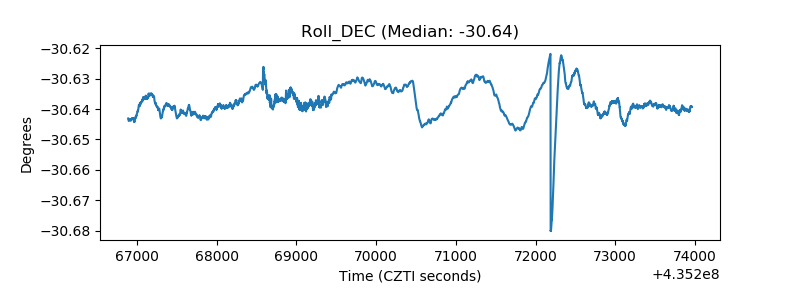 |
| _Roll_RA | 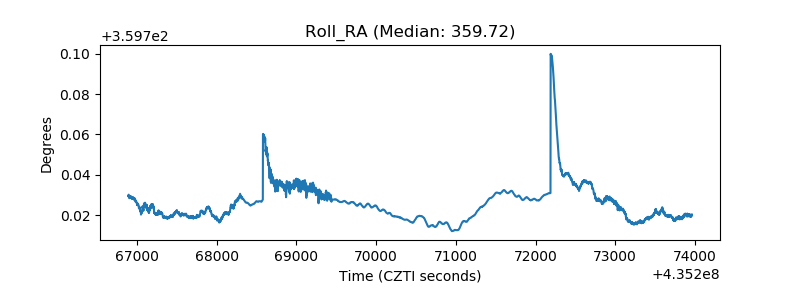 |
| Veto Counter | 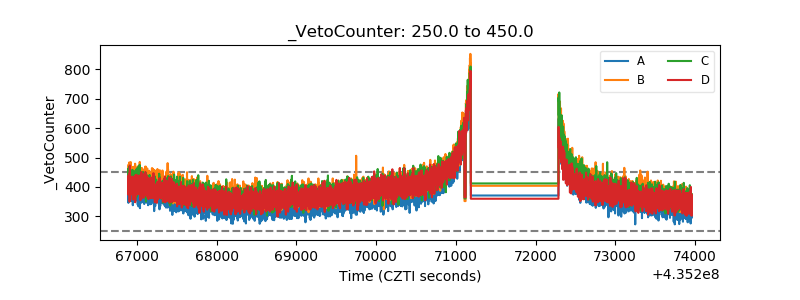 |