| Param | Original file | Final file |
|---|---|---|
| Filename | modeM0/AS1A05_174T01_9000005880_43550cztM0_level2.fits | modeM0/AS1A05_174T01_9000005880_43550cztM0_level2_quad_clean.evt |
| Size (bytes) | 2,113,182,720 | 134,735,040 |
| Size | 2.0 GB | 128.5 MB |
| Events in quadrant A | 13,631,682 | 1,294,426 |
| Events in quadrant B | 6,952,459 | 1,376,259 |
| Events in quadrant C | 30,535,759 | 448,861 |
| Events in quadrant D | 26,158,301 | 99,285 |
| Mode M9 | |||
|---|---|---|---|
| Quadrant | BADHDUFLAG | Total packets | Discarded packets |
| A | 0 | 12 | 0 |
| B | 0 | 12 | 0 |
| C | 0 | 12 | 0 |
| D | 0 | 12 | 0 |
| Mode M0 | |||
|---|---|---|---|
| Quadrant | BADHDUFLAG | Total packets | Discarded packets |
| A | 0 | 49330 | 2 |
| B | 0 | 28970 | 2 |
| C | 0 | 99029 | 10 |
| D | 0 | 86096 | 2 |
| Mode SS | |||
|---|---|---|---|
| Quadrant | BADHDUFLAG | Total packets | Discarded packets |
| A | 0 | 250 | 0 |
| B | 0 | 250 | 0 |
| C | 0 | 250 | 0 |
| D | 0 | 250 | 0 |
| Quadrant | Total seconds | Saturated seconds | Saturation percentage |
|---|---|---|---|
| A | 12268 | 1415 | 11.534072% |
| B | 12268 | 333 | 2.714379% |
| C | 12267 | 11759 | 95.858808% |
| D | 12267 | 12267 | 100.000000% |
Noise dominated data is calculated using 1-second bins in cleaned event files. If a bin has >2000 counts, and if more than 50% of those come from <1% of pixels, then it is considered to be noise-dominated and hence unusable.
| Quadrant | # 1 sec bins | Bins with >0 counts | Bins with >2000 counts | High rate bins dominated by noise | Noise dominated (total time) | Noise dominated (detector-on time) | Marked lightcurve |
|---|---|---|---|---|---|---|---|
| A | 13503 | 12269 | 602 | 602 | 4.46% | 4.91% | 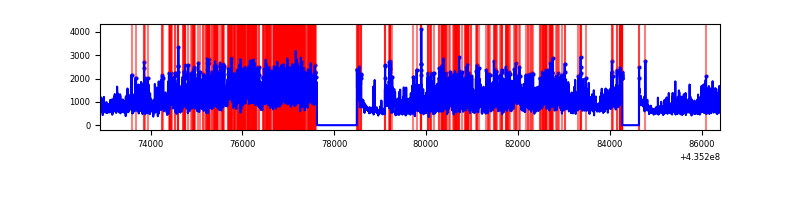 |
| B | 13503 | 12269 | 171 | 171 | 1.27% | 1.39% | 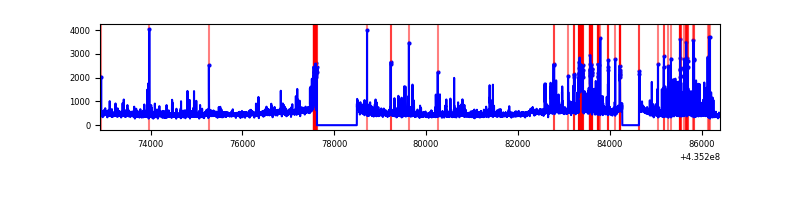 |
| C | 13501 | 12266 | 10879 | 10879 | 80.58% | 88.69% | 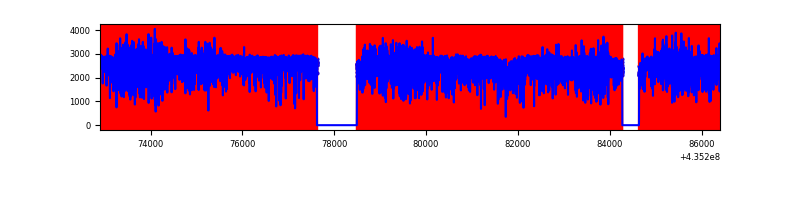 |
| D | 13501 | 12266 | 8799 | 8799 | 65.17% | 71.73% | 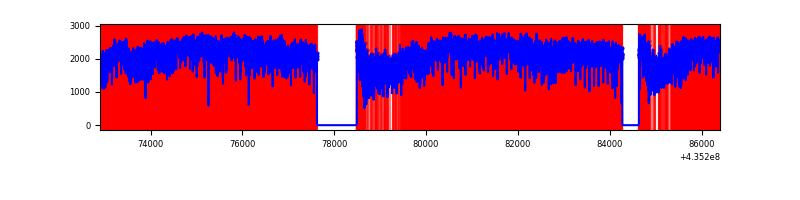 |
Top three noisy pixels from each quadrant. If the there are fewer than three noisy pixels in the level2.evt file, extra rows are filled as -1
| Pixel properties | Quadrant properties | ||||||
|---|---|---|---|---|---|---|---|
| Quadrant | DetID | PixID | Counts | Sigma | Mean | Median | Sigma |
| A | 0 | 228 | 4373572 | 15936.3 | 1330 | 1305 | 274.4 |
| A | 15 | 222 | 1629748 | 5935.45 | 1330 | 1305 | 274.4 |
| A | 10 | 83 | 1205158 | 4387.88 | 1330 | 1305 | 274.4 |
| B | 0 | 85 | 615546 | 2318.3 | 1372 | 1333 | 264.9 |
| B | 3 | 42 | 312483 | 1174.41 | 1372 | 1333 | 264.9 |
| B | 0 | 230 | 137918 | 515.53 | 1372 | 1333 | 264.9 |
| C | 15 | 174 | 9860374 | 86456.97 | 484 | 486 | 114.0 |
| C | 15 | 142 | 7659855 | 67161.6 | 484 | 486 | 114.0 |
| C | 15 | 126 | 6412204 | 56221.5 | 484 | 486 | 114.0 |
| D | 4 | 216 | 18346191 | 242572.07 | 148 | 136 | 75.6 |
| D | 4 | 212 | 2454789 | 32455.49 | 148 | 136 | 75.6 |
| D | 8 | 48 | 660280 | 8728.44 | 148 | 136 | 75.6 |
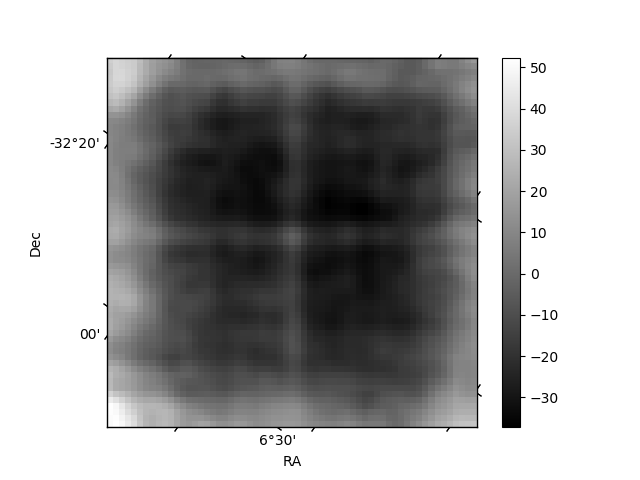
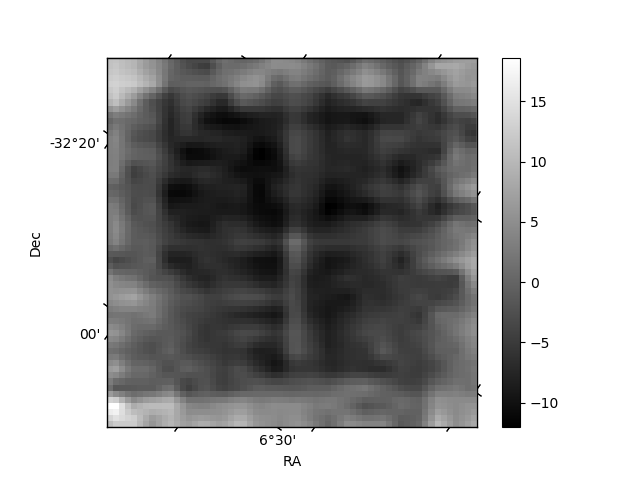
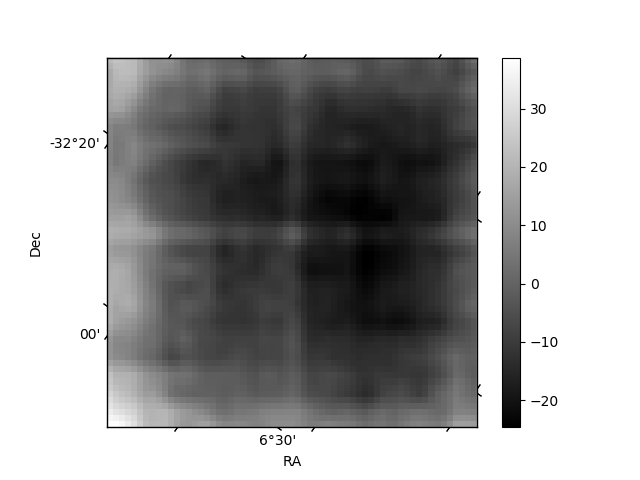
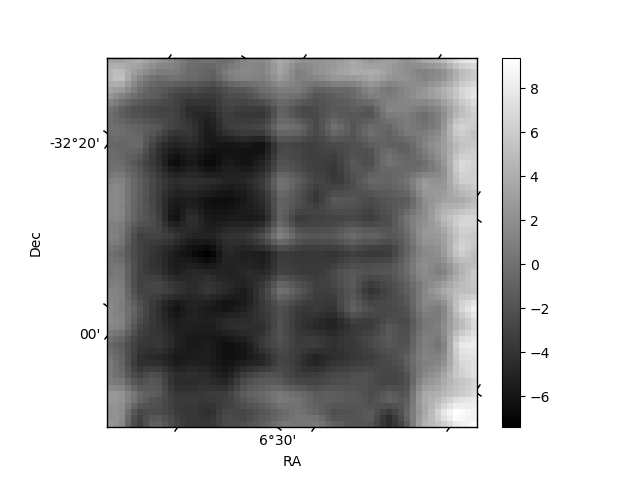
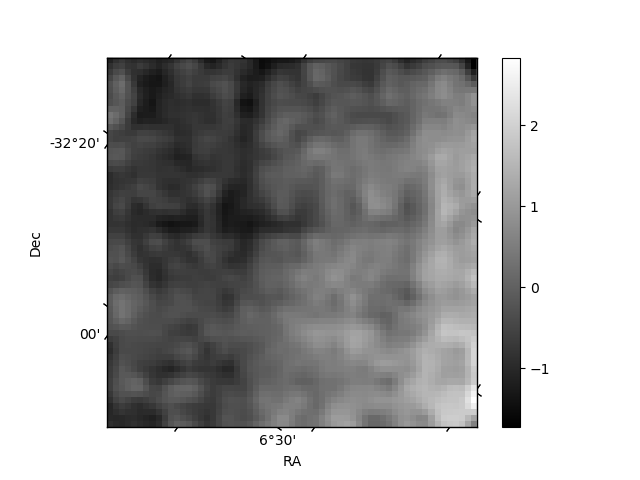
Histogram calculated using DETX and DETY for each event in the final _common_clean file
| Quadrant A | 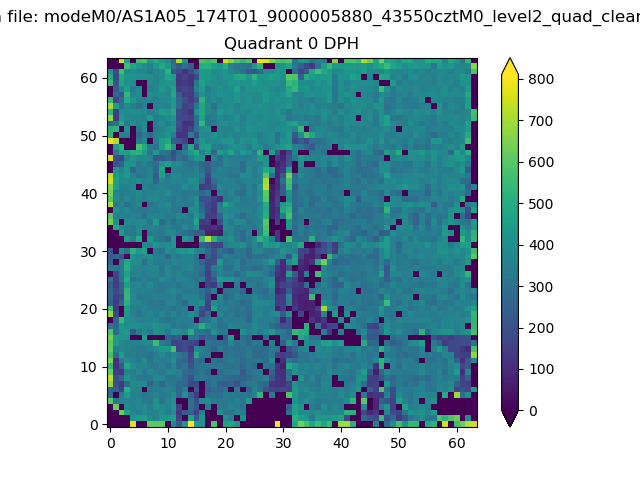 |
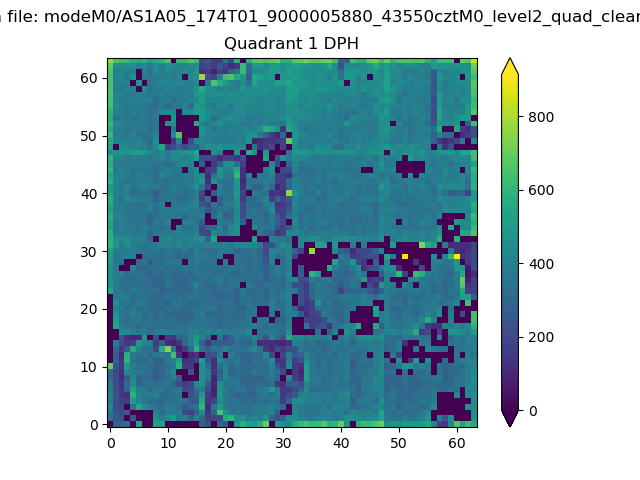 |
Quadrant B |
|---|---|---|---|
| Quadrant D | 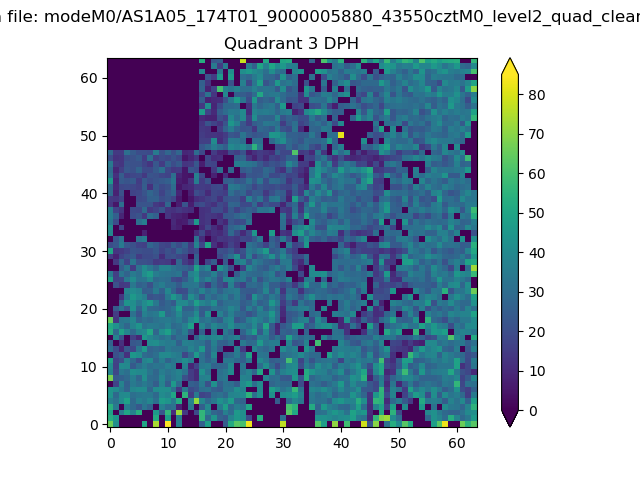 |
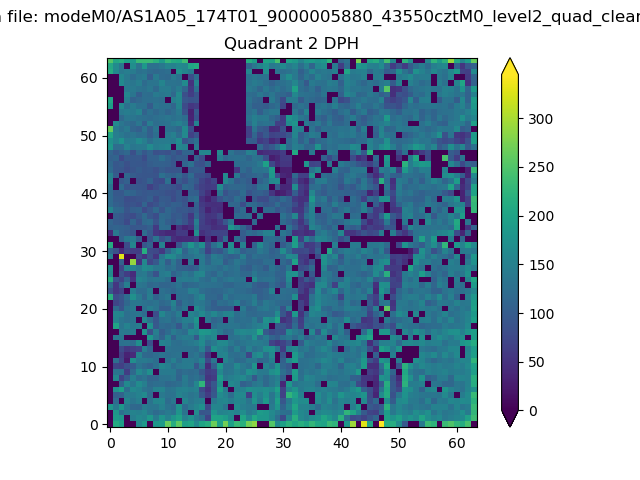 |
Quadrant C |
| Plot type | Count rate plots | Images |
|---|---|---|
| Comparison with Poisson distribution Blue bars denote a histogram of data divided into 1 sec bins. Red curve is a Poisson curve with rate = median count rate of data. |
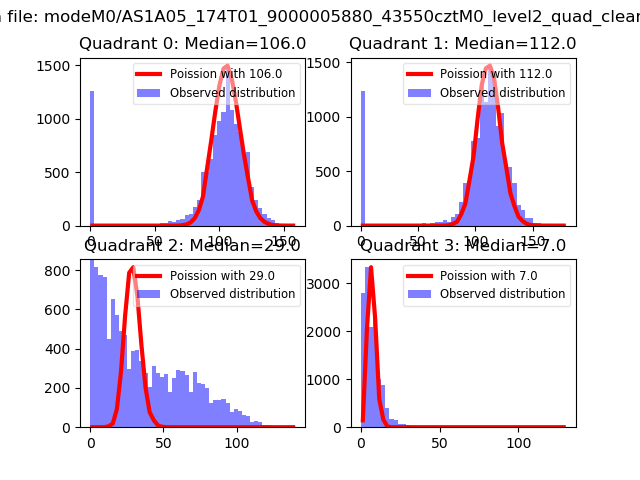 |
 |
| Quadrant-wise count rates Data is divided into 100 sec bins |
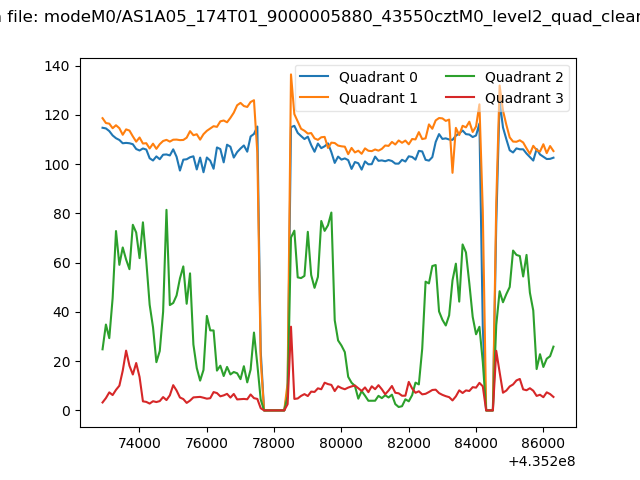 |
|
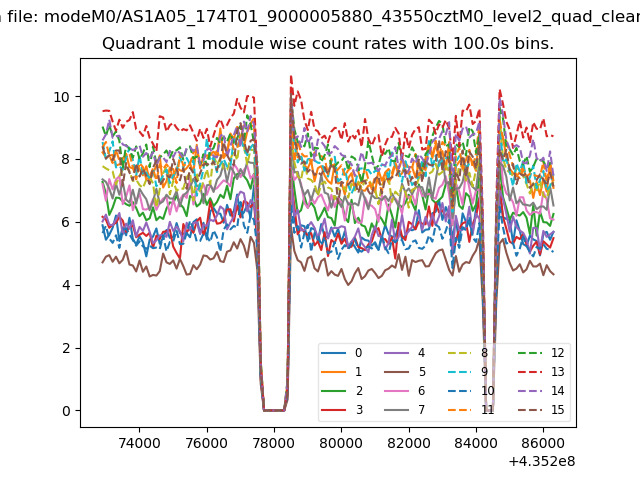
| Module-wise count rates for Quadrant A Data is divided into 100 sec bins |
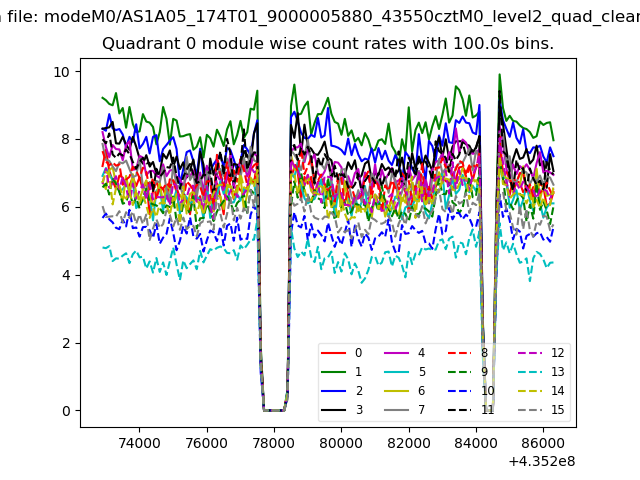 |
 |
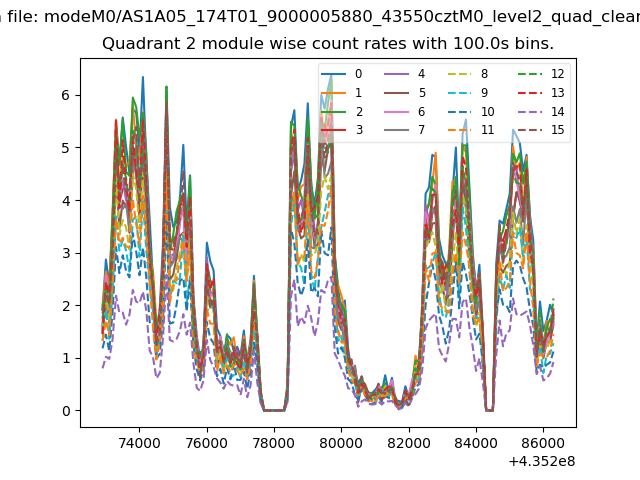
| Module-wise count rates for Quadrant B Data is divided into 100 sec bins |
 |
 |
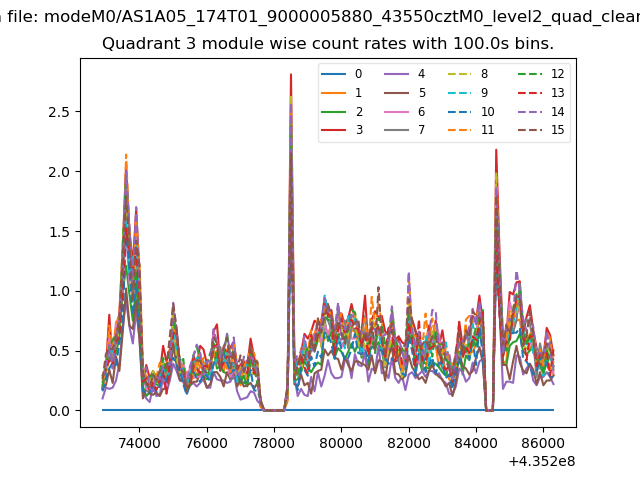
| Module-wise count rates for Quadrant C Data is divided into 100 sec bins |
 |
 |
| Module-wise count rates for Quadrant D Data is divided into 100 sec bins |
 |
 |
| Parameter | Plot |
|---|---|
| CZT HV Monitor | 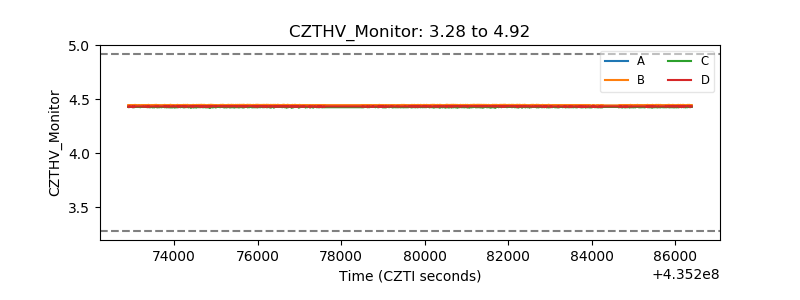 |
| D_VDD | 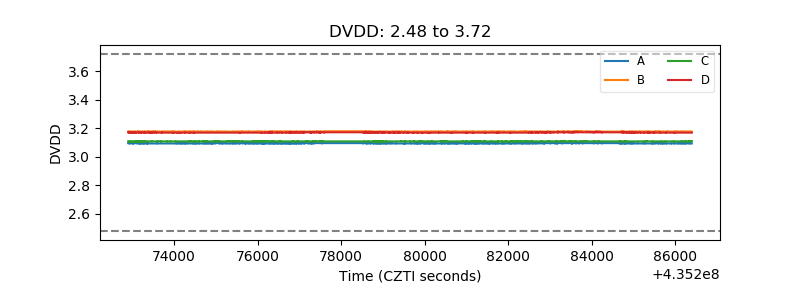 |
| Temperature 1 | 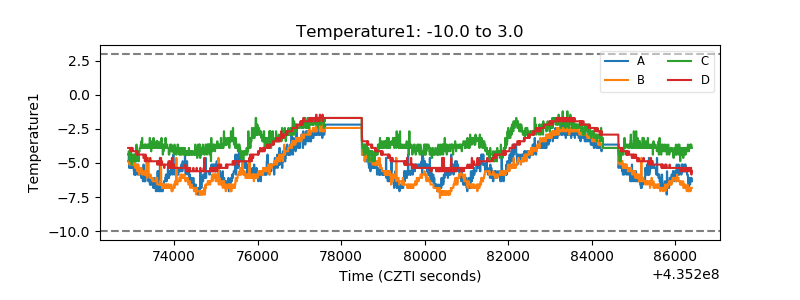 |
| Veto HV Monitor | 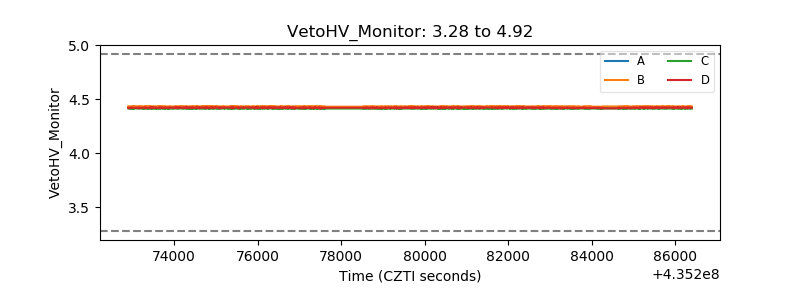 |
| Veto LLD | 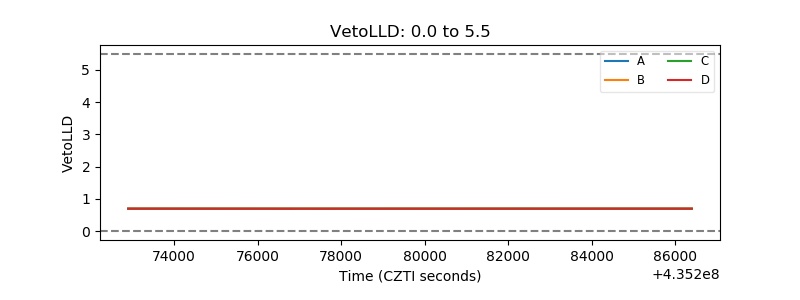 |
| Alpha Counter | 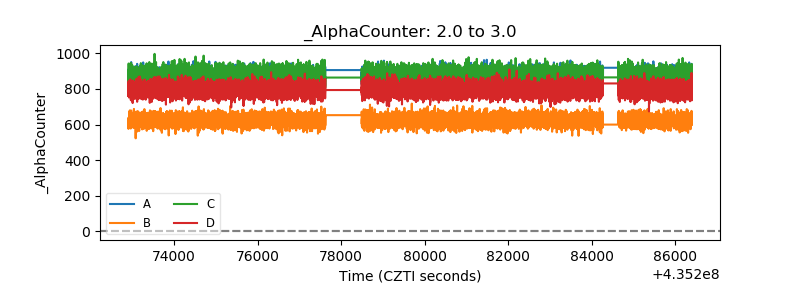 |
| _CPM_Rate | 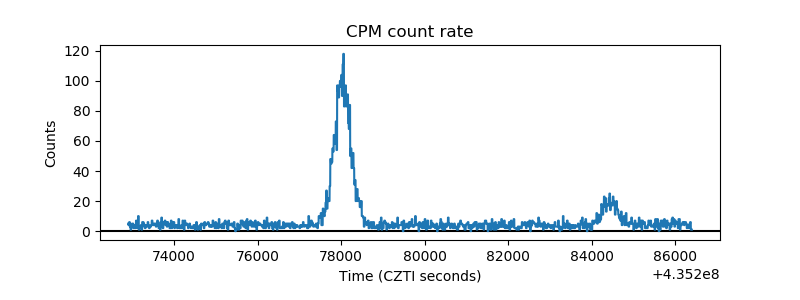 |
| CZT Counter | 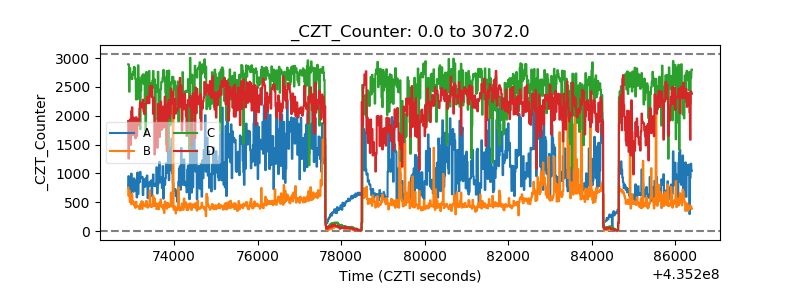 |
| +2.5 Volts monitor | 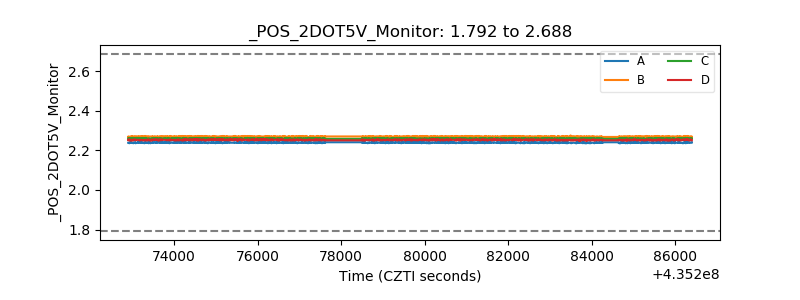 |
| +5 Volts monitor | 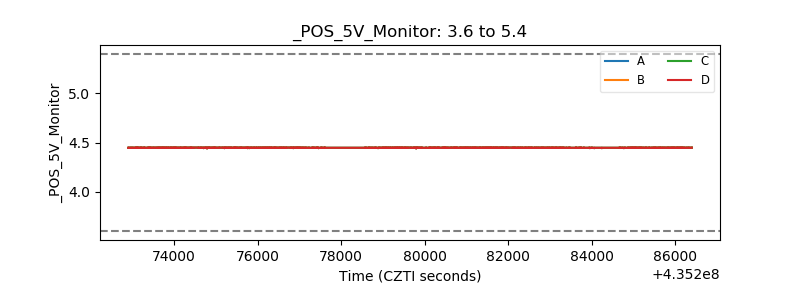 |
| _ROLL_ROT | 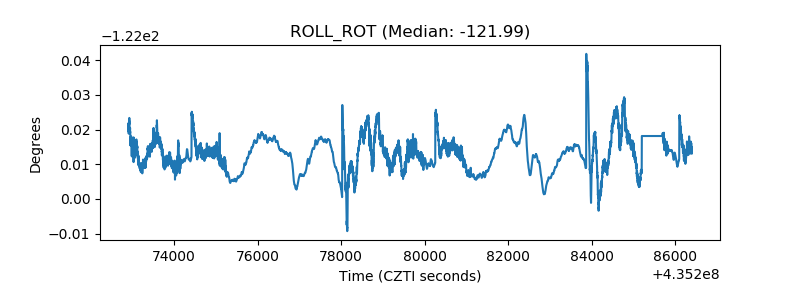 |
| _Roll_DEC | 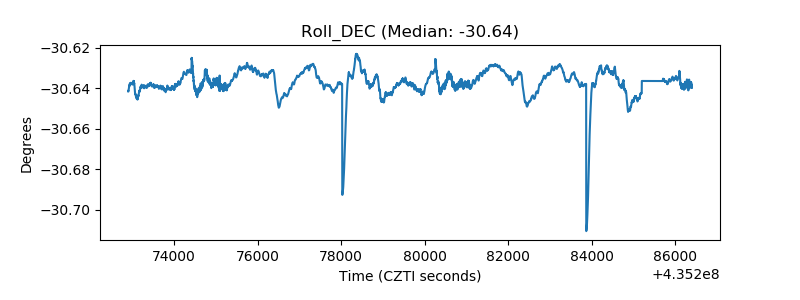 |
| _Roll_RA | 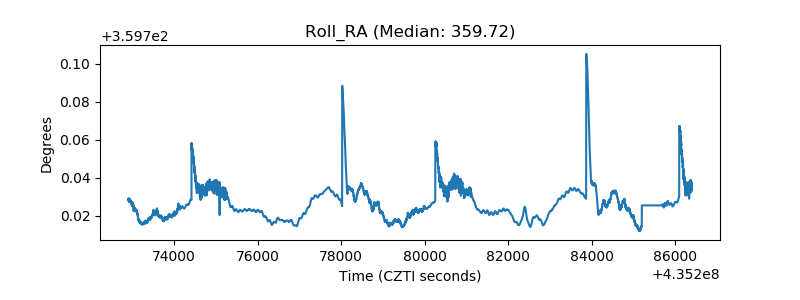 |
| Veto Counter | 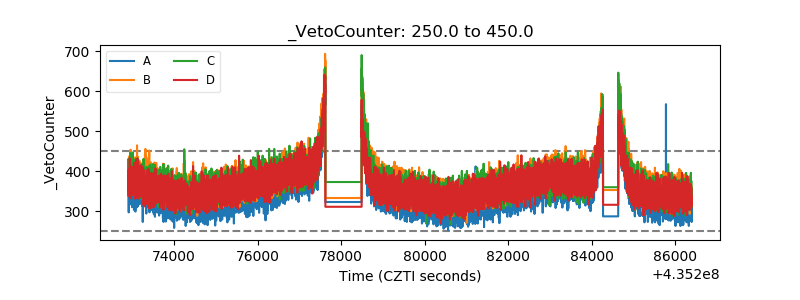 |