| Param | Original file | Final file |
|---|---|---|
| Filename | modeM0/AS1A05_174T01_9000005880_43552cztM0_level2.fits | modeM0/AS1A05_174T01_9000005880_43552cztM0_level2_quad_clean.evt |
| Size (bytes) | 1,342,114,560 | 88,669,440 |
| Size | 1.2 GB | 84.6 MB |
| Events in quadrant A | 11,219,833 | 717,696 |
| Events in quadrant B | 4,201,689 | 819,077 |
| Events in quadrant C | 16,245,442 | 561,767 |
| Events in quadrant D | 17,439,560 | 60,214 |
| Mode M0 | |||
|---|---|---|---|
| Quadrant | BADHDUFLAG | Total packets | Discarded packets |
| A | 0 | 38551 | 0 |
| B | 0 | 17527 | 0 |
| C | 0 | 53330 | 0 |
| D | 0 | 56847 | 0 |
| Mode SS | |||
|---|---|---|---|
| Quadrant | BADHDUFLAG | Total packets | Discarded packets |
| A | 0 | 150 | 0 |
| B | 0 | 150 | 0 |
| C | 0 | 150 | 0 |
| D | 0 | 150 | 0 |
| Quadrant | Total seconds | Saturated seconds | Saturation percentage |
|---|---|---|---|
| A | 7450 | 2661 | 35.718121% |
| B | 7451 | 156 | 2.093679% |
| C | 7451 | 5229 | 70.178500% |
| D | 7451 | 7451 | 100.000000% |
Noise dominated data is calculated using 1-second bins in cleaned event files. If a bin has >2000 counts, and if more than 50% of those come from <1% of pixels, then it is considered to be noise-dominated and hence unusable.
| Quadrant | # 1 sec bins | Bins with >0 counts | Bins with >2000 counts | High rate bins dominated by noise | Noise dominated (total time) | Noise dominated (detector-on time) | Marked lightcurve |
|---|---|---|---|---|---|---|---|
| A | 7450 | 7450 | 1502 | 1502 | 20.16% | 20.16% | 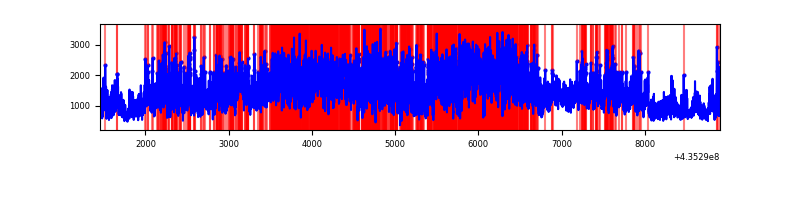 |
| B | 7451 | 7451 | 53 | 53 | 0.71% | 0.71% | 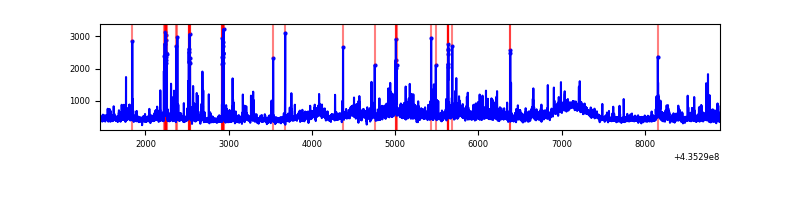 |
| C | 7451 | 7451 | 4764 | 4764 | 63.94% | 63.94% | 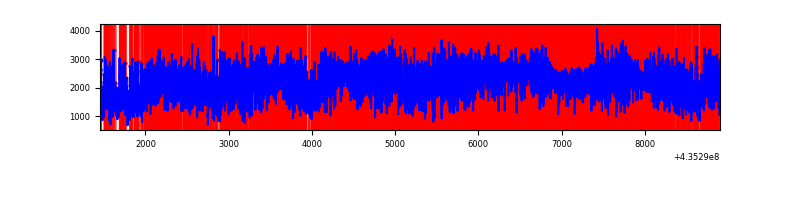 |
| D | 7450 | 7450 | 6751 | 6751 | 90.62% | 90.62% | 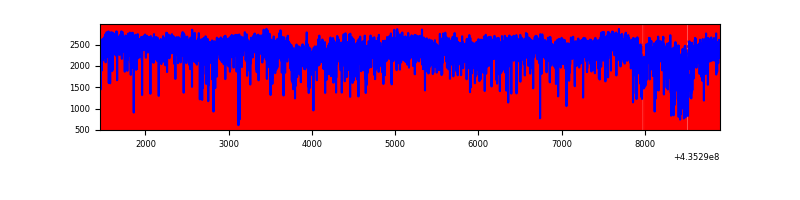 |
Top three noisy pixels from each quadrant. If the there are fewer than three noisy pixels in the level2.evt file, extra rows are filled as -1
| Pixel properties | Quadrant properties | ||||||
|---|---|---|---|---|---|---|---|
| Quadrant | DetID | PixID | Counts | Sigma | Mean | Median | Sigma |
| A | 0 | 228 | 4976051 | 31164.31 | 761 | 743 | 159.6 |
| A | 10 | 99 | 1360403 | 8516.63 | 761 | 743 | 159.6 |
| A | 15 | 222 | 629096 | 3935.87 | 761 | 743 | 159.6 |
| B | 3 | 42 | 225366 | 1346.96 | 844 | 820 | 166.7 |
| B | 0 | 230 | 224029 | 1338.94 | 844 | 820 | 166.7 |
| B | 3 | 25 | 214935 | 1284.38 | 844 | 820 | 166.7 |
| C | 15 | 142 | 7049934 | 49711.83 | 597 | 601 | 141.8 |
| C | 15 | 174 | 2941557 | 20739.6 | 597 | 601 | 141.8 |
| C | 15 | 158 | 1271130 | 8959.76 | 597 | 601 | 141.8 |
| D | 4 | 216 | 12487533 | 312261.15 | 93 | 87 | 40.0 |
| D | 4 | 212 | 869214 | 21733.4 | 93 | 87 | 40.0 |
| D | 13 | 187 | 868340 | 21711.54 | 93 | 87 | 40.0 |
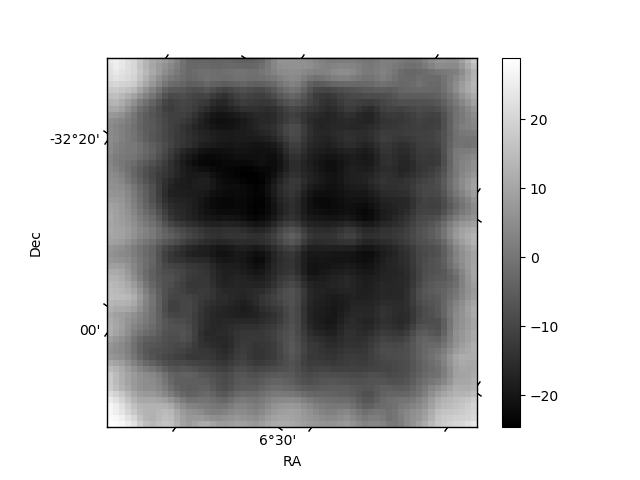
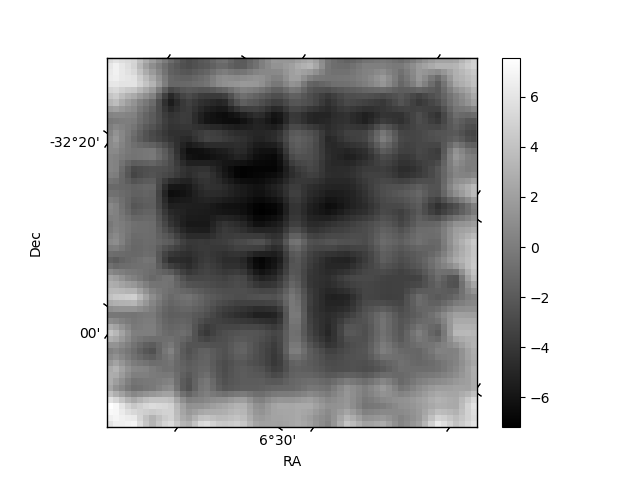
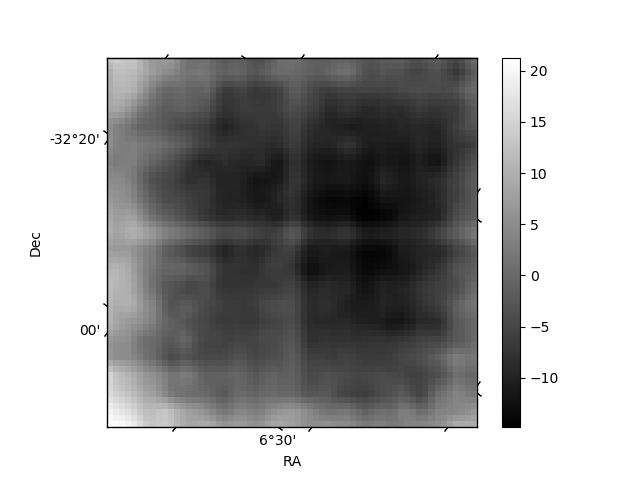
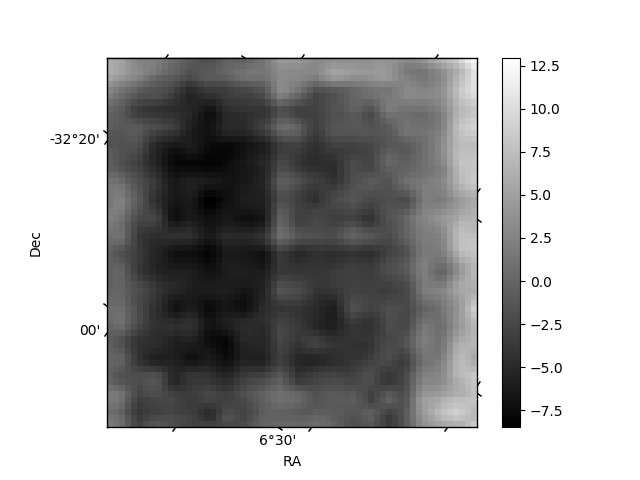
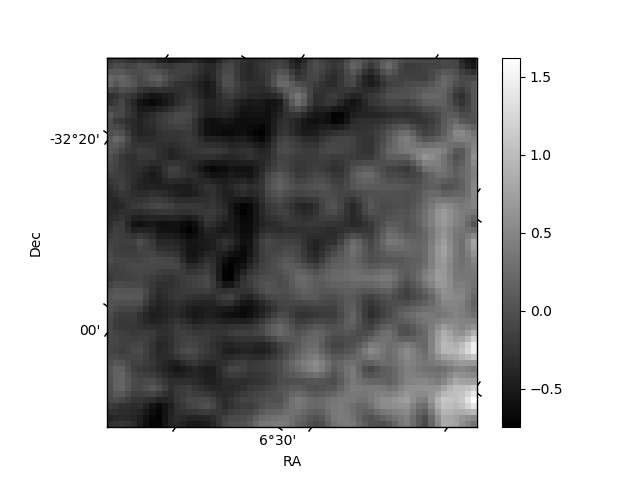
Histogram calculated using DETX and DETY for each event in the final _common_clean file
| Quadrant A | 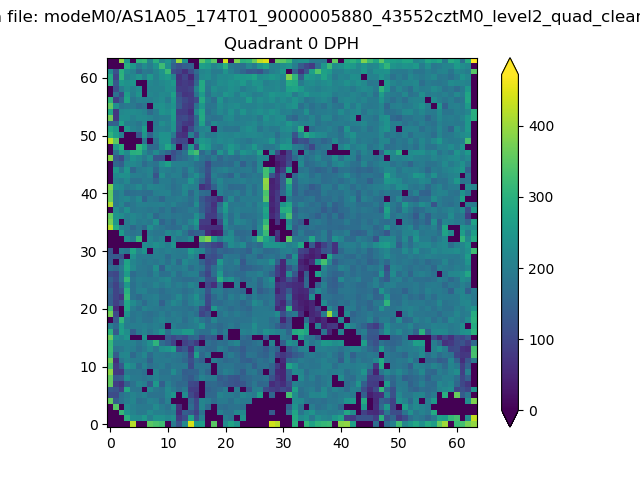 |
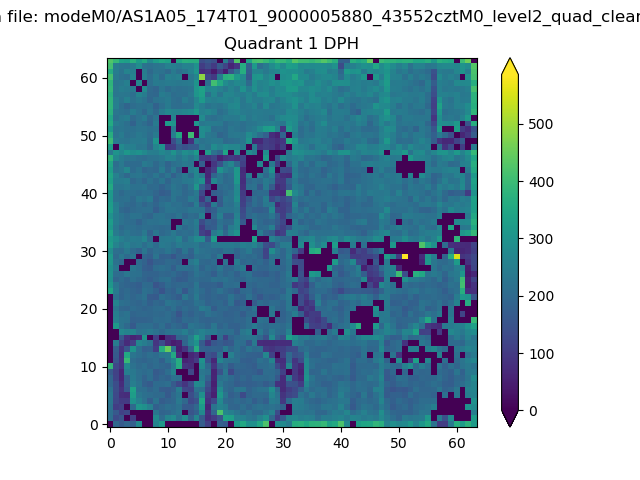 |
Quadrant B |
|---|---|---|---|
| Quadrant D | 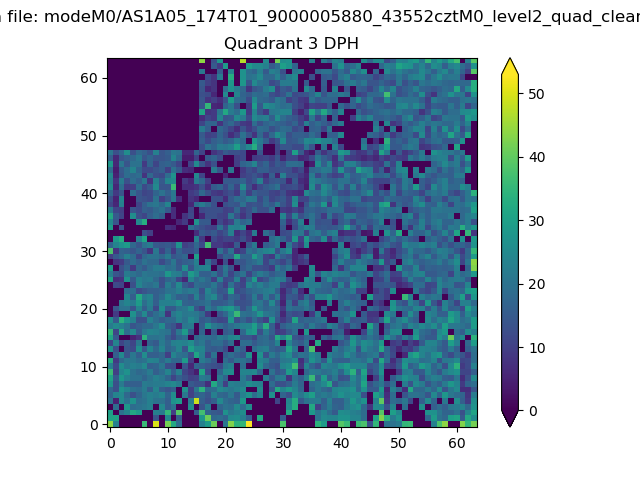 |
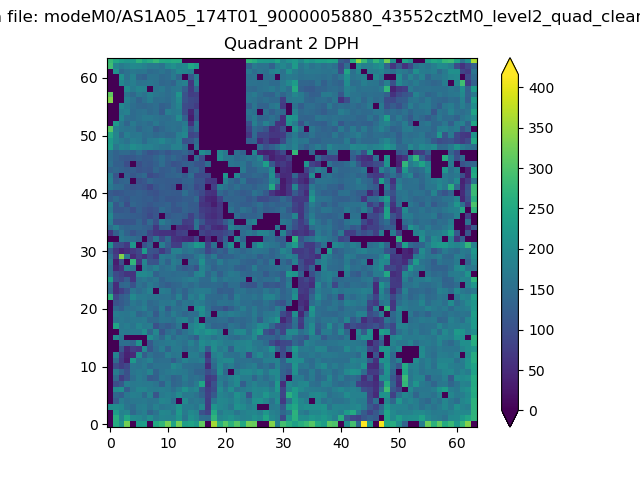 |
Quadrant C |
| Plot type | Count rate plots | Images |
|---|---|---|
| Comparison with Poisson distribution Blue bars denote a histogram of data divided into 1 sec bins. Red curve is a Poisson curve with rate = median count rate of data. |
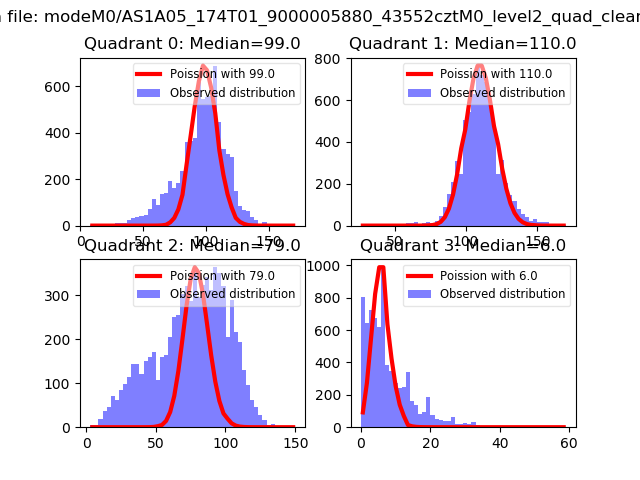 |
 |
| Quadrant-wise count rates Data is divided into 100 sec bins |
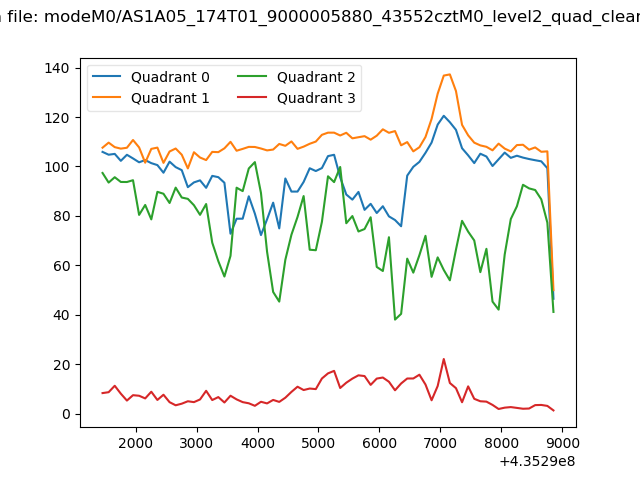 |
|
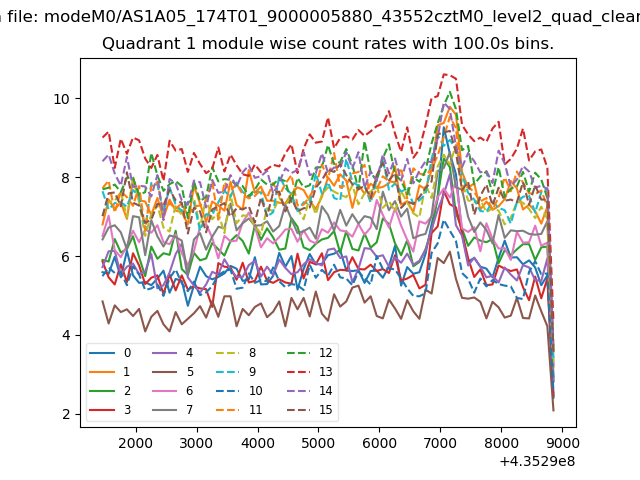
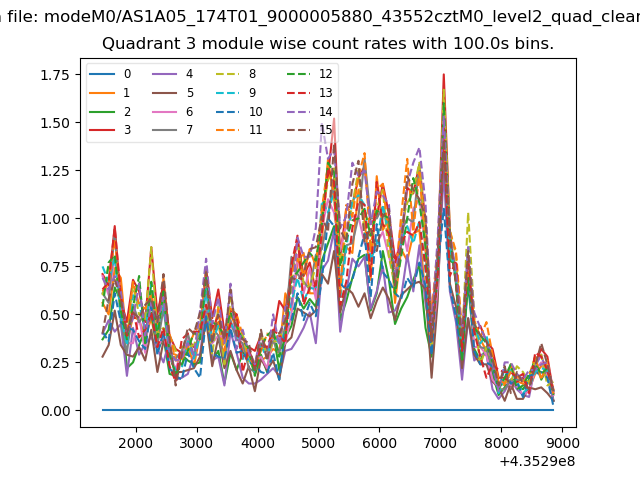
| Module-wise count rates for Quadrant A Data is divided into 100 sec bins |
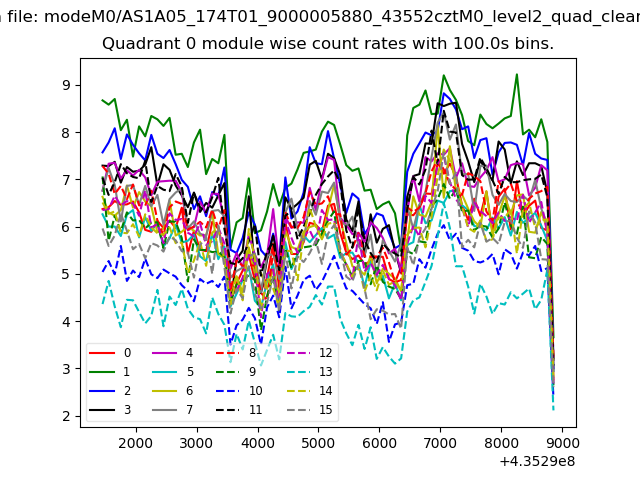 |
 |
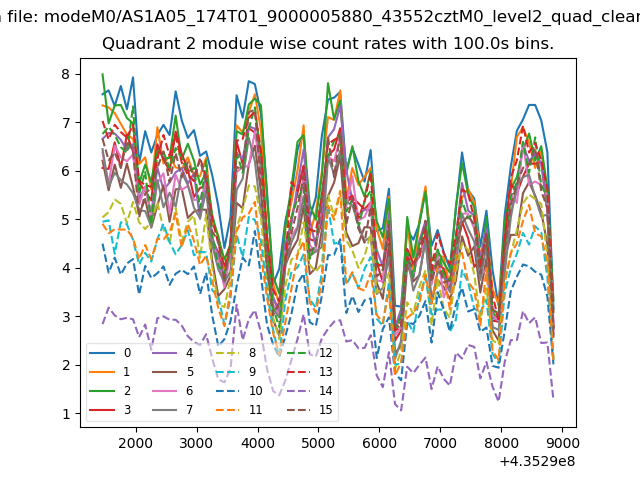
| Module-wise count rates for Quadrant B Data is divided into 100 sec bins |
 |
 |
| Module-wise count rates for Quadrant C Data is divided into 100 sec bins |
 |
 |
| Module-wise count rates for Quadrant D Data is divided into 100 sec bins |
 |
 |
| Parameter | Plot |
|---|---|
| CZT HV Monitor |  |
| D_VDD | 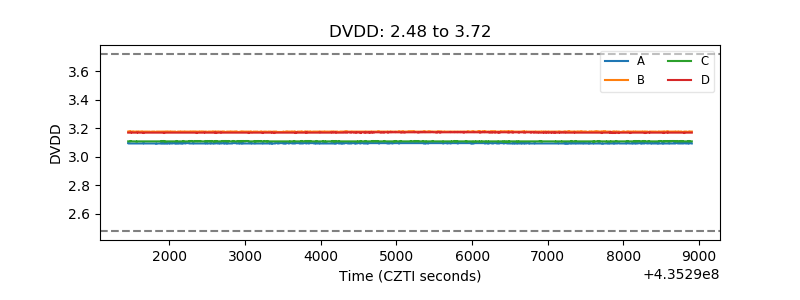 |
| Temperature 1 | 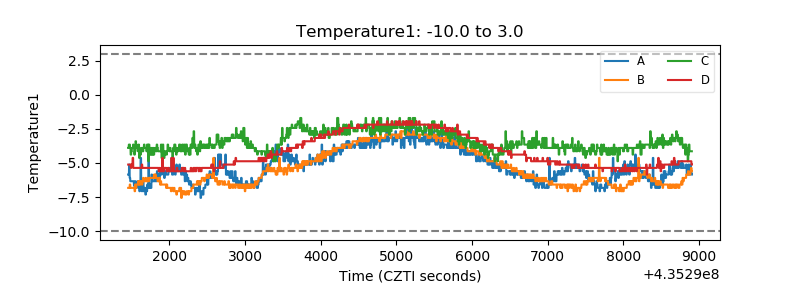 |
| Veto HV Monitor | 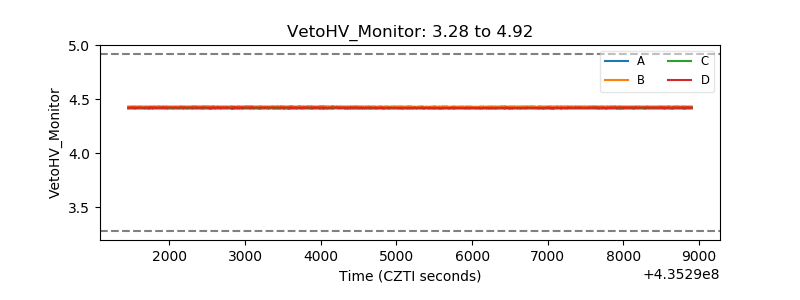 |
| Veto LLD | 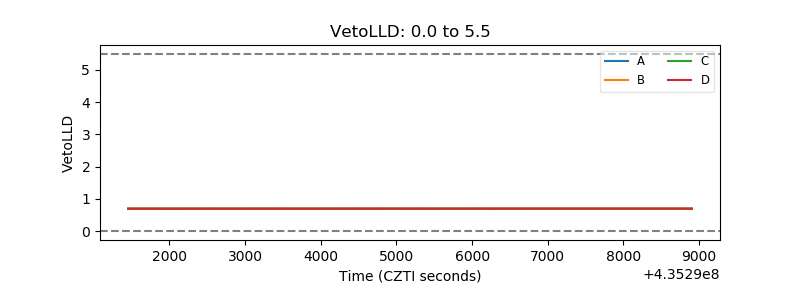 |
| Alpha Counter | 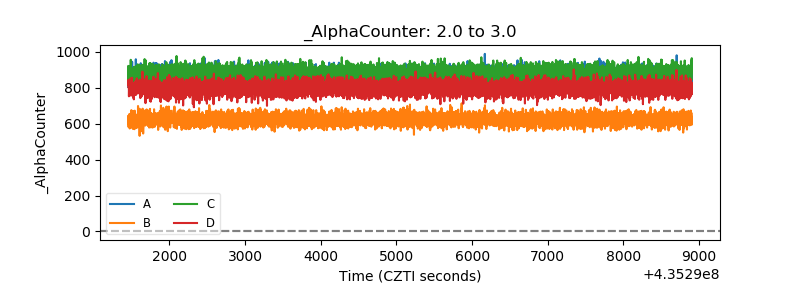 |
| _CPM_Rate | 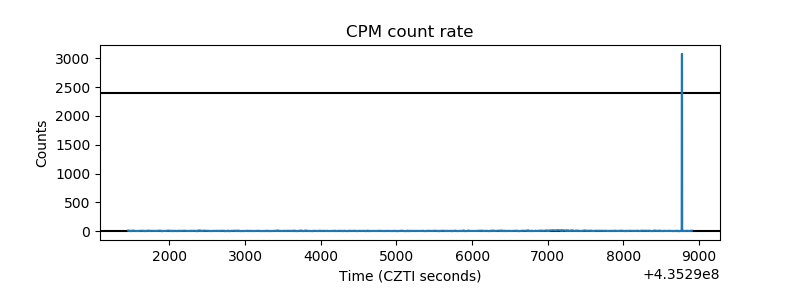 |
| CZT Counter | 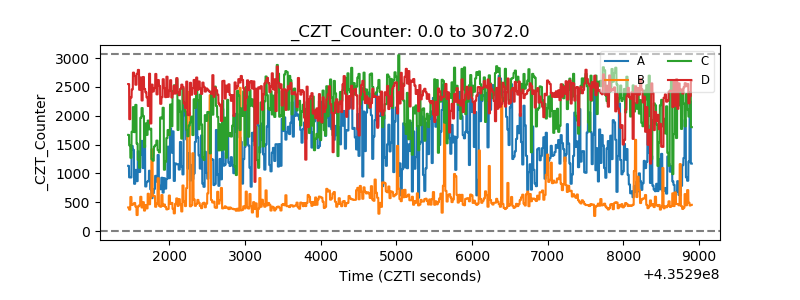 |
| +2.5 Volts monitor | 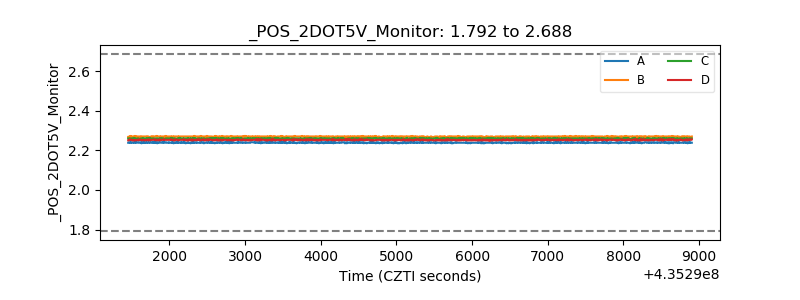 |
| +5 Volts monitor | 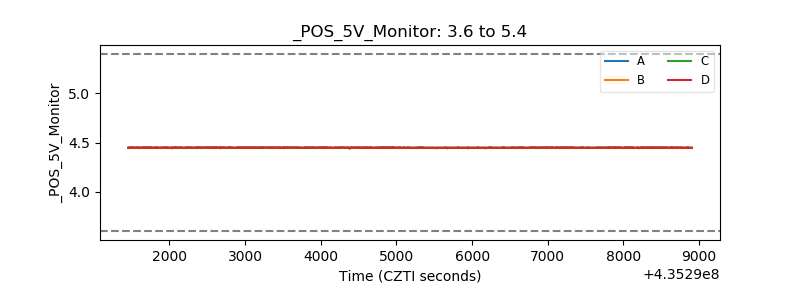 |
| _ROLL_ROT | 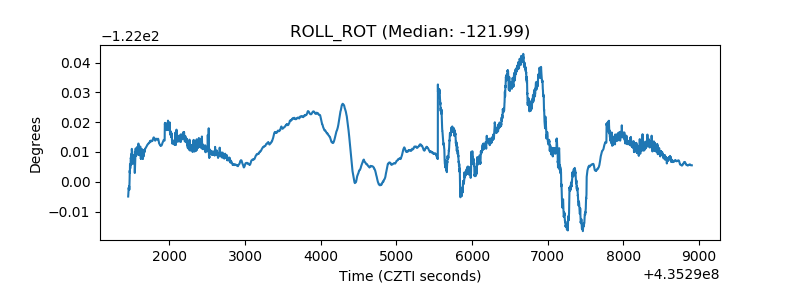 |
| _Roll_DEC | 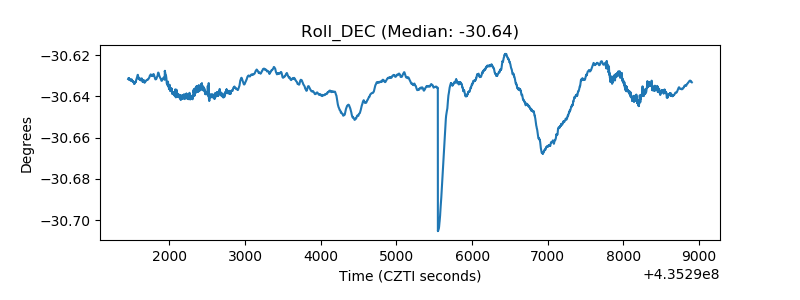 |
| _Roll_RA | 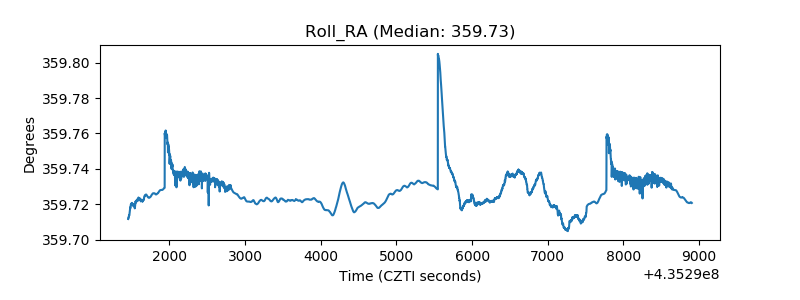 |
| Veto Counter | 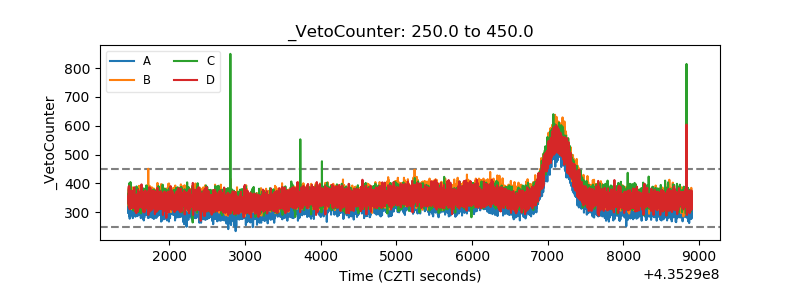 |