| Param | Original file | Final file |
|---|---|---|
| Filename | modeM0/AS1A05_174T01_9000005880_43556cztM0_level2.fits | modeM0/AS1A05_174T01_9000005880_43556cztM0_level2_quad_clean.evt |
| Size (bytes) | 934,315,200 | 80,406,720 |
| Size | 891.0 MB | 76.7 MB |
| Events in quadrant A | 5,839,666 | 657,912 |
| Events in quadrant B | 3,422,511 | 685,954 |
| Events in quadrant C | 13,137,802 | 526,511 |
| Events in quadrant D | 11,707,539 | 128,918 |
| Mode M9 | |||
|---|---|---|---|
| Quadrant | BADHDUFLAG | Total packets | Discarded packets |
| A | 0 | 9 | 0 |
| B | 0 | 9 | 0 |
| C | 0 | 9 | 0 |
| D | 0 | 9 | 0 |
| Mode M0 | |||
|---|---|---|---|
| Quadrant | BADHDUFLAG | Total packets | Discarded packets |
| A | 0 | 21879 | 1 |
| B | 0 | 14227 | 1 |
| C | 0 | 43255 | 1 |
| D | 0 | 39033 | 1 |
| Mode SS | |||
|---|---|---|---|
| Quadrant | BADHDUFLAG | Total packets | Discarded packets |
| A | 0 | 128 | 0 |
| B | 0 | 128 | 0 |
| C | 0 | 128 | 0 |
| D | 0 | 128 | 0 |
| Quadrant | Total seconds | Saturated seconds | Saturation percentage |
|---|---|---|---|
| A | 6160 | 348 | 5.649351% |
| B | 6160 | 162 | 2.629870% |
| C | 6161 | 4018 | 65.216686% |
| D | 6161 | 6145 | 99.740302% |
Noise dominated data is calculated using 1-second bins in cleaned event files. If a bin has >2000 counts, and if more than 50% of those come from <1% of pixels, then it is considered to be noise-dominated and hence unusable.
| Quadrant | # 1 sec bins | Bins with >0 counts | Bins with >2000 counts | High rate bins dominated by noise | Noise dominated (total time) | Noise dominated (detector-on time) | Marked lightcurve |
|---|---|---|---|---|---|---|---|
| A | 7035 | 6160 | 120 | 120 | 1.71% | 1.95% | 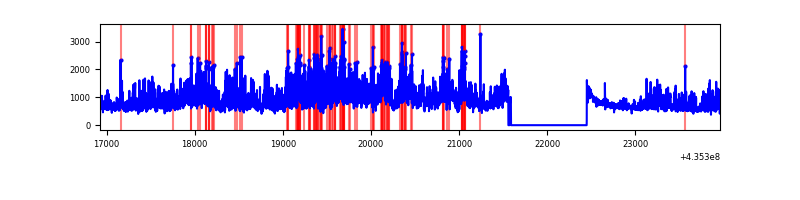 |
| B | 7035 | 6160 | 59 | 59 | 0.84% | 0.96% | 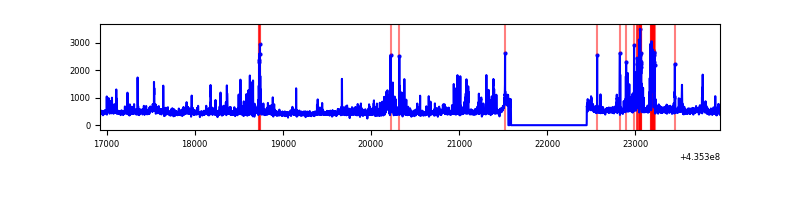 |
| C | 7036 | 6161 | 3590 | 3590 | 51.02% | 58.27% | 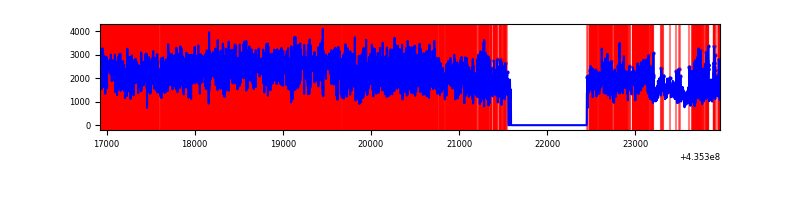 |
| D | 7035 | 6160 | 2529 | 2529 | 35.95% | 41.06% | 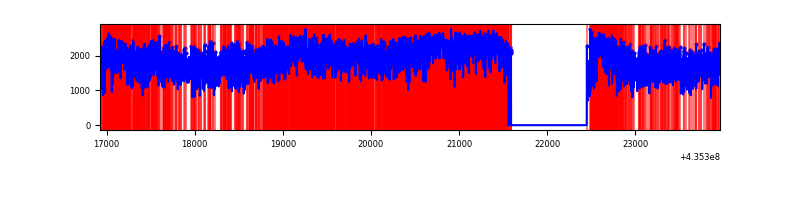 |
Top three noisy pixels from each quadrant. If the there are fewer than three noisy pixels in the level2.evt file, extra rows are filled as -1
| Pixel properties | Quadrant properties | ||||||
|---|---|---|---|---|---|---|---|
| Quadrant | DetID | PixID | Counts | Sigma | Mean | Median | Sigma |
| A | 0 | 228 | 1753191 | 12209.42 | 688 | 673 | 143.5 |
| A | 10 | 83 | 620812 | 4320.37 | 688 | 673 | 143.5 |
| A | 10 | 99 | 291098 | 2023.33 | 688 | 673 | 143.5 |
| B | 3 | 25 | 339812 | 2485.69 | 692 | 672 | 136.4 |
| B | 0 | 230 | 88982 | 647.26 | 692 | 672 | 136.4 |
| B | 3 | 42 | 84230 | 612.43 | 692 | 672 | 136.4 |
| C | 15 | 142 | 5226315 | 40645.7 | 542 | 547 | 128.6 |
| C | 15 | 158 | 2035829 | 15830.3 | 542 | 547 | 128.6 |
| C | 15 | 174 | 1630531 | 12677.92 | 542 | 547 | 128.6 |
| D | 4 | 212 | 3989624 | 73001.45 | 165 | 157 | 54.6 |
| D | 4 | 216 | 3433077 | 62817.45 | 165 | 157 | 54.6 |
| D | 14 | 210 | 503235 | 9205.6 | 165 | 157 | 54.6 |
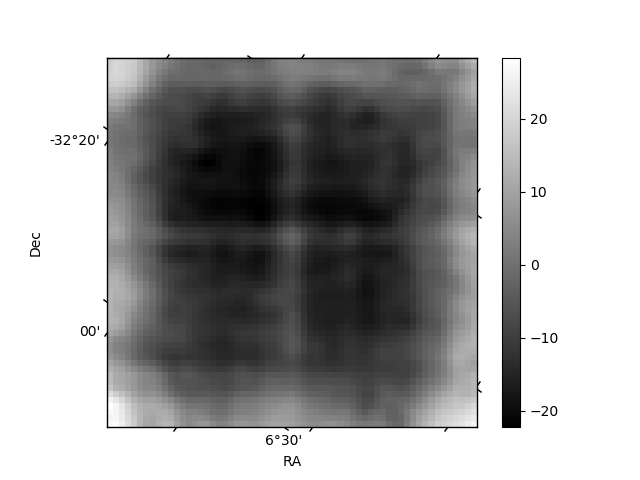
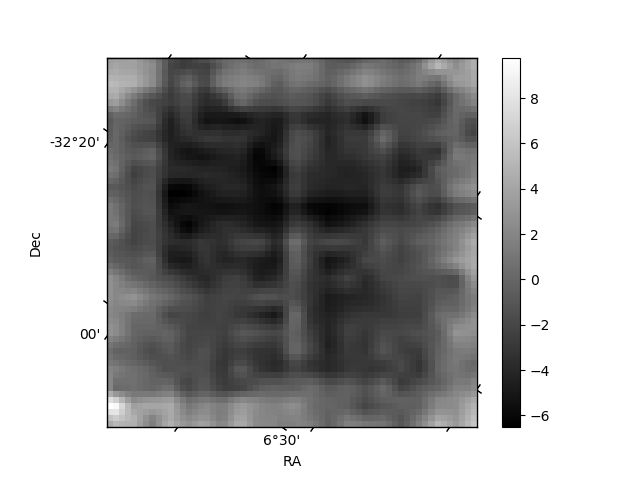
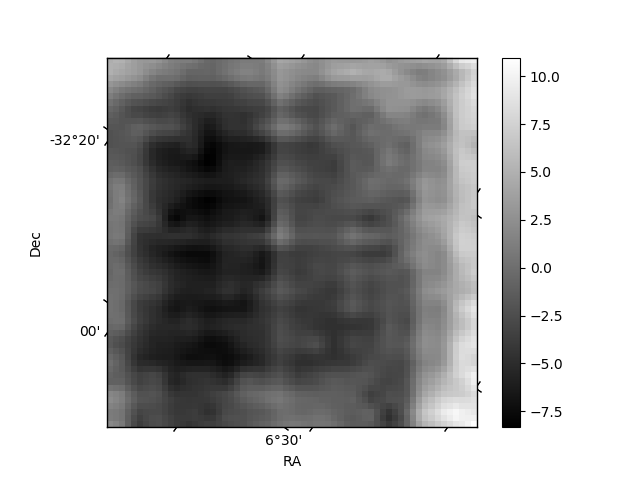
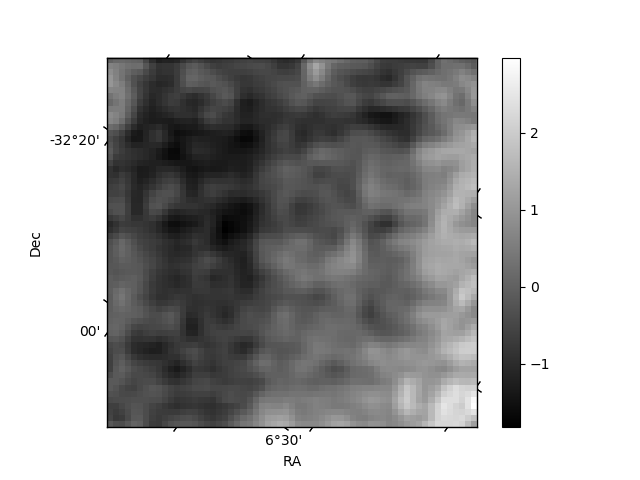
Histogram calculated using DETX and DETY for each event in the final _common_clean file
| Quadrant A | 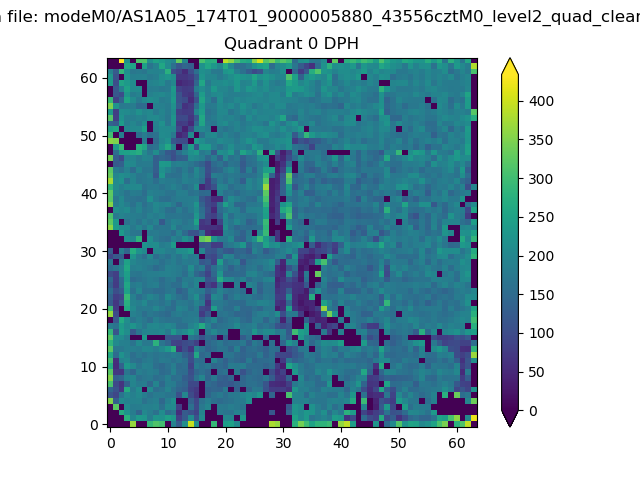 |
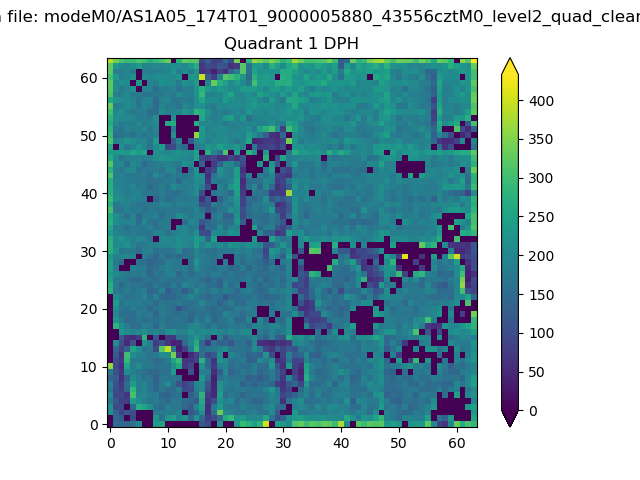 |
Quadrant B |
|---|---|---|---|
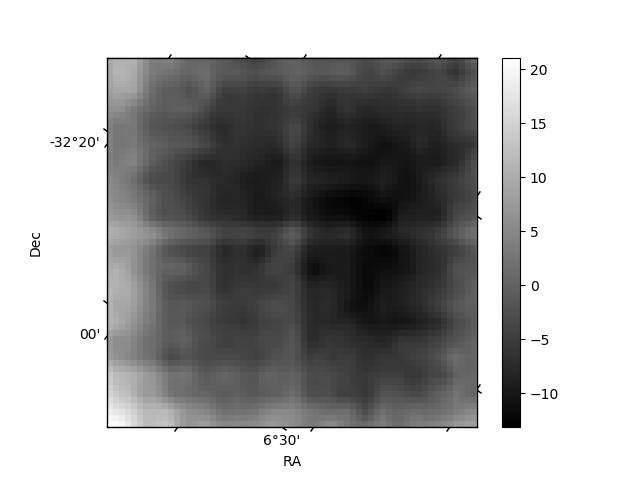
| Quadrant D | 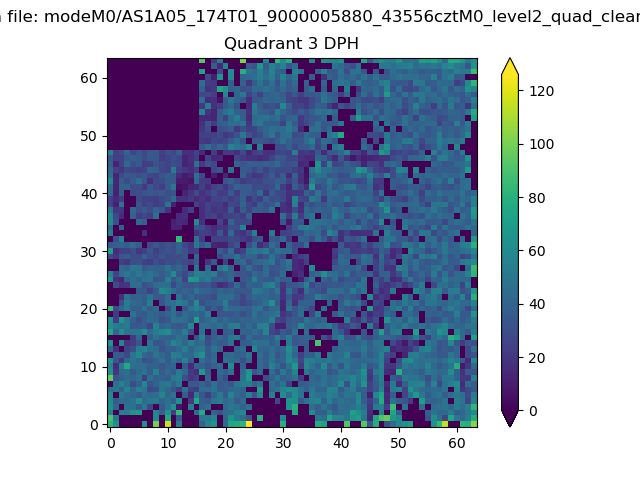 |
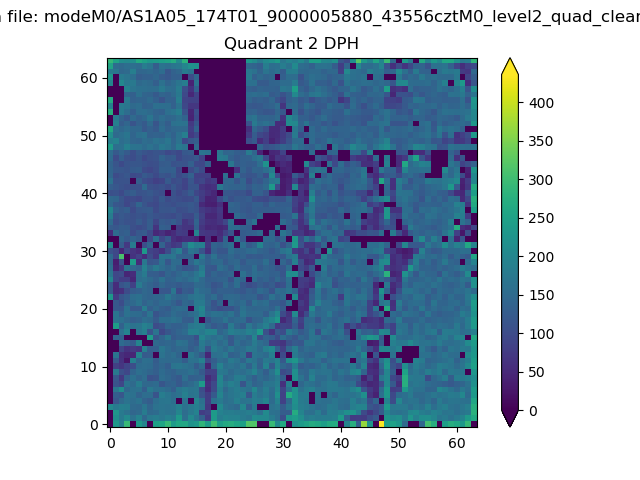 |
Quadrant C |
| Plot type | Count rate plots | Images |
|---|---|---|
| Comparison with Poisson distribution Blue bars denote a histogram of data divided into 1 sec bins. Red curve is a Poisson curve with rate = median count rate of data. |
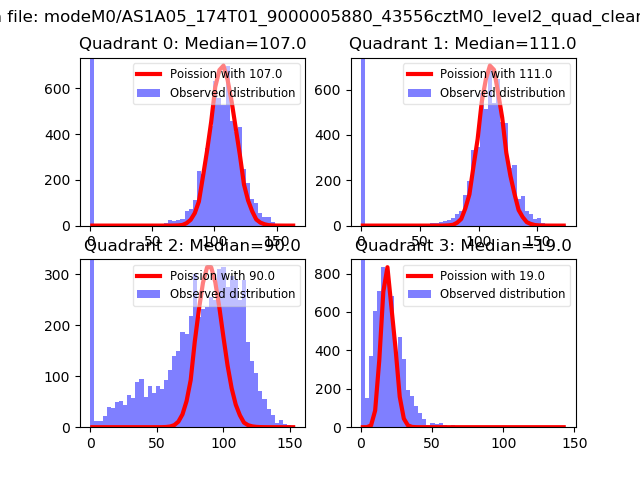 |
 |
| Quadrant-wise count rates Data is divided into 100 sec bins |
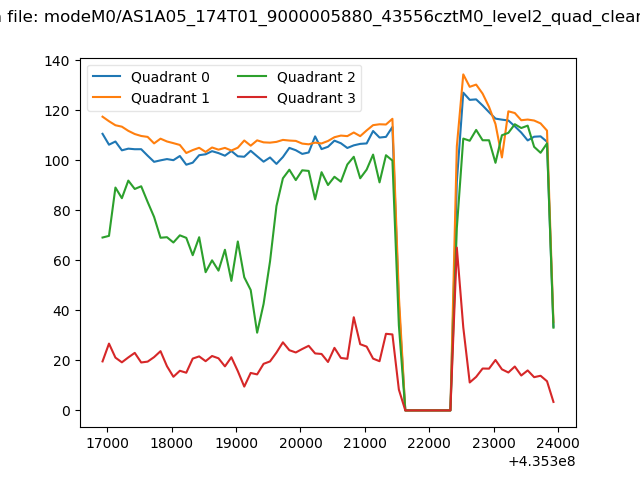 |
|
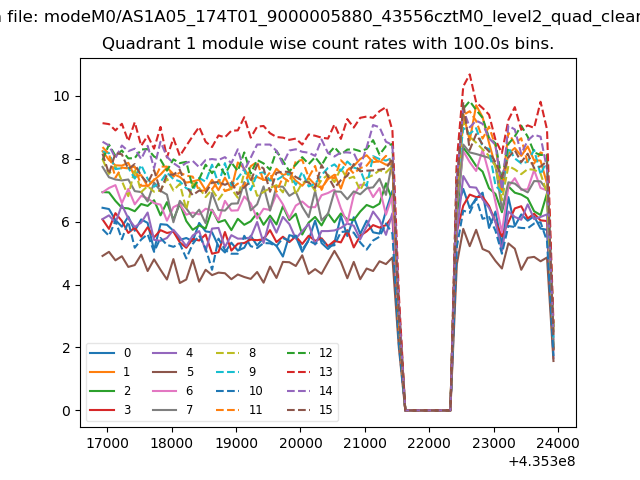
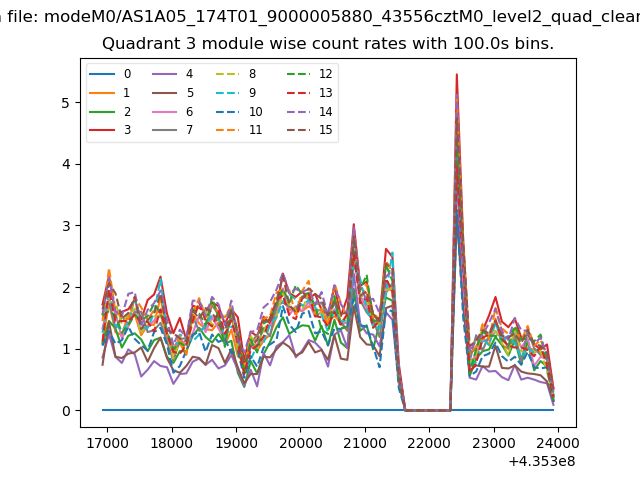
| Module-wise count rates for Quadrant A Data is divided into 100 sec bins |
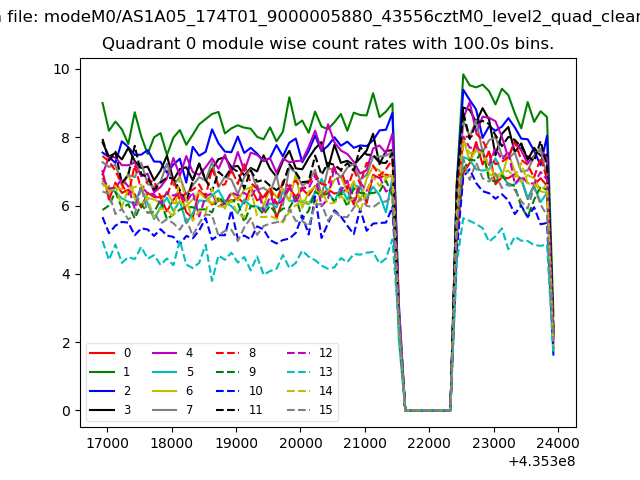 |
 |
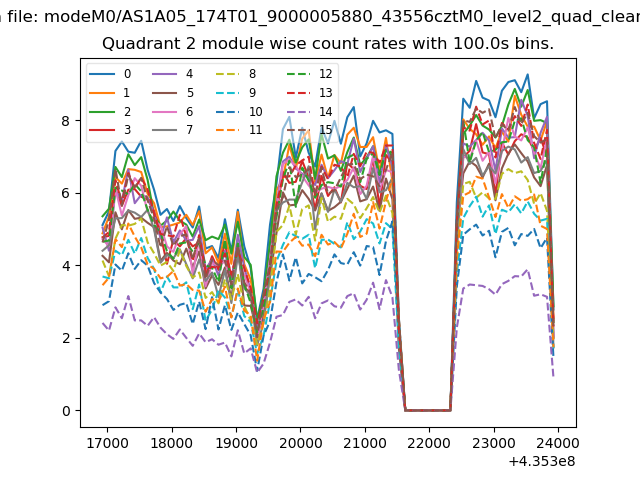
| Module-wise count rates for Quadrant B Data is divided into 100 sec bins |
 |
 |
| Module-wise count rates for Quadrant C Data is divided into 100 sec bins |
 |
 |
| Module-wise count rates for Quadrant D Data is divided into 100 sec bins |
 |
 |
| Parameter | Plot |
|---|---|
| CZT HV Monitor | 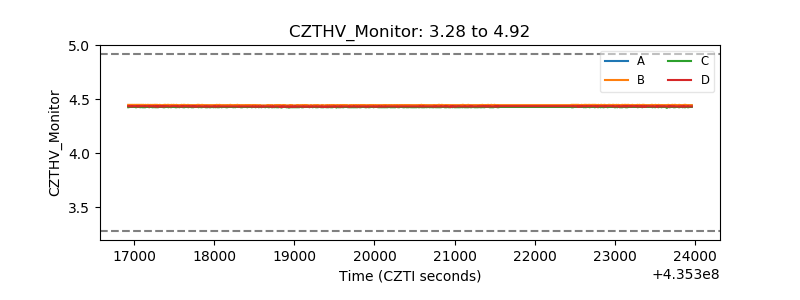 |
| D_VDD | 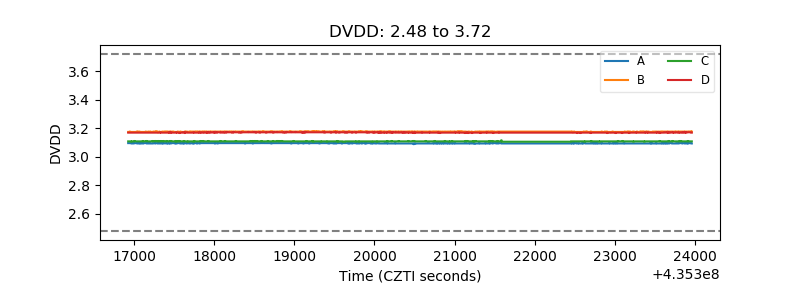 |
| Temperature 1 | 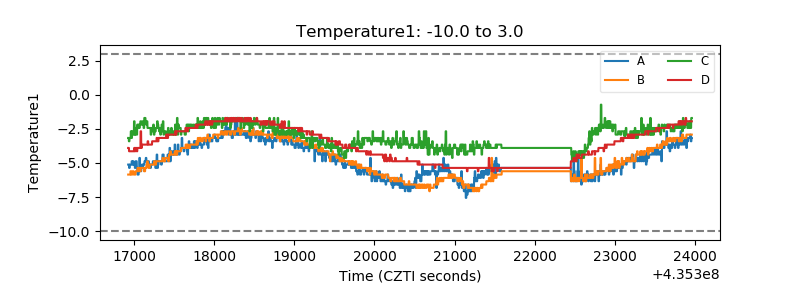 |
| Veto HV Monitor |  |
| Veto LLD | 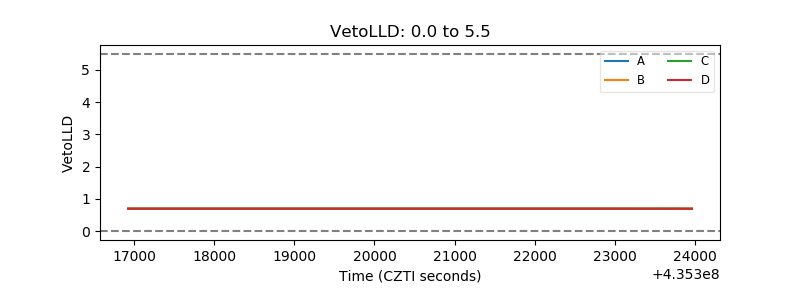 |
| Alpha Counter | 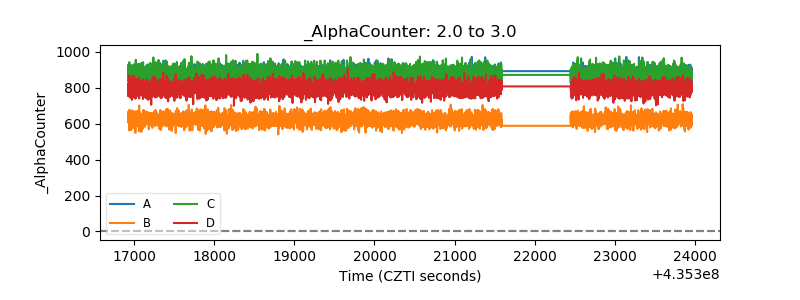 |
| _CPM_Rate | 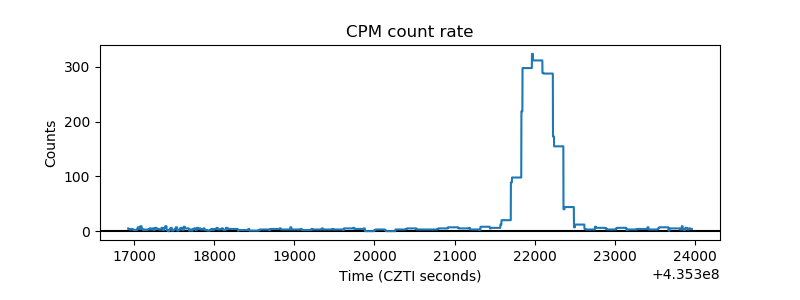 |
| CZT Counter | 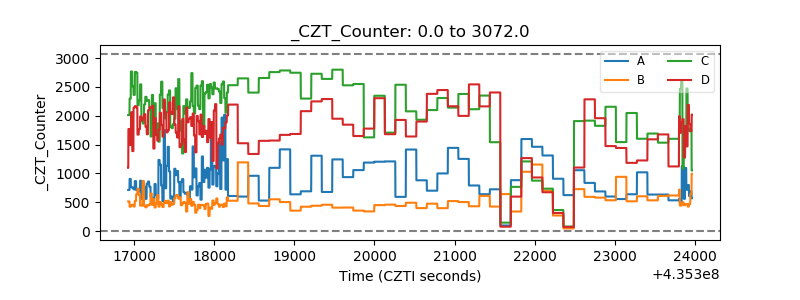 |
| +2.5 Volts monitor | 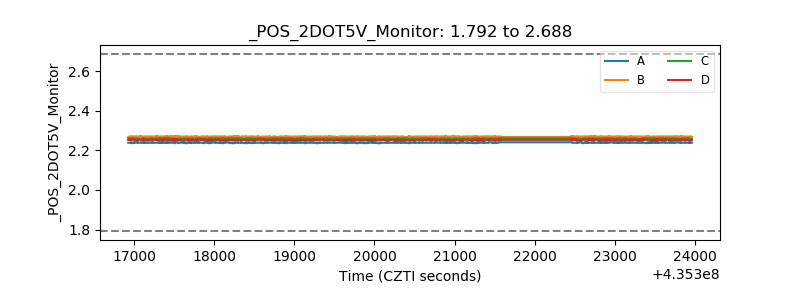 |
| +5 Volts monitor |  |
| _ROLL_ROT | 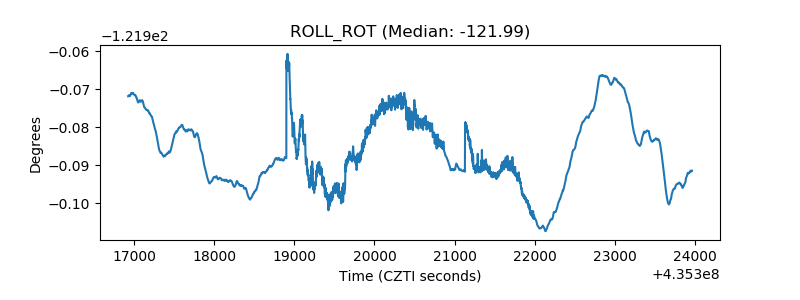 |
| _Roll_DEC | 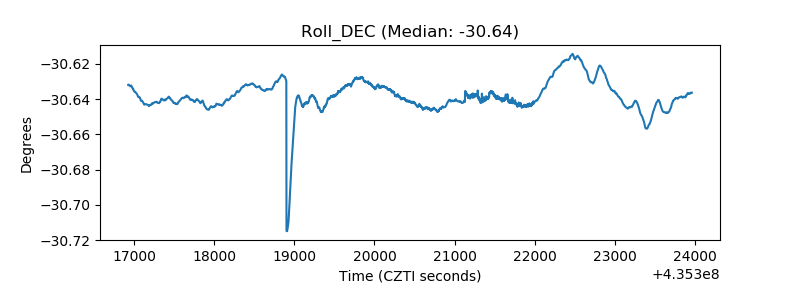 |
| _Roll_RA | 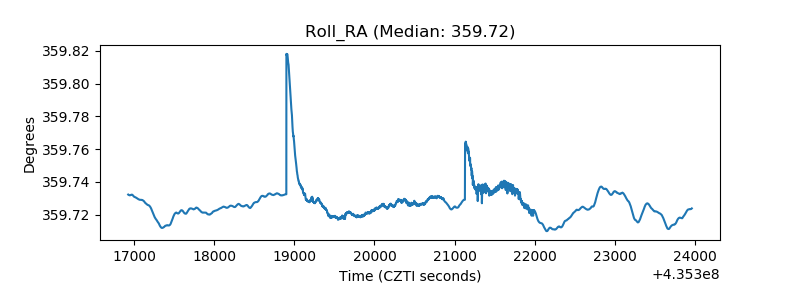 |
| Veto Counter | 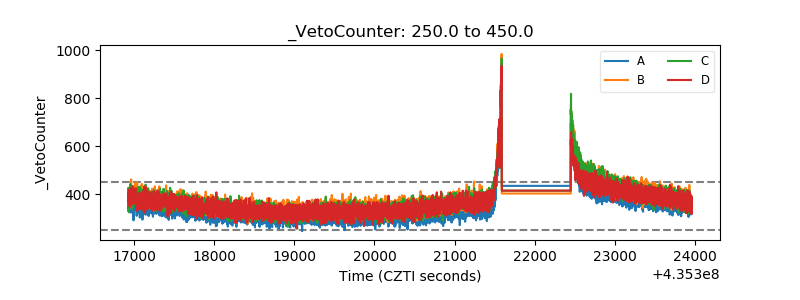 |