| Param | Original file | Final file |
|---|---|---|
| Filename | modeM0/AS1A05_174T01_9000005880_43559cztM0_level2.fits | modeM0/AS1A05_174T01_9000005880_43559cztM0_level2_quad_clean.evt |
| Size (bytes) | 919,428,480 | 76,034,880 |
| Size | 876.8 MB | 72.5 MB |
| Events in quadrant A | 5,133,323 | 681,670 |
| Events in quadrant B | 3,482,007 | 709,652 |
| Events in quadrant C | 13,799,863 | 377,131 |
| Events in quadrant D | 11,164,060 | 118,456 |
| Mode M9 | |||
|---|---|---|---|
| Quadrant | BADHDUFLAG | Total packets | Discarded packets |
| A | 0 | 11 | 0 |
| B | 0 | 11 | 0 |
| C | 0 | 11 | 0 |
| D | 0 | 11 | 0 |
| Mode M0 | |||
|---|---|---|---|
| Quadrant | BADHDUFLAG | Total packets | Discarded packets |
| A | 0 | 19718 | 1 |
| B | 0 | 14267 | 1 |
| C | 0 | 44927 | 3 |
| D | 0 | 37229 | 1 |
| Mode SS | |||
|---|---|---|---|
| Quadrant | BADHDUFLAG | Total packets | Discarded packets |
| A | 0 | 120 | 0 |
| B | 0 | 120 | 0 |
| C | 0 | 120 | 0 |
| D | 0 | 120 | 0 |
| Quadrant | Total seconds | Saturated seconds | Saturation percentage |
|---|---|---|---|
| A | 5868 | 281 | 4.788684% |
| B | 5869 | 134 | 2.283183% |
| C | 5868 | 4720 | 80.436264% |
| D | 5868 | 5852 | 99.727335% |
Noise dominated data is calculated using 1-second bins in cleaned event files. If a bin has >2000 counts, and if more than 50% of those come from <1% of pixels, then it is considered to be noise-dominated and hence unusable.
| Quadrant | # 1 sec bins | Bins with >0 counts | Bins with >2000 counts | High rate bins dominated by noise | Noise dominated (total time) | Noise dominated (detector-on time) | Marked lightcurve |
|---|---|---|---|---|---|---|---|
| A | 6973 | 5868 | 51 | 51 | 0.73% | 0.87% | 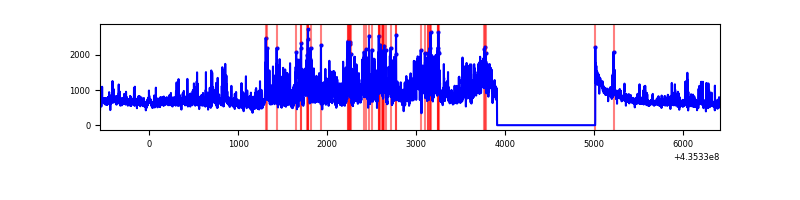 |
| B | 6974 | 5869 | 24 | 24 | 0.34% | 0.41% | 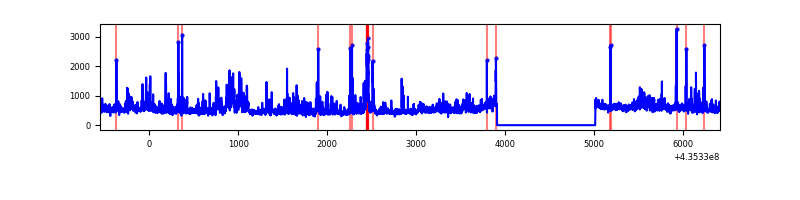 |
| C | 6972 | 5867 | 4483 | 4483 | 64.30% | 76.41% | 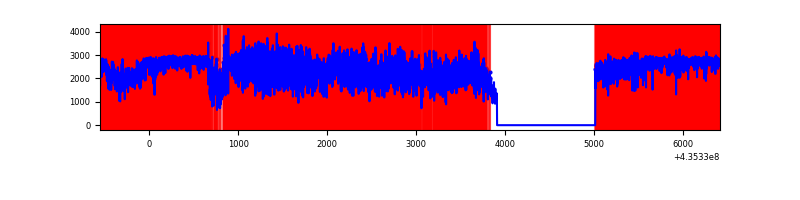 |
| D | 6972 | 5867 | 2430 | 2430 | 34.85% | 41.42% | 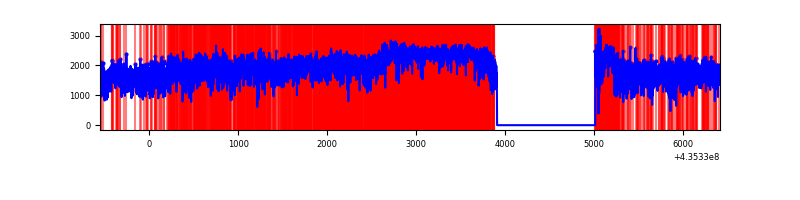 |
Top three noisy pixels from each quadrant. If the there are fewer than three noisy pixels in the level2.evt file, extra rows are filled as -1
| Pixel properties | Quadrant properties | ||||||
|---|---|---|---|---|---|---|---|
| Quadrant | DetID | PixID | Counts | Sigma | Mean | Median | Sigma |
| A | 0 | 228 | 1182479 | 8411.14 | 686 | 673 | 140.5 |
| A | 10 | 83 | 625679 | 4448.29 | 686 | 673 | 140.5 |
| A | 15 | 222 | 385662 | 2740.04 | 686 | 673 | 140.5 |
| B | 3 | 25 | 221041 | 1630.87 | 688 | 667 | 135.1 |
| B | 0 | 199 | 120474 | 886.63 | 688 | 667 | 135.1 |
| B | 3 | 42 | 116905 | 860.21 | 688 | 667 | 135.1 |
| C | 15 | 142 | 5122353 | 56166.03 | 380 | 382 | 91.2 |
| C | 15 | 126 | 4681425 | 51330.94 | 380 | 382 | 91.2 |
| C | 15 | 158 | 1190117 | 13046.28 | 380 | 382 | 91.2 |
| D | 4 | 212 | 3654031 | 78262.06 | 146 | 139 | 46.7 |
| D | 4 | 216 | 3559303 | 76233.1 | 146 | 139 | 46.7 |
| D | 14 | 210 | 517465 | 11080.51 | 146 | 139 | 46.7 |
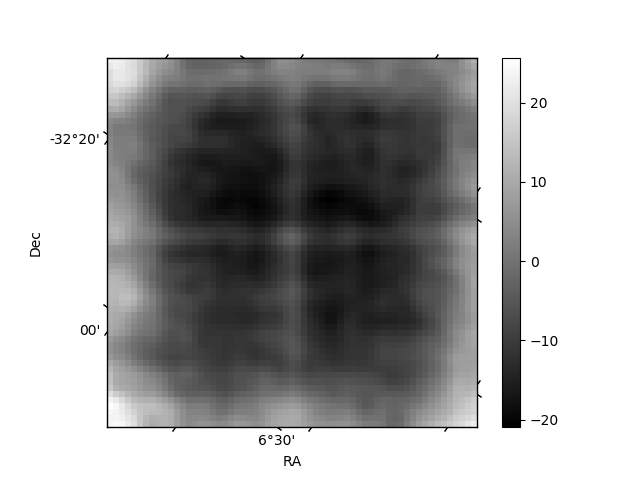
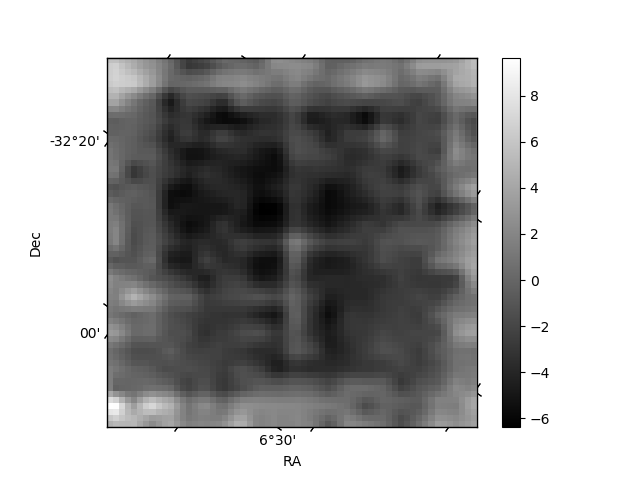
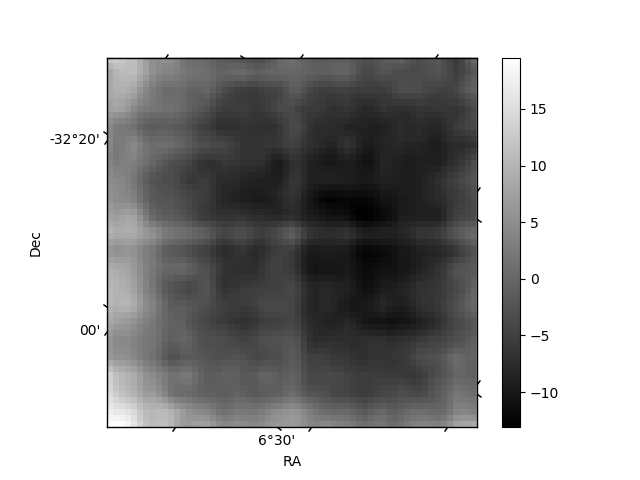
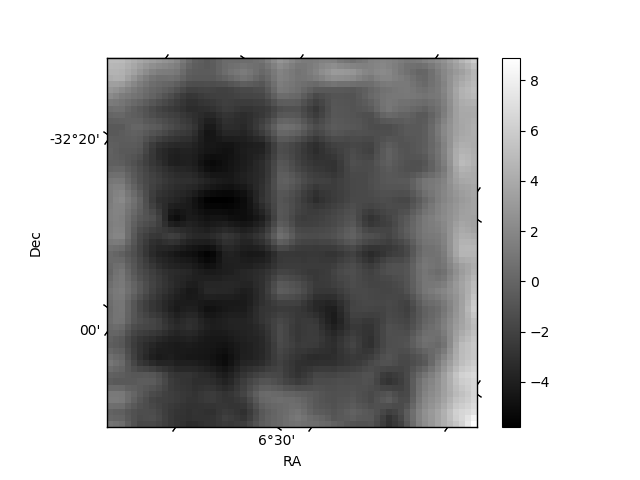
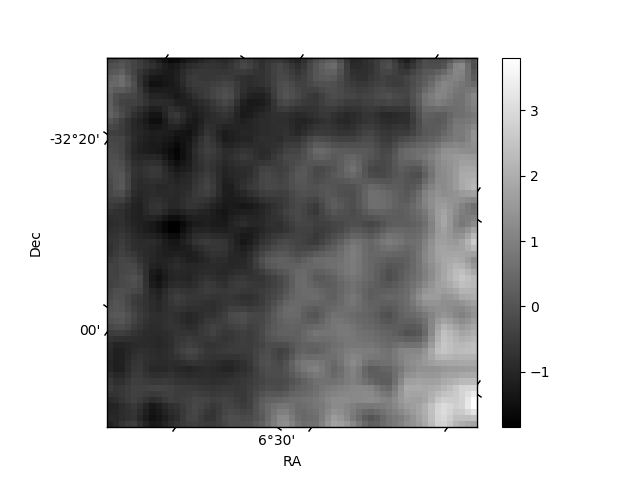
Histogram calculated using DETX and DETY for each event in the final _common_clean file
| Quadrant A | 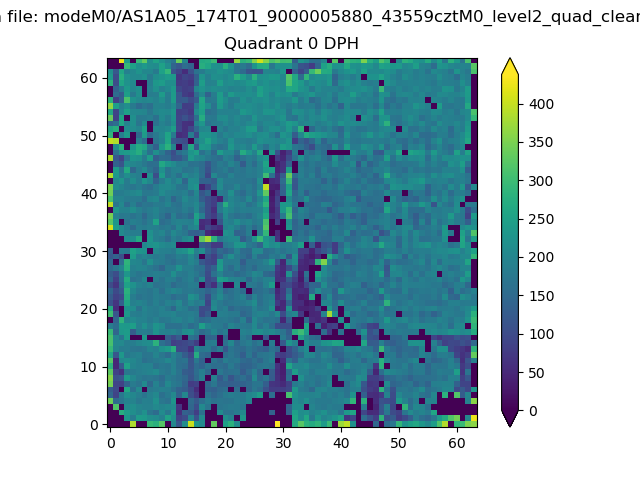 |
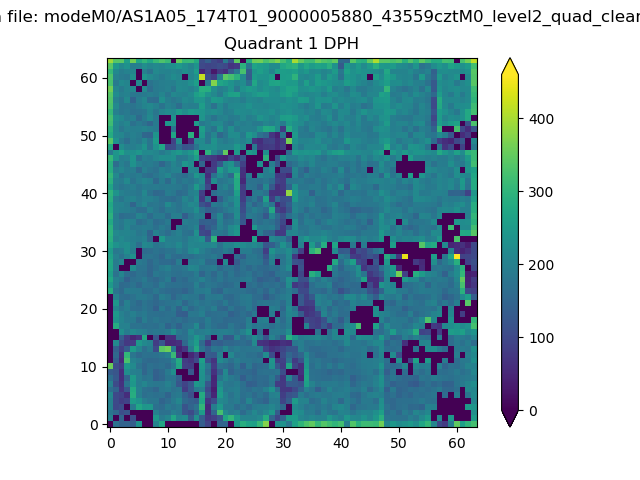 |
Quadrant B |
|---|---|---|---|
| Quadrant D | 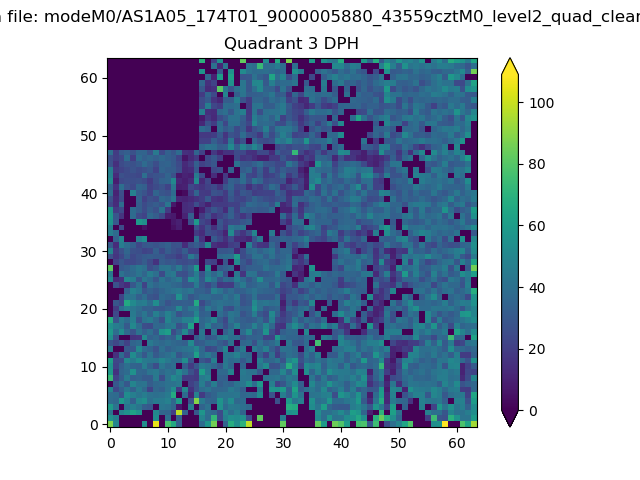 |
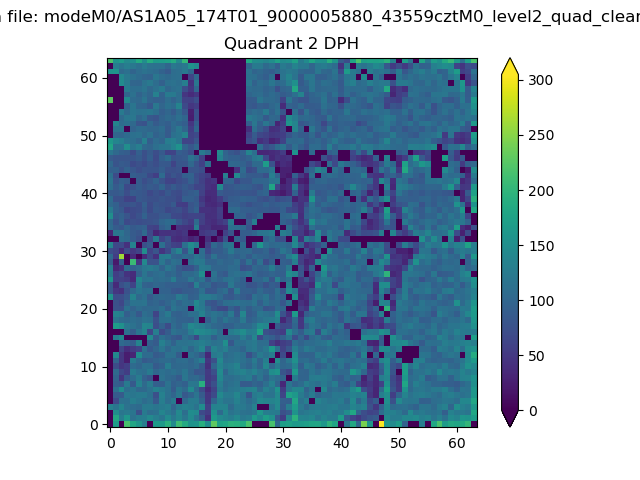 |
Quadrant C |
| Plot type | Count rate plots | Images |
|---|---|---|
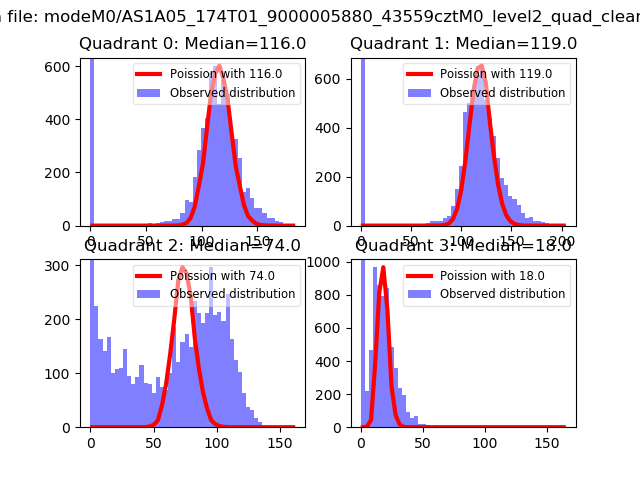
| Comparison with Poisson distribution Blue bars denote a histogram of data divided into 1 sec bins. Red curve is a Poisson curve with rate = median count rate of data. |
 |
 |
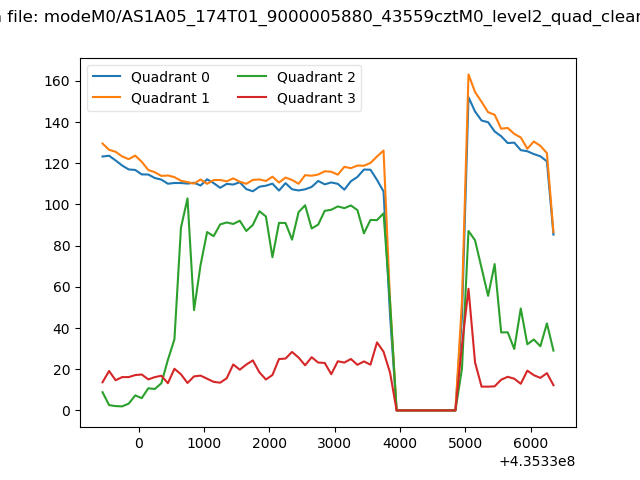
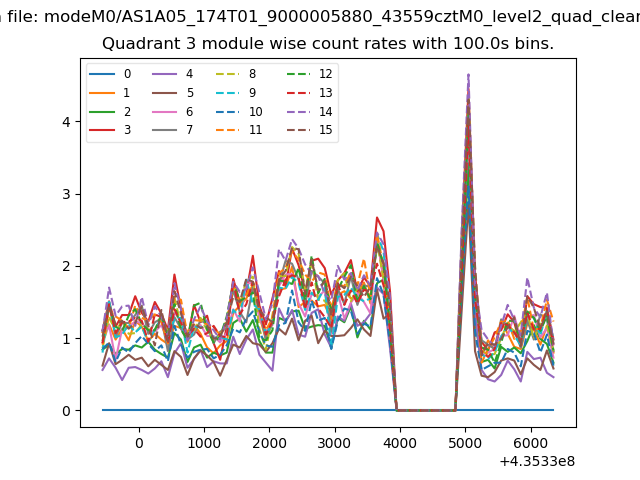
| Quadrant-wise count rates Data is divided into 100 sec bins |
 |
|
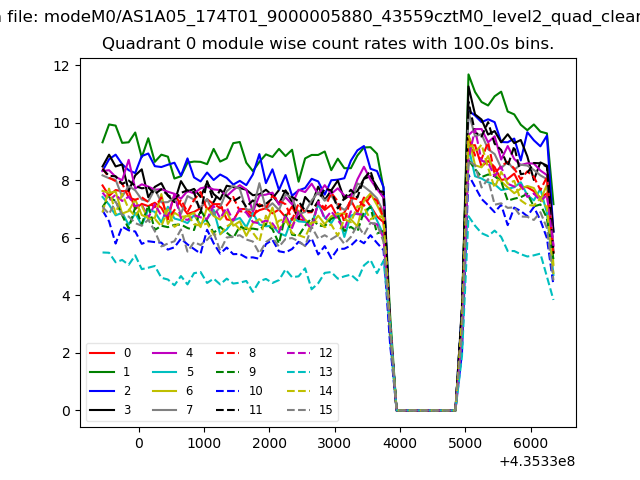
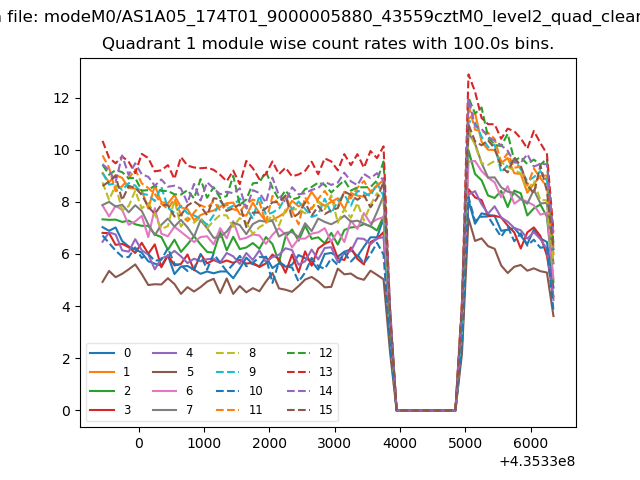
| Module-wise count rates for Quadrant A Data is divided into 100 sec bins |
 |
 |
| Module-wise count rates for Quadrant B Data is divided into 100 sec bins |
 |
 |
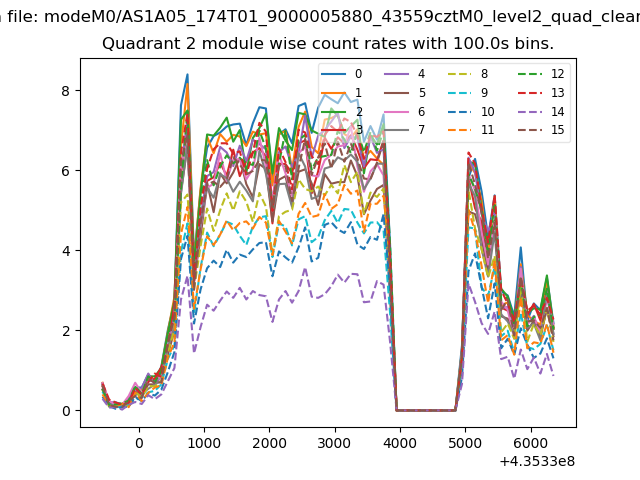
| Module-wise count rates for Quadrant C Data is divided into 100 sec bins |
 |
 |
| Module-wise count rates for Quadrant D Data is divided into 100 sec bins |
 |
 |
| Parameter | Plot |
|---|---|
| CZT HV Monitor | 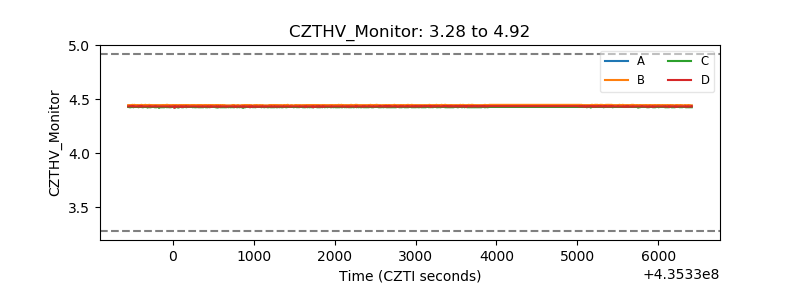 |
| D_VDD | 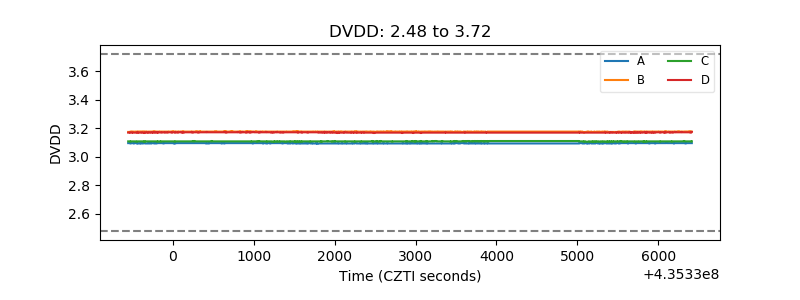 |
| Temperature 1 | 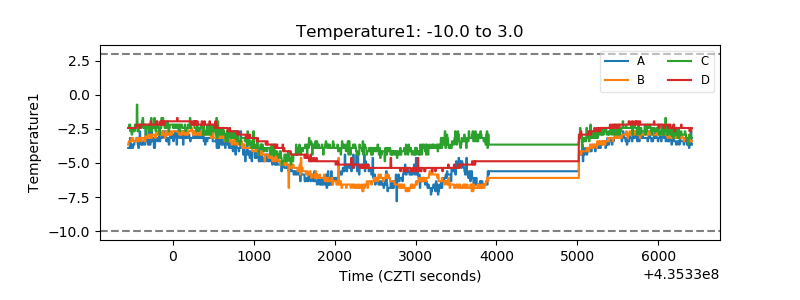 |
| Veto HV Monitor | 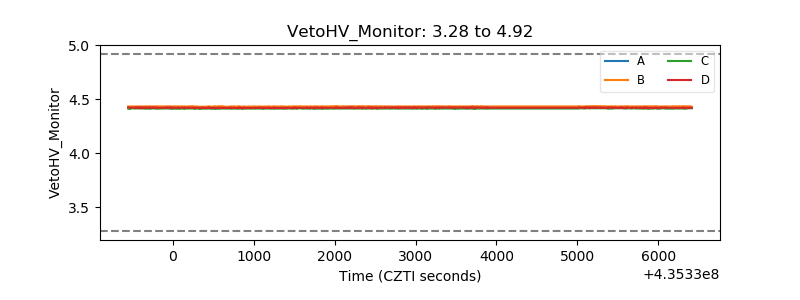 |
| Veto LLD | 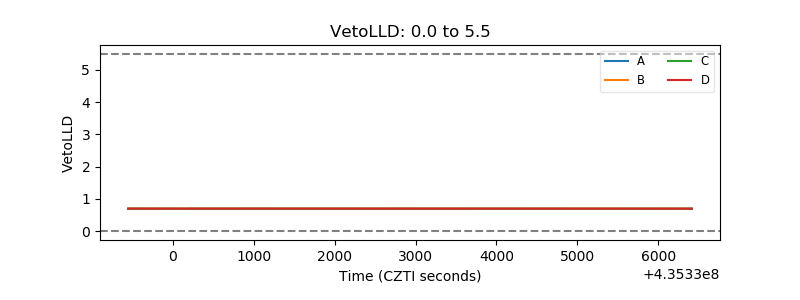 |
| Alpha Counter |  |
| _CPM_Rate | 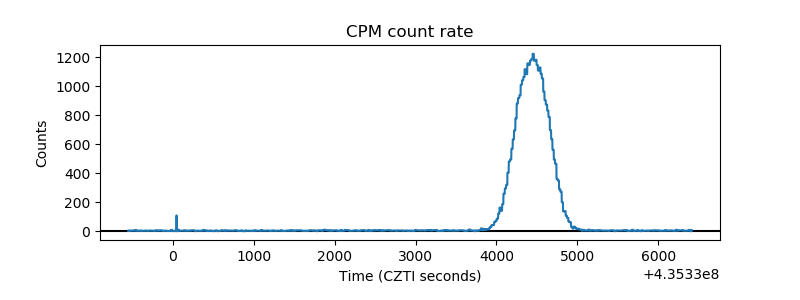 |
| CZT Counter | 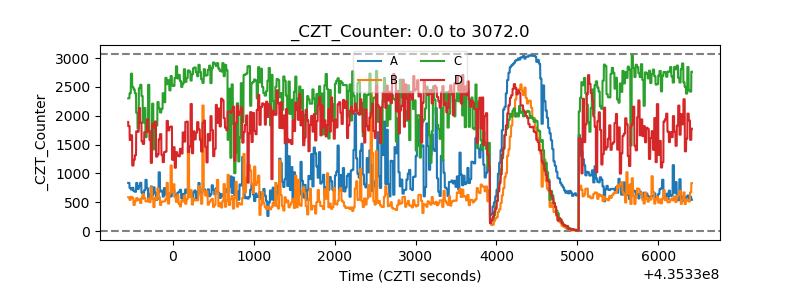 |
| +2.5 Volts monitor |  |
| +5 Volts monitor |  |
| _ROLL_ROT | 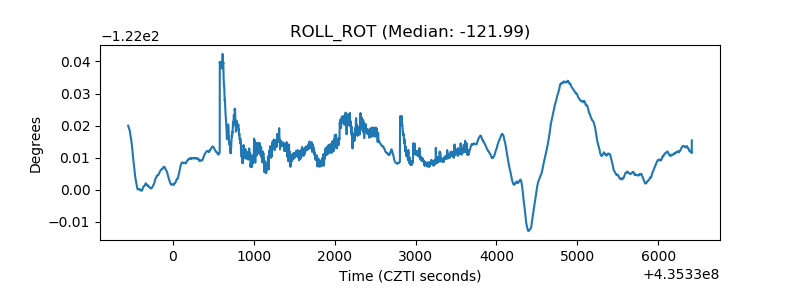 |
| _Roll_DEC | 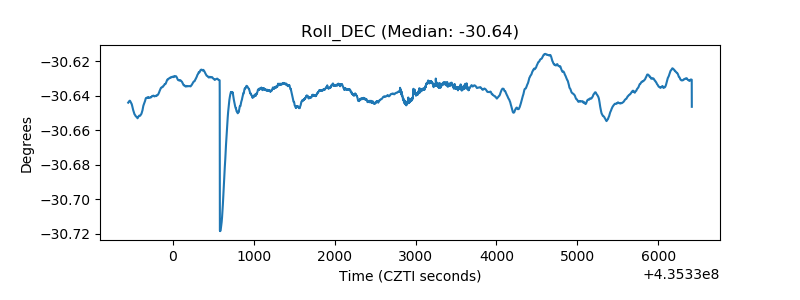 |
| _Roll_RA | 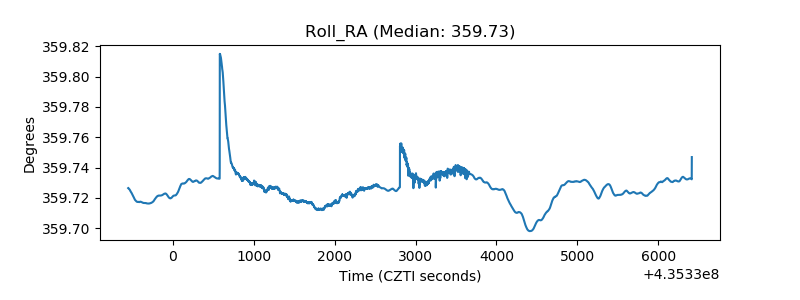 |
| Veto Counter | 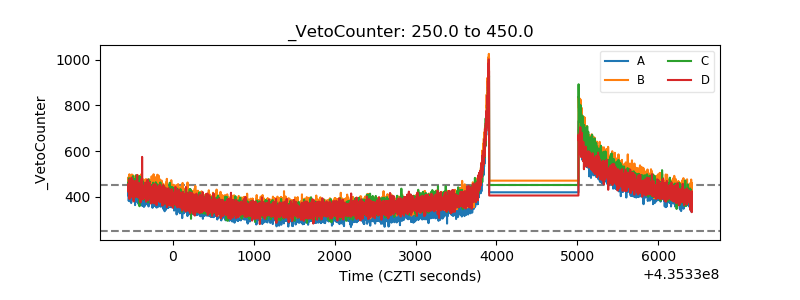 |