| Param | Original file | Final file |
|---|---|---|
| Filename | modeM0/AS1A05_174T01_9000005880_43561cztM0_level2.fits | modeM0/AS1A05_174T01_9000005880_43561cztM0_level2_quad_clean.evt |
| Size (bytes) | 908,017,920 | 83,563,200 |
| Size | 866.0 MB | 79.7 MB |
| Events in quadrant A | 5,406,576 | 709,946 |
| Events in quadrant B | 3,078,629 | 748,050 |
| Events in quadrant C | 13,195,085 | 482,510 |
| Events in quadrant D | 11,466,128 | 165,678 |
| Mode M9 | |||
|---|---|---|---|
| Quadrant | BADHDUFLAG | Total packets | Discarded packets |
| A | 0 | 12 | 0 |
| B | 0 | 12 | 0 |
| C | 0 | 12 | 0 |
| D | 0 | 12 | 0 |
| Mode M0 | |||
|---|---|---|---|
| Quadrant | BADHDUFLAG | Total packets | Discarded packets |
| A | 0 | 20238 | 1 |
| B | 0 | 13051 | 1 |
| C | 0 | 43268 | 9 |
| D | 0 | 38253 | 1 |
| Mode SS | |||
|---|---|---|---|
| Quadrant | BADHDUFLAG | Total packets | Discarded packets |
| A | 0 | 122 | 0 |
| B | 0 | 122 | 0 |
| C | 0 | 122 | 0 |
| D | 0 | 122 | 0 |
| Quadrant | Total seconds | Saturated seconds | Saturation percentage |
|---|---|---|---|
| A | 6003 | 474 | 7.896052% |
| B | 6003 | 103 | 1.715809% |
| C | 6002 | 3886 | 64.745085% |
| D | 6002 | 5963 | 99.350217% |
Noise dominated data is calculated using 1-second bins in cleaned event files. If a bin has >2000 counts, and if more than 50% of those come from <1% of pixels, then it is considered to be noise-dominated and hence unusable.
| Quadrant | # 1 sec bins | Bins with >0 counts | Bins with >2000 counts | High rate bins dominated by noise | Noise dominated (total time) | Noise dominated (detector-on time) | Marked lightcurve |
|---|---|---|---|---|---|---|---|
| A | 7213 | 6003 | 150 | 150 | 2.08% | 2.50% | 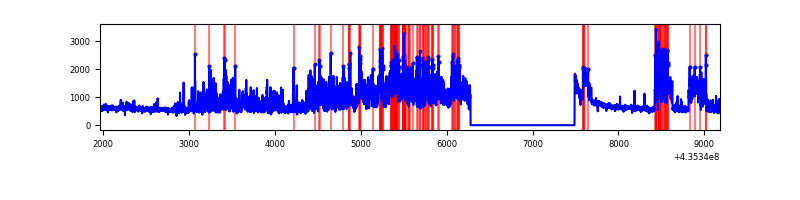 |
| B | 7213 | 6004 | 8 | 8 | 0.11% | 0.13% |  |
| C | 7212 | 6002 | 3840 | 3840 | 53.24% | 63.98% | 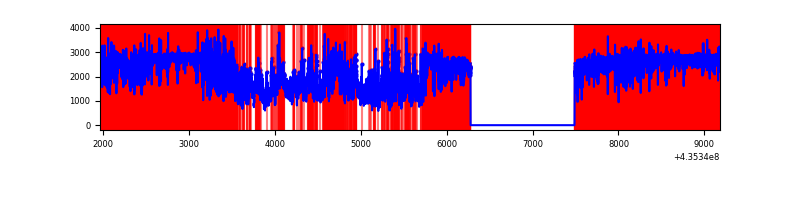 |
| D | 7211 | 6001 | 2678 | 2678 | 37.14% | 44.63% | 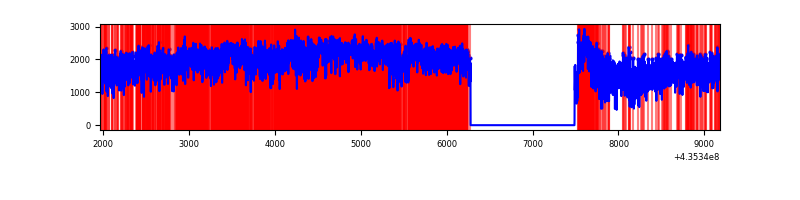 |
Top three noisy pixels from each quadrant. If the there are fewer than three noisy pixels in the level2.evt file, extra rows are filled as -1
| Pixel properties | Quadrant properties | ||||||
|---|---|---|---|---|---|---|---|
| Quadrant | DetID | PixID | Counts | Sigma | Mean | Median | Sigma |
| A | 0 | 228 | 1222829 | 8557.55 | 690 | 678 | 142.8 |
| A | 10 | 83 | 645780 | 4517.03 | 690 | 678 | 142.8 |
| A | 15 | 222 | 517012 | 3615.39 | 690 | 678 | 142.8 |
| B | 3 | 42 | 75132 | 542.71 | 706 | 689 | 137.2 |
| B | 3 | 25 | 71379 | 515.35 | 706 | 689 | 137.2 |
| B | 0 | 199 | 33226 | 237.2 | 706 | 689 | 137.2 |
| C | 15 | 142 | 6825609 | 61676.1 | 469 | 473 | 110.7 |
| C | 15 | 158 | 1818770 | 16431.24 | 469 | 473 | 110.7 |
| C | 15 | 126 | 1039583 | 9390.03 | 469 | 473 | 110.7 |
| D | 4 | 216 | 3138847 | 51547.97 | 195 | 187 | 60.9 |
| D | 4 | 212 | 2882497 | 47337.79 | 195 | 187 | 60.9 |
| D | 13 | 187 | 1395568 | 22917.12 | 195 | 187 | 60.9 |
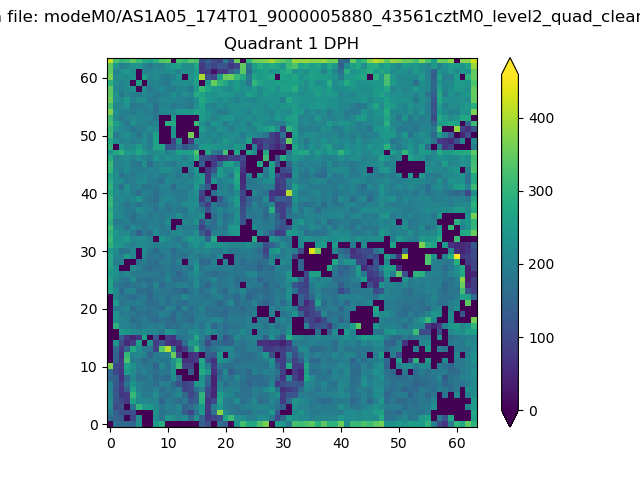
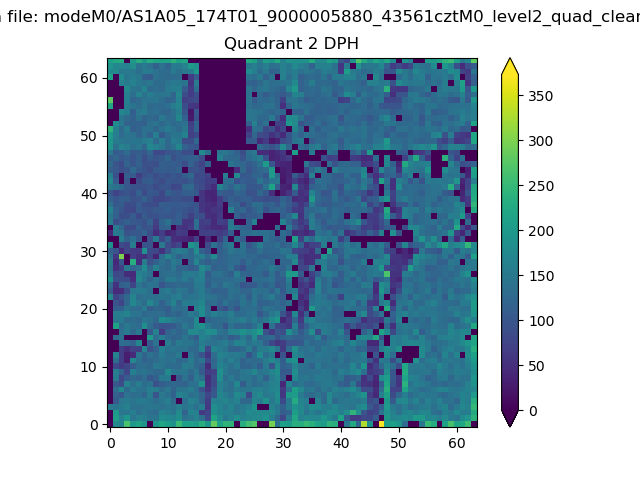
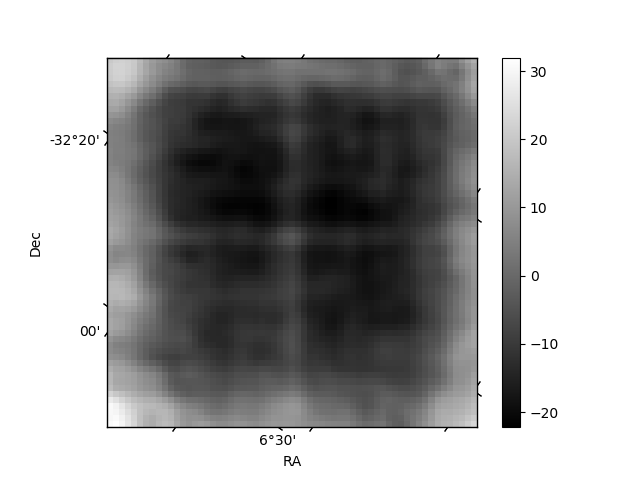
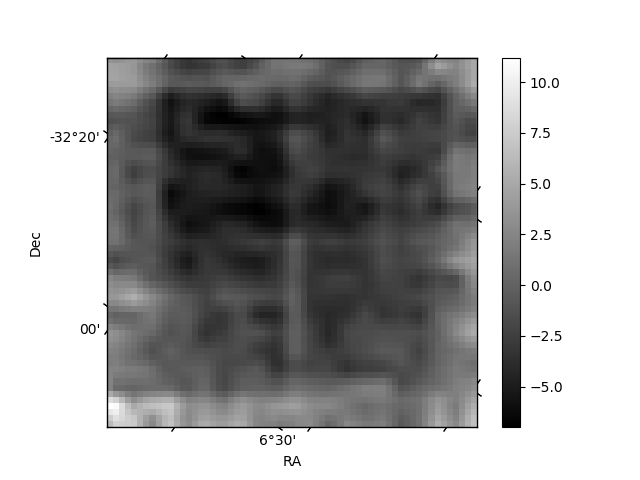
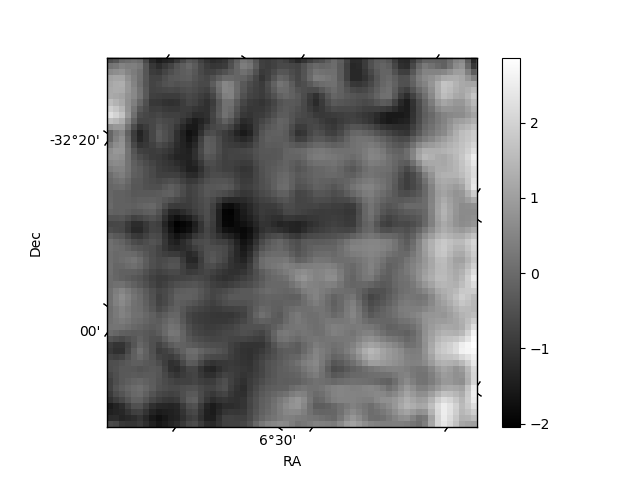
Histogram calculated using DETX and DETY for each event in the final _common_clean file
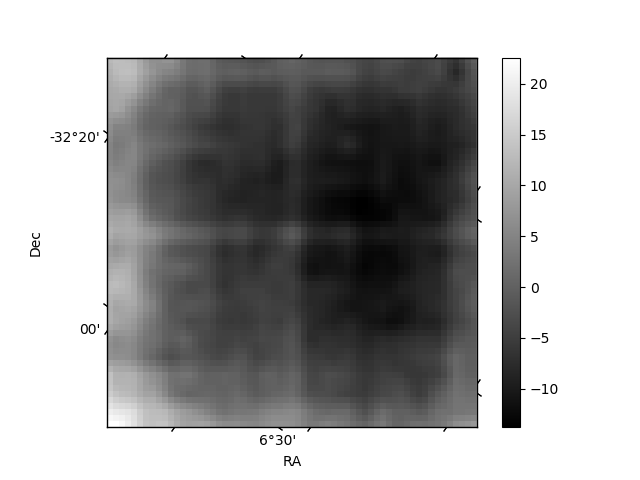
| Quadrant A | 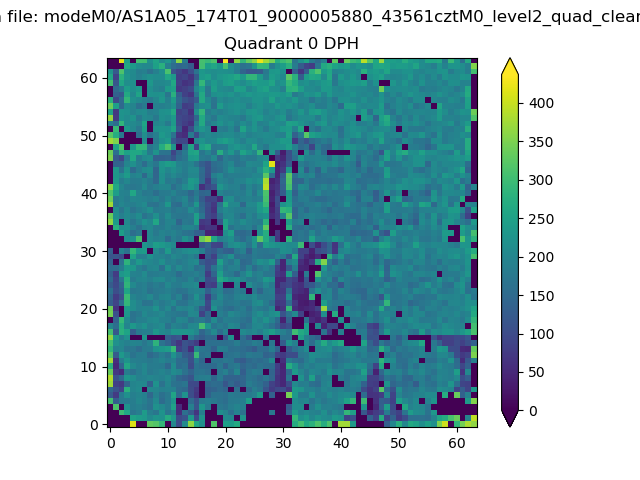 |
 |
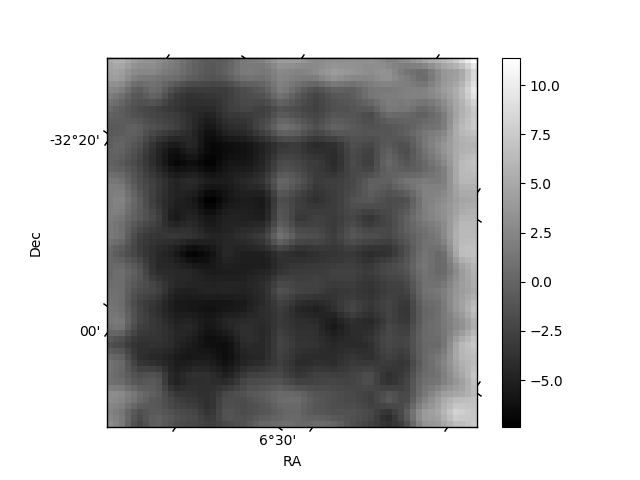
Quadrant B |
|---|---|---|---|
| Quadrant D | 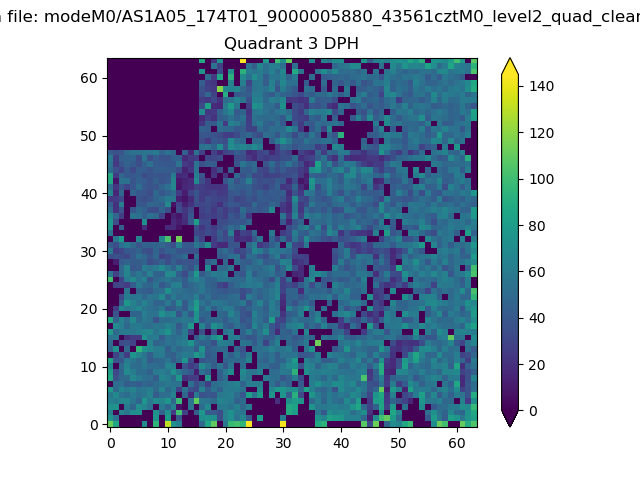 |
 |
Quadrant C |
| Plot type | Count rate plots | Images |
|---|---|---|
| Comparison with Poisson distribution Blue bars denote a histogram of data divided into 1 sec bins. Red curve is a Poisson curve with rate = median count rate of data. |
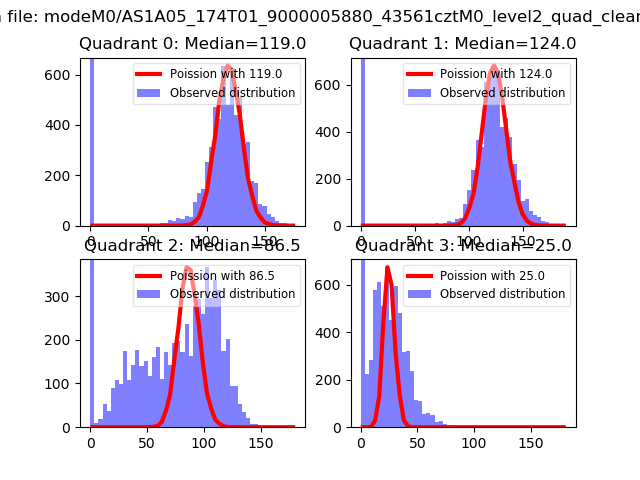 |
 |
| Quadrant-wise count rates Data is divided into 100 sec bins |
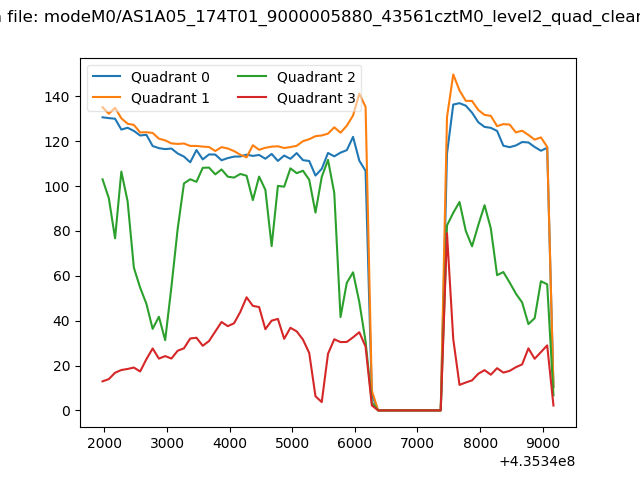 |
|
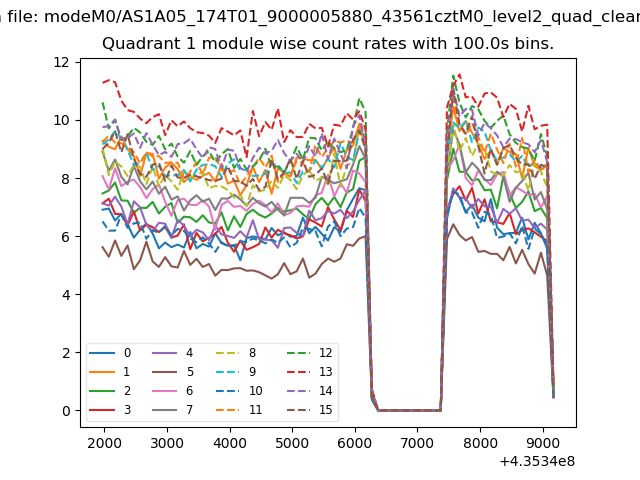
| Module-wise count rates for Quadrant A Data is divided into 100 sec bins |
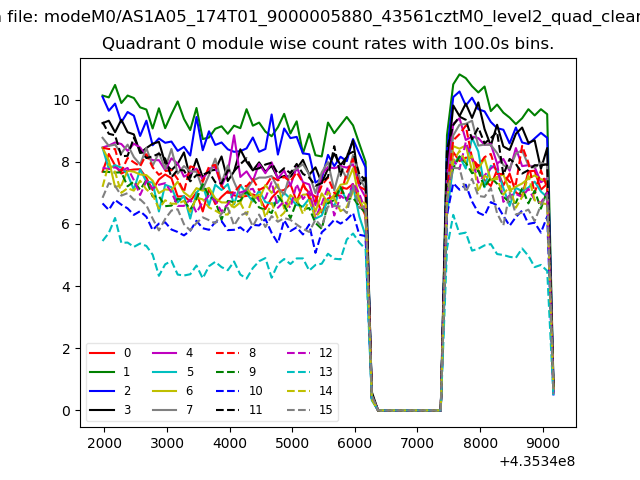 |
 |
| Module-wise count rates for Quadrant B Data is divided into 100 sec bins |
 |
 |
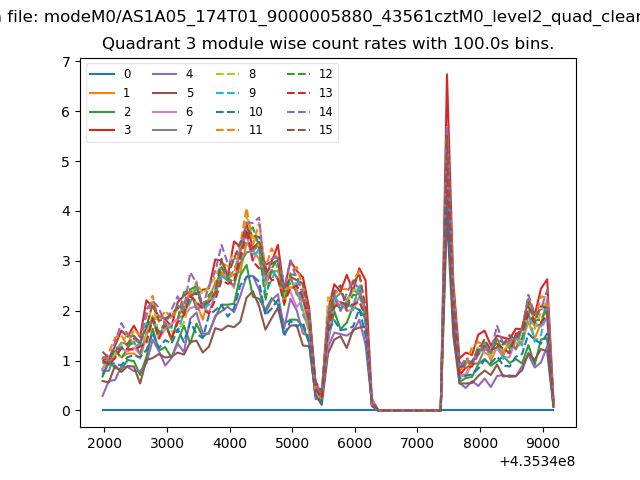
| Module-wise count rates for Quadrant C Data is divided into 100 sec bins |
 |
 |
| Module-wise count rates for Quadrant D Data is divided into 100 sec bins |
 |
 |
| Parameter | Plot |
|---|---|
| CZT HV Monitor | 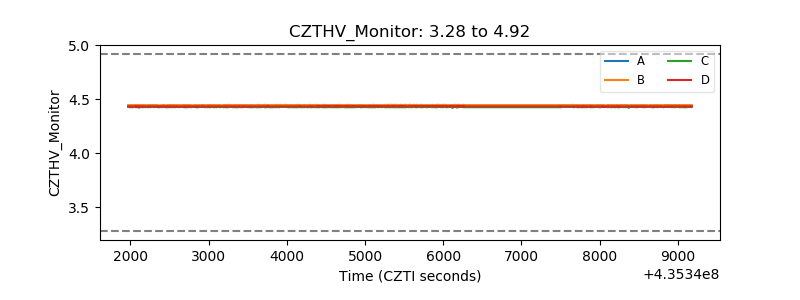 |
| D_VDD | 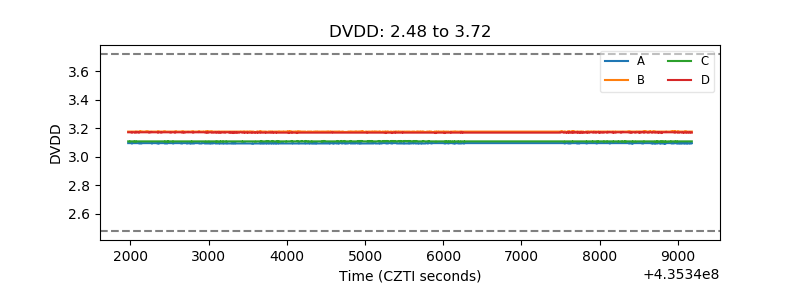 |
| Temperature 1 | 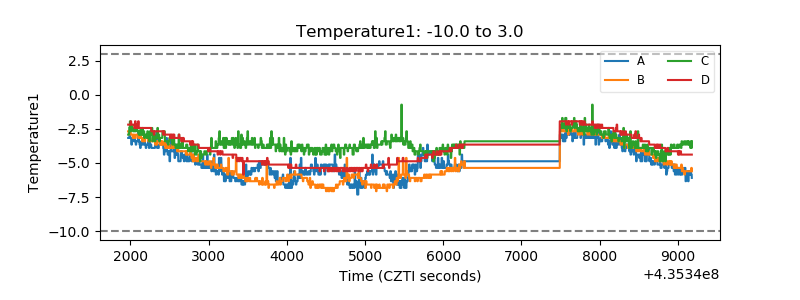 |
| Veto HV Monitor | 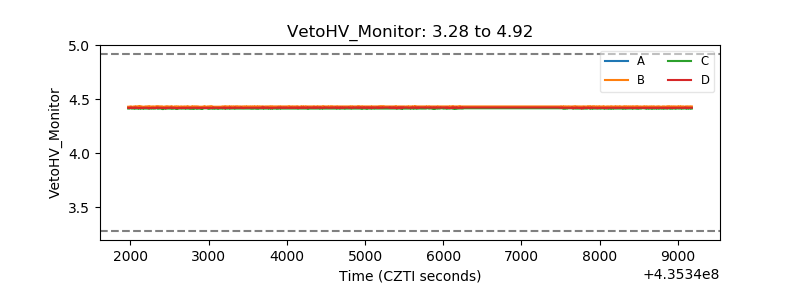 |
| Veto LLD | 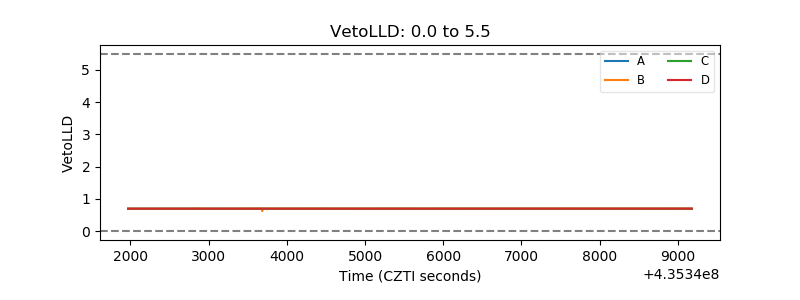 |
| Alpha Counter | 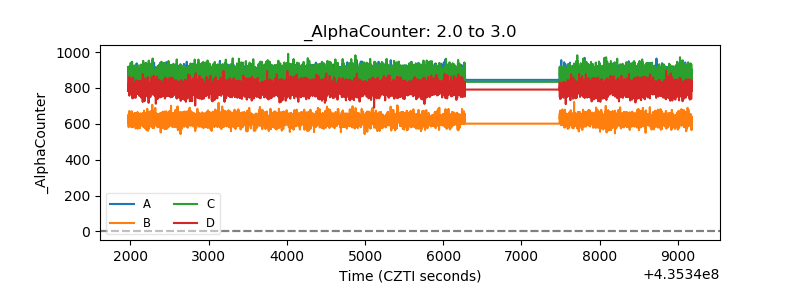 |
| _CPM_Rate | 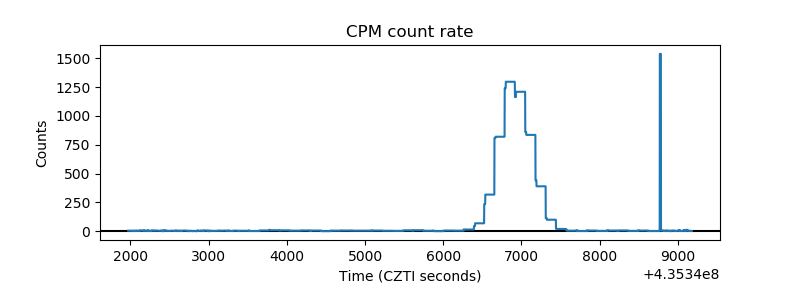 |
| CZT Counter | 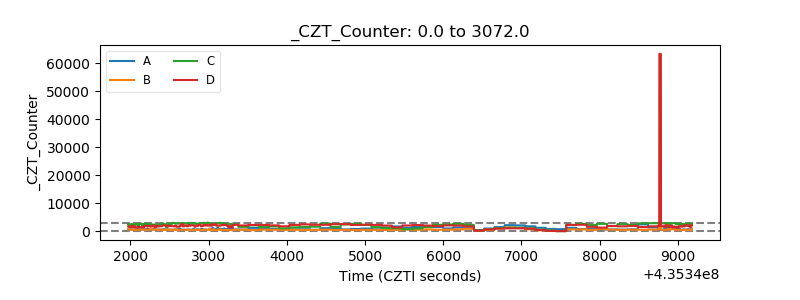 |
| +2.5 Volts monitor | 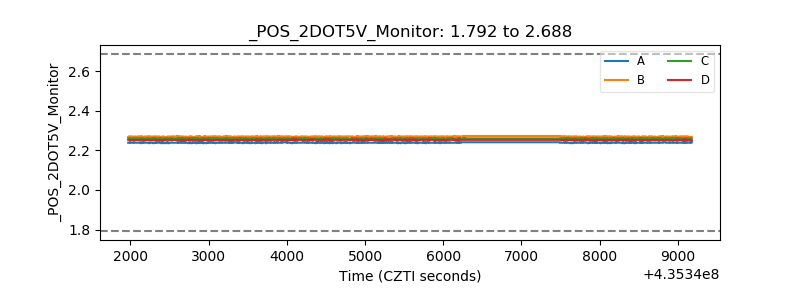 |
| +5 Volts monitor | 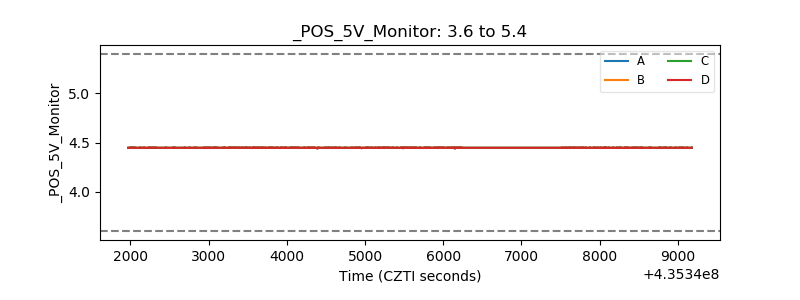 |
| _ROLL_ROT | 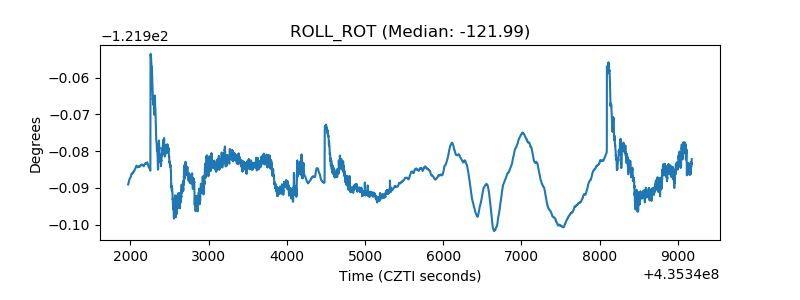 |
| _Roll_DEC | 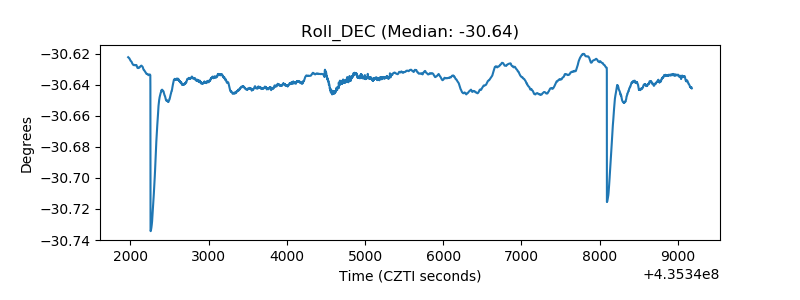 |
| _Roll_RA | 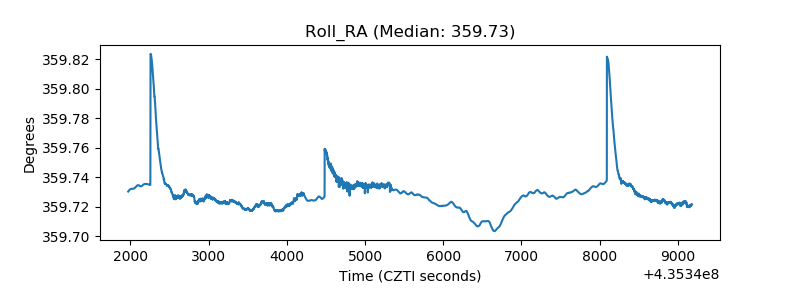 |
| Veto Counter | 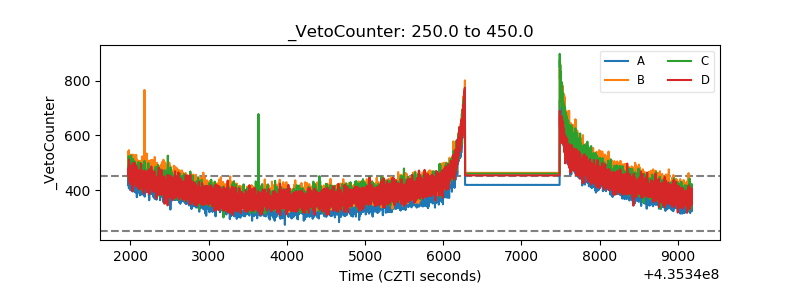 |