| Param | Original file | Final file |
|---|---|---|
| Filename | modeM0/AS1A05_174T01_9000005880_43562cztM0_level2.fits | modeM0/AS1A05_174T01_9000005880_43562cztM0_level2_quad_clean.evt |
| Size (bytes) | 897,946,560 | 78,681,600 |
| Size | 856.3 MB | 75.0 MB |
| Events in quadrant A | 6,125,736 | 660,506 |
| Events in quadrant B | 3,005,458 | 702,586 |
| Events in quadrant C | 12,497,389 | 465,547 |
| Events in quadrant D | 11,158,829 | 142,026 |
| Mode M9 | |||
|---|---|---|---|
| Quadrant | BADHDUFLAG | Total packets | Discarded packets |
| A | 0 | 11 | 0 |
| B | 0 | 11 | 0 |
| C | 0 | 11 | 0 |
| D | 0 | 11 | 0 |
| Mode M0 | |||
|---|---|---|---|
| Quadrant | BADHDUFLAG | Total packets | Discarded packets |
| A | 0 | 22281 | 1 |
| B | 0 | 12803 | 1 |
| C | 0 | 41068 | 1 |
| D | 0 | 37156 | 1 |
| Mode SS | |||
|---|---|---|---|
| Quadrant | BADHDUFLAG | Total packets | Discarded packets |
| A | 0 | 118 | 0 |
| B | 0 | 118 | 0 |
| C | 0 | 118 | 0 |
| D | 0 | 118 | 0 |
| Quadrant | Total seconds | Saturated seconds | Saturation percentage |
|---|---|---|---|
| A | 5825 | 725 | 12.446352% |
| B | 5825 | 105 | 1.802575% |
| C | 5824 | 3497 | 60.044643% |
| D | 5824 | 5792 | 99.450549% |
Noise dominated data is calculated using 1-second bins in cleaned event files. If a bin has >2000 counts, and if more than 50% of those come from <1% of pixels, then it is considered to be noise-dominated and hence unusable.
| Quadrant | # 1 sec bins | Bins with >0 counts | Bins with >2000 counts | High rate bins dominated by noise | Noise dominated (total time) | Noise dominated (detector-on time) | Marked lightcurve |
|---|---|---|---|---|---|---|---|
| A | 6960 | 5825 | 236 | 236 | 3.39% | 4.05% | 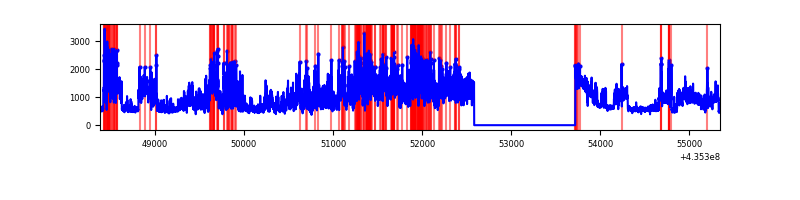 |
| B | 6960 | 5825 | 7 | 7 | 0.10% | 0.12% | 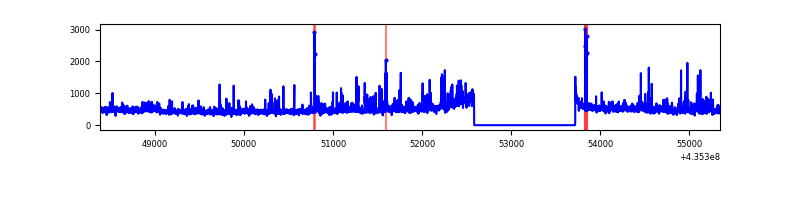 |
| C | 6958 | 5823 | 3529 | 3529 | 50.72% | 60.60% | 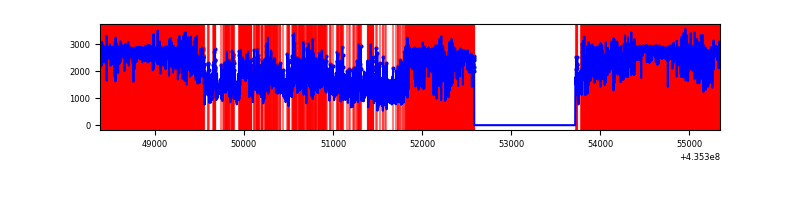 |
| D | 6958 | 5823 | 2519 | 2519 | 36.20% | 43.26% | 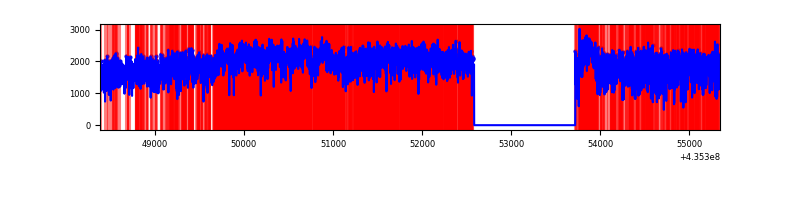 |
Top three noisy pixels from each quadrant. If the there are fewer than three noisy pixels in the level2.evt file, extra rows are filled as -1
| Pixel properties | Quadrant properties | ||||||
|---|---|---|---|---|---|---|---|
| Quadrant | DetID | PixID | Counts | Sigma | Mean | Median | Sigma |
| A | 0 | 228 | 1620840 | 12027.56 | 649 | 636 | 134.7 |
| A | 15 | 222 | 885038 | 6565.35 | 649 | 636 | 134.7 |
| A | 10 | 83 | 590163 | 4376.35 | 649 | 636 | 134.7 |
| B | 3 | 42 | 124365 | 941.58 | 675 | 658 | 131.4 |
| B | 3 | 25 | 70801 | 533.89 | 675 | 658 | 131.4 |
| B | 0 | 230 | 29532 | 219.77 | 675 | 658 | 131.4 |
| C | 15 | 142 | 6644849 | 60816.79 | 463 | 464 | 109.3 |
| C | 15 | 158 | 2051893 | 18776.96 | 463 | 464 | 109.3 |
| C | 15 | 174 | 695761 | 6364.13 | 463 | 464 | 109.3 |
| D | 4 | 216 | 3864068 | 73528.91 | 168 | 162 | 52.5 |
| D | 4 | 212 | 3160366 | 60137.68 | 168 | 162 | 52.5 |
| D | 13 | 187 | 485698 | 9239.6 | 168 | 162 | 52.5 |
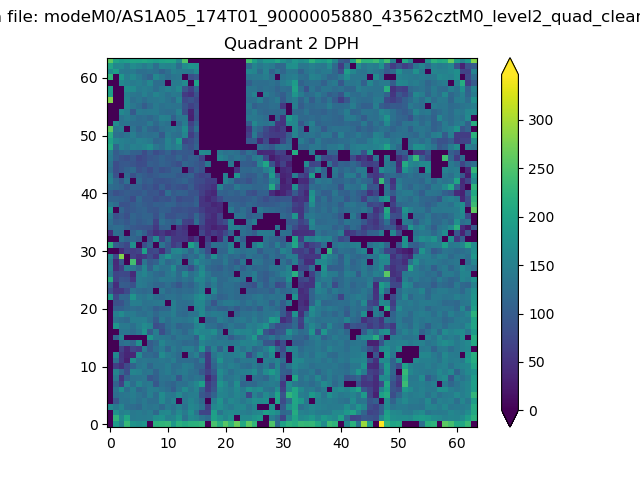
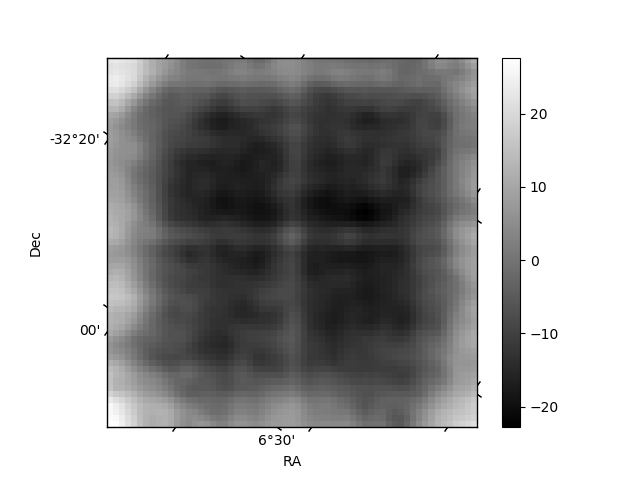
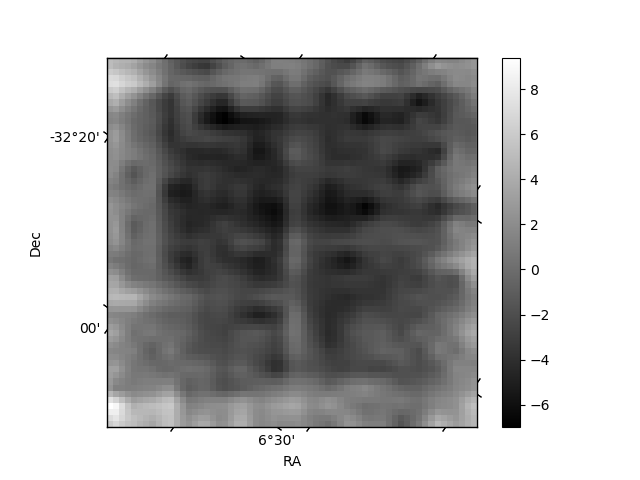
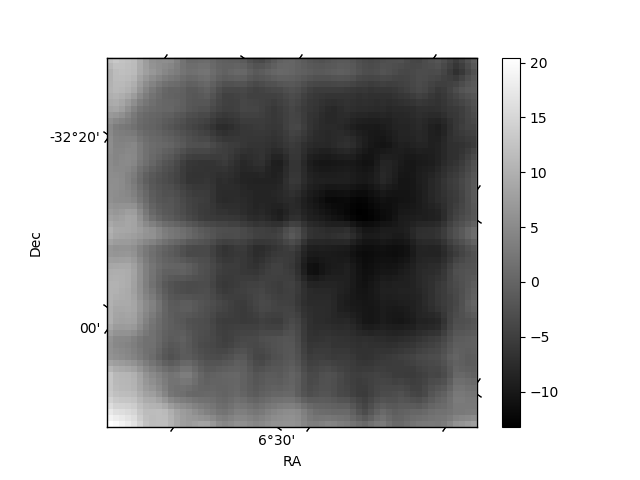
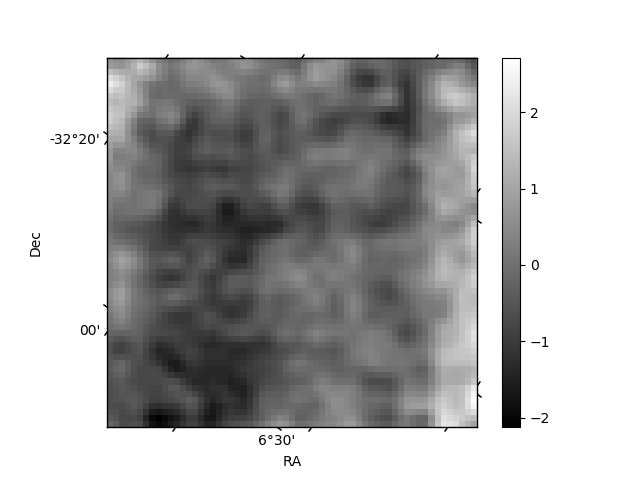
Histogram calculated using DETX and DETY for each event in the final _common_clean file
| Quadrant A | 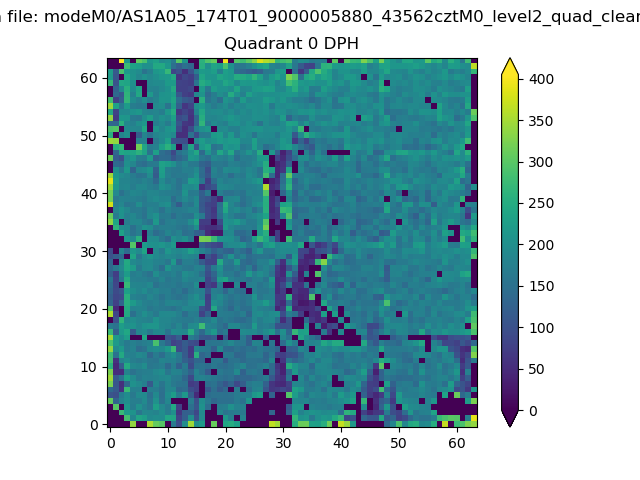 |
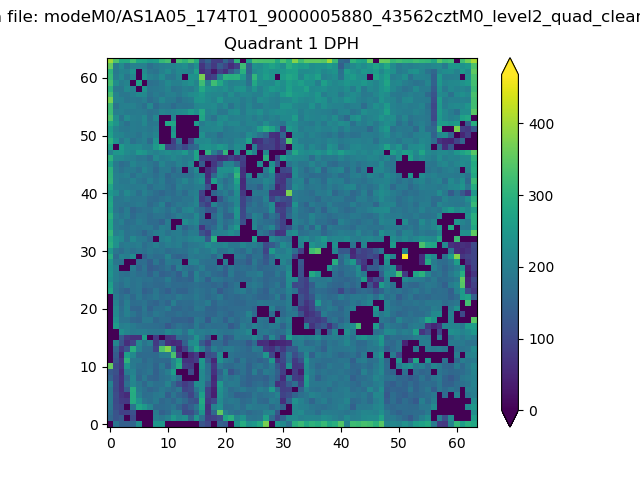 |
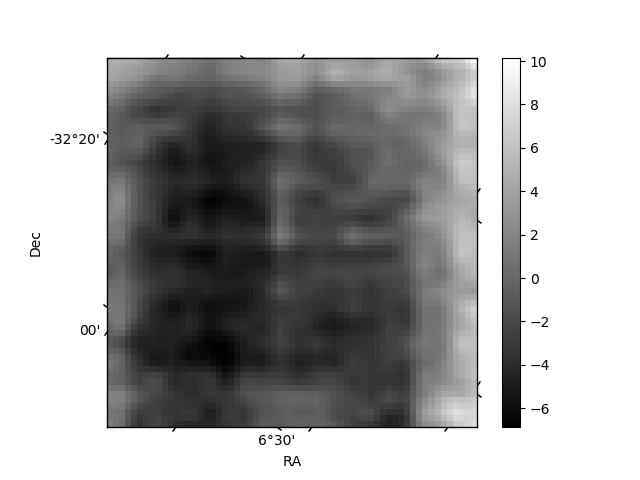
Quadrant B |
|---|---|---|---|
| Quadrant D | 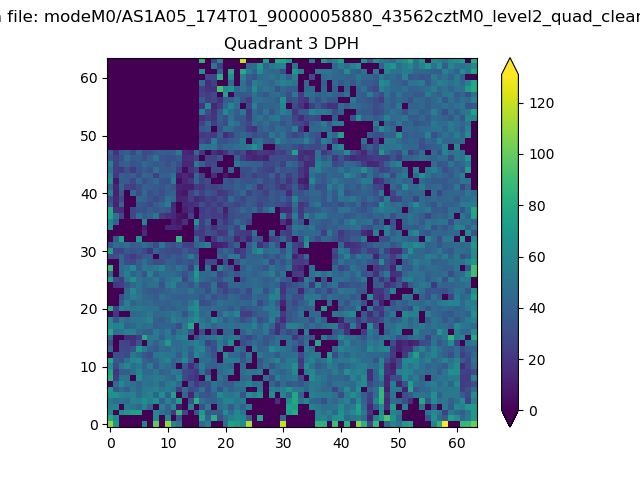 |
 |
Quadrant C |
| Plot type | Count rate plots | Images |
|---|---|---|
| Comparison with Poisson distribution Blue bars denote a histogram of data divided into 1 sec bins. Red curve is a Poisson curve with rate = median count rate of data. |
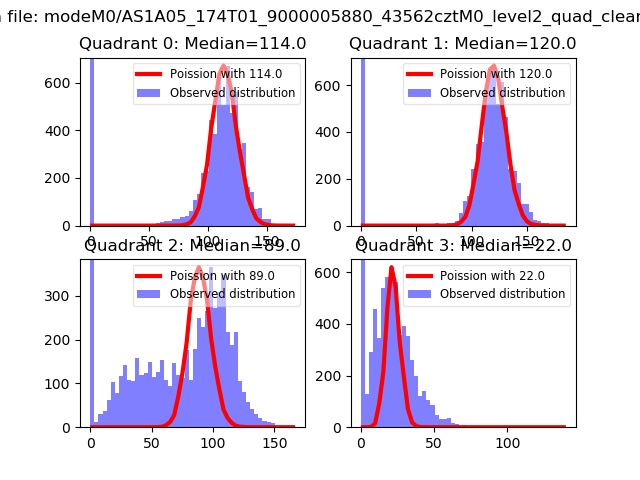 |
 |
| Quadrant-wise count rates Data is divided into 100 sec bins |
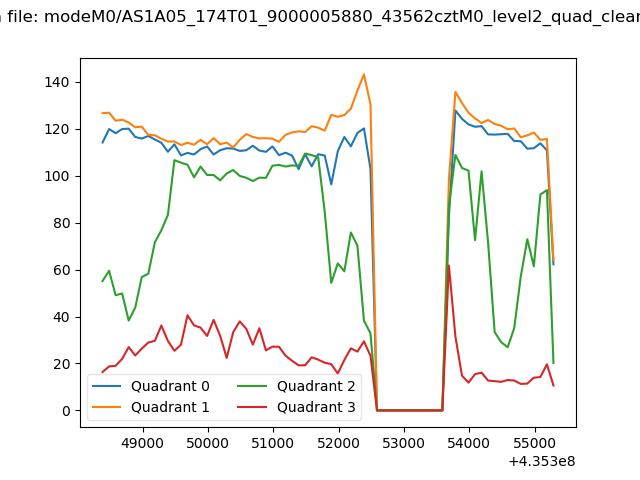 |
|
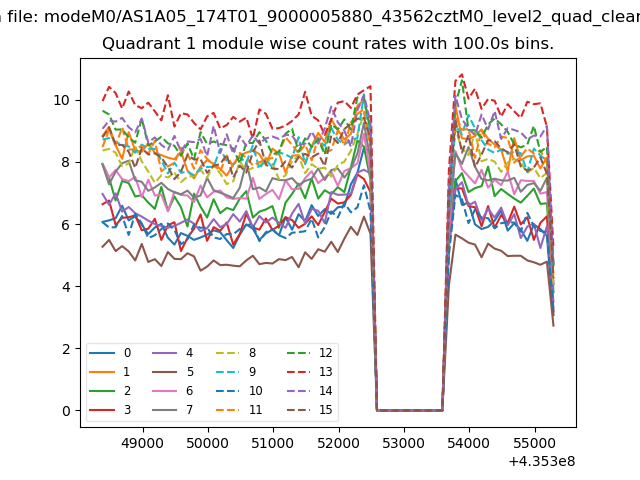
| Module-wise count rates for Quadrant A Data is divided into 100 sec bins |
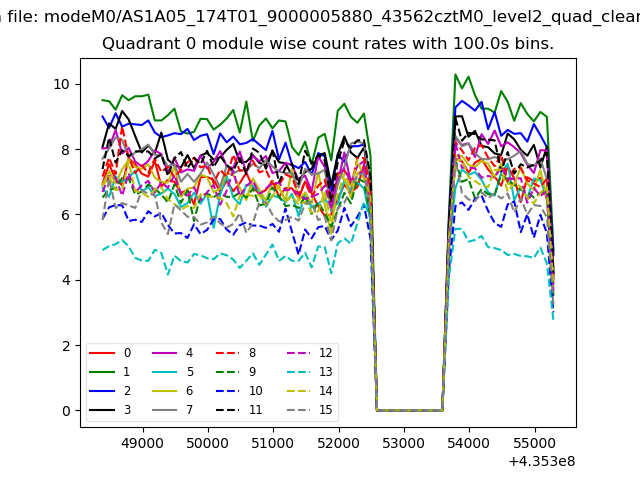 |
 |
| Module-wise count rates for Quadrant B Data is divided into 100 sec bins |
 |
 |
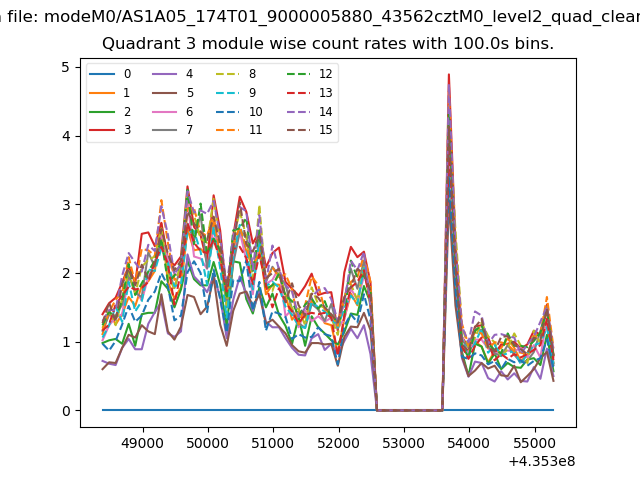
| Module-wise count rates for Quadrant C Data is divided into 100 sec bins |
 |
 |
| Module-wise count rates for Quadrant D Data is divided into 100 sec bins |
 |
 |
| Parameter | Plot |
|---|---|
| CZT HV Monitor | 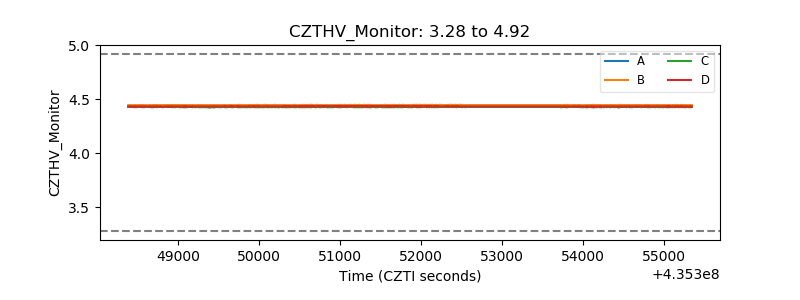 |
| D_VDD | 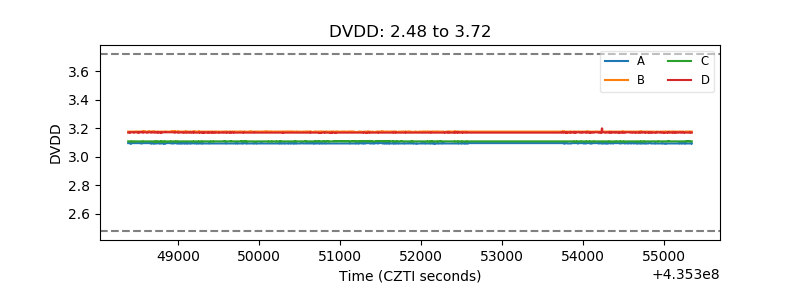 |
| Temperature 1 | 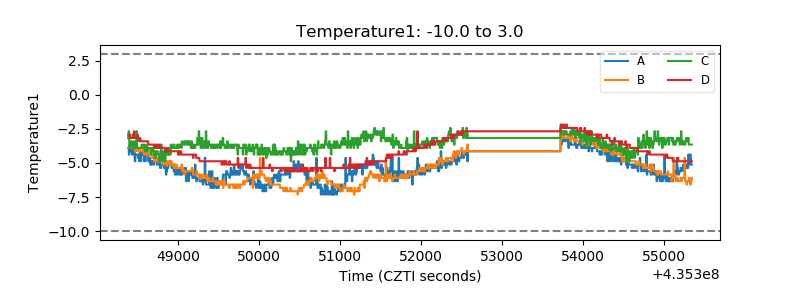 |
| Veto HV Monitor | 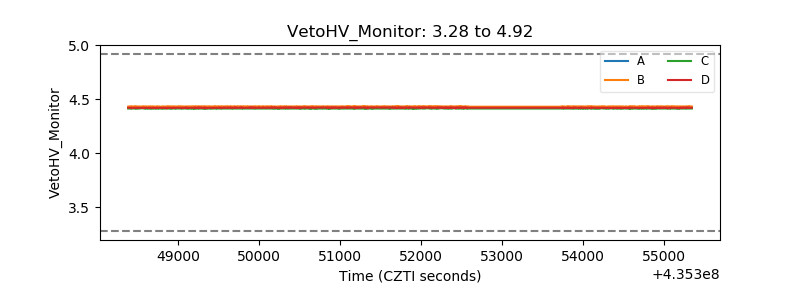 |
| Veto LLD | 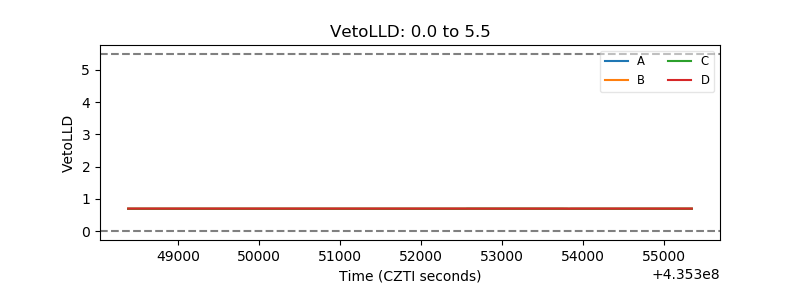 |
| Alpha Counter | 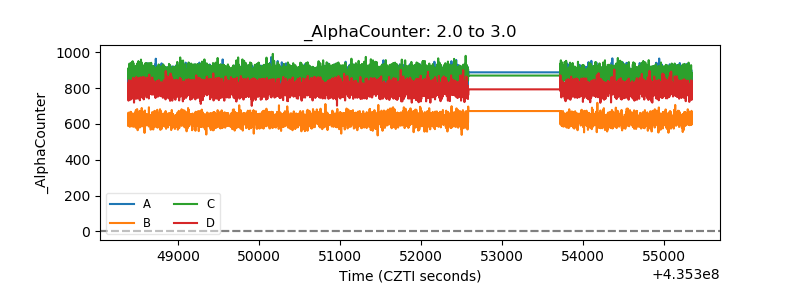 |
| _CPM_Rate | 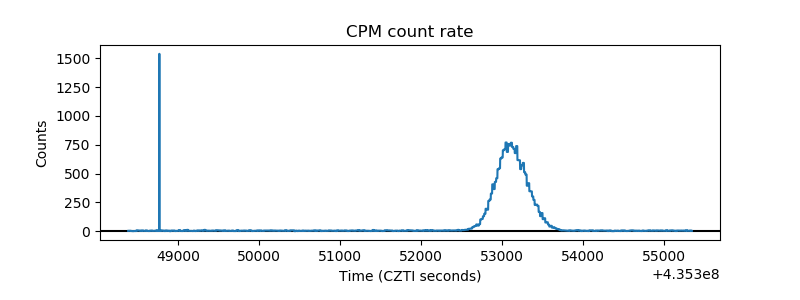 |
| CZT Counter | 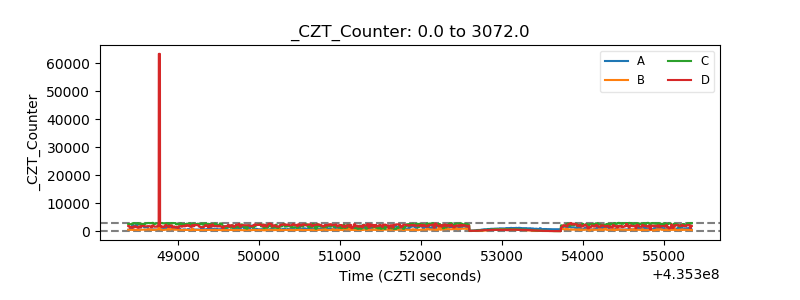 |
| +2.5 Volts monitor | 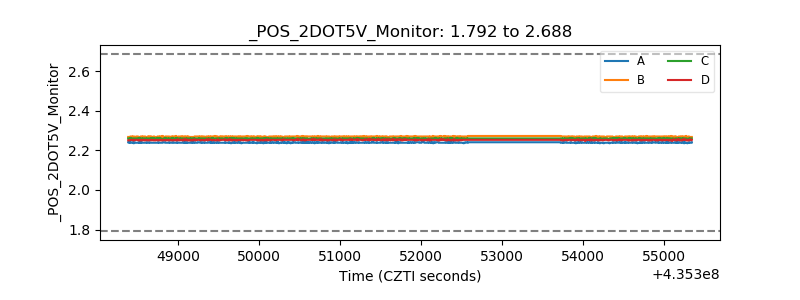 |
| +5 Volts monitor | 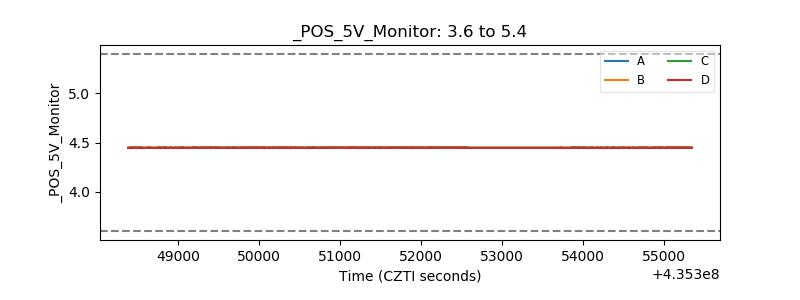 |
| _ROLL_ROT | 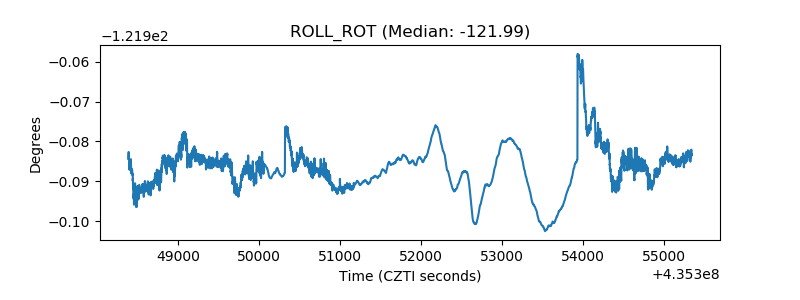 |
| _Roll_DEC | 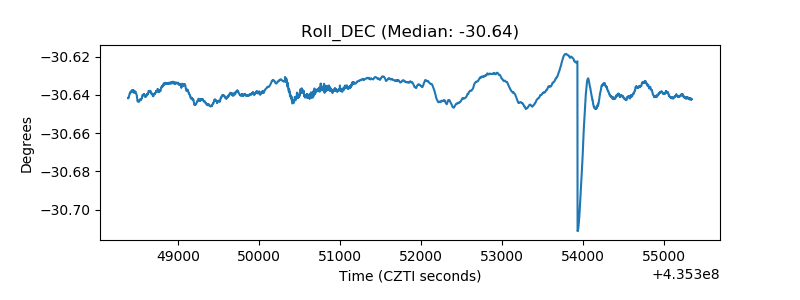 |
| _Roll_RA | 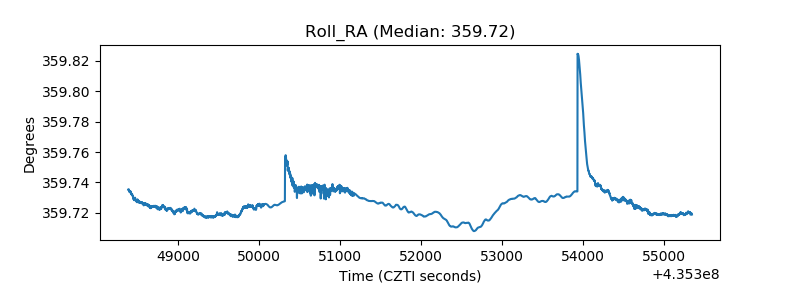 |
| Veto Counter | 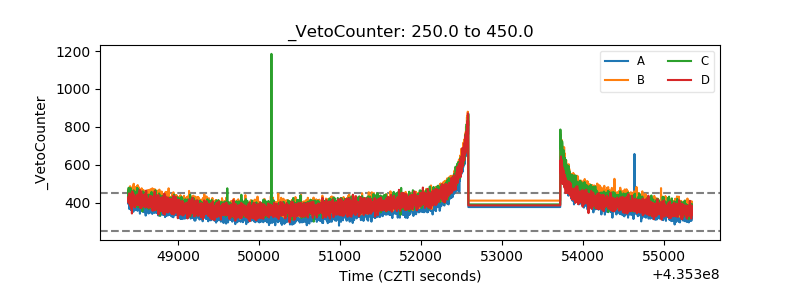 |