| Param | Original file | Final file |
|---|---|---|
| Filename | modeM0/AS1A05_174T01_9000005880_43564cztM0_level2.fits | modeM0/AS1A05_174T01_9000005880_43564cztM0_level2_quad_clean.evt |
| Size (bytes) | 999,912,960 | 80,403,840 |
| Size | 953.6 MB | 76.7 MB |
| Events in quadrant A | 5,754,164 | 683,918 |
| Events in quadrant B | 3,378,956 | 715,283 |
| Events in quadrant C | 14,170,275 | 458,235 |
| Events in quadrant D | 13,218,675 | 128,743 |
| Mode M9 | |||
|---|---|---|---|
| Quadrant | BADHDUFLAG | Total packets | Discarded packets |
| A | 0 | 5 | 0 |
| B | 0 | 5 | 0 |
| C | 0 | 5 | 0 |
| D | 0 | 5 | 0 |
| Mode M0 | |||
|---|---|---|---|
| Quadrant | BADHDUFLAG | Total packets | Discarded packets |
| A | 0 | 21453 | 4 |
| B | 0 | 14481 | 1 |
| C | 0 | 46442 | 1 |
| D | 0 | 43594 | 1 |
| Mode SS | |||
|---|---|---|---|
| Quadrant | BADHDUFLAG | Total packets | Discarded packets |
| A | 0 | 130 | 0 |
| B | 0 | 130 | 0 |
| C | 0 | 130 | 0 |
| D | 0 | 130 | 0 |
| Quadrant | Total seconds | Saturated seconds | Saturation percentage |
|---|---|---|---|
| A | 6344 | 513 | 8.086381% |
| B | 6345 | 125 | 1.970055% |
| C | 6345 | 4451 | 70.149724% |
| D | 6345 | 6342 | 99.952719% |
Noise dominated data is calculated using 1-second bins in cleaned event files. If a bin has >2000 counts, and if more than 50% of those come from <1% of pixels, then it is considered to be noise-dominated and hence unusable.
| Quadrant | # 1 sec bins | Bins with >0 counts | Bins with >2000 counts | High rate bins dominated by noise | Noise dominated (total time) | Noise dominated (detector-on time) | Marked lightcurve |
|---|---|---|---|---|---|---|---|
| A | 6909 | 6345 | 300 | 300 | 4.34% | 4.73% | 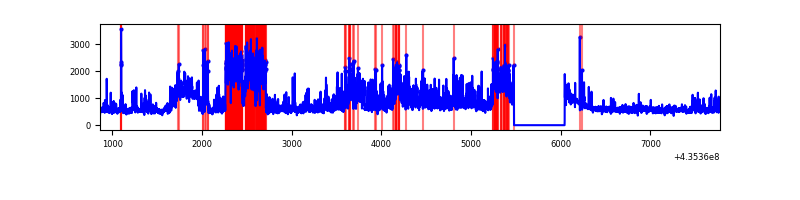 |
| B | 6910 | 6346 | 35 | 35 | 0.51% | 0.55% | 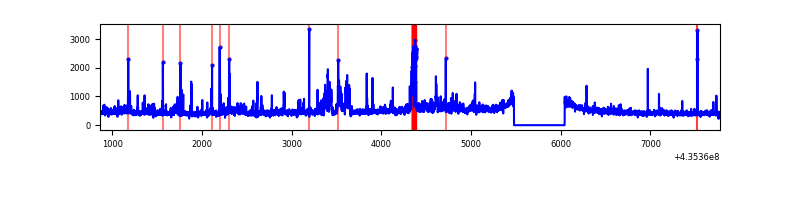 |
| C | 6910 | 6345 | 4365 | 4365 | 63.17% | 68.79% | 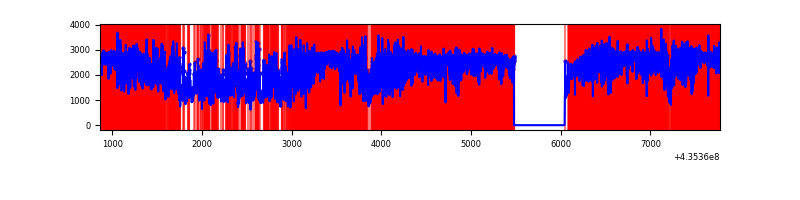 |
| D | 6909 | 6344 | 4224 | 4224 | 61.14% | 66.58% | 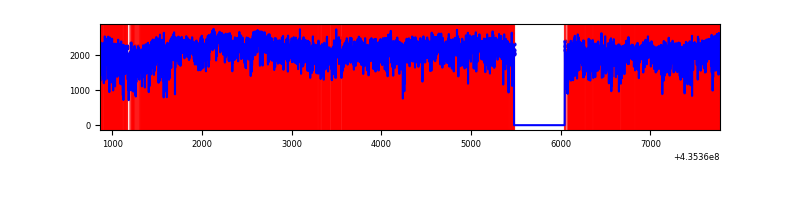 |
Top three noisy pixels from each quadrant. If the there are fewer than three noisy pixels in the level2.evt file, extra rows are filled as -1
| Pixel properties | Quadrant properties | ||||||
|---|---|---|---|---|---|---|---|
| Quadrant | DetID | PixID | Counts | Sigma | Mean | Median | Sigma |
| A | 15 | 222 | 1107408 | 7567.57 | 700 | 686 | 146.2 |
| A | 0 | 228 | 788844 | 5389.29 | 700 | 686 | 146.2 |
| A | 10 | 83 | 624307 | 4264.21 | 700 | 686 | 146.2 |
| B | 3 | 25 | 146847 | 1045.38 | 715 | 693 | 139.8 |
| B | 0 | 230 | 110429 | 784.89 | 715 | 693 | 139.8 |
| B | 4 | 251 | 103945 | 738.52 | 715 | 693 | 139.8 |
| C | 15 | 142 | 4805757 | 42464.16 | 473 | 475 | 113.2 |
| C | 15 | 174 | 3894069 | 34407.6 | 473 | 475 | 113.2 |
| C | 15 | 158 | 1431625 | 12647.04 | 473 | 475 | 113.2 |
| D | 4 | 216 | 5627073 | 106398.68 | 162 | 154 | 52.9 |
| D | 4 | 212 | 3601364 | 68094.81 | 162 | 154 | 52.9 |
| D | 14 | 210 | 667800 | 12624.43 | 162 | 154 | 52.9 |
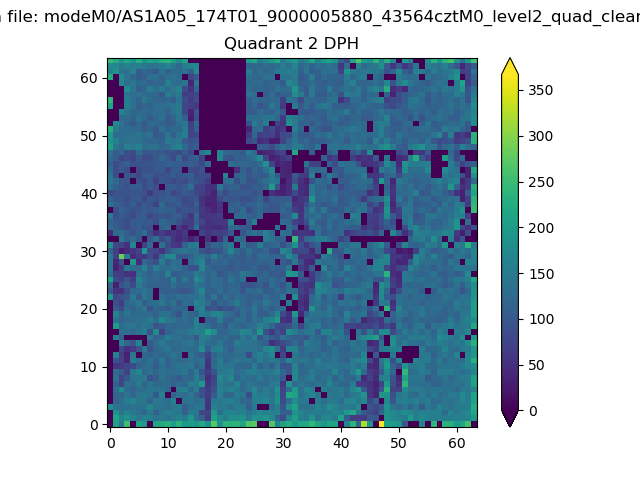
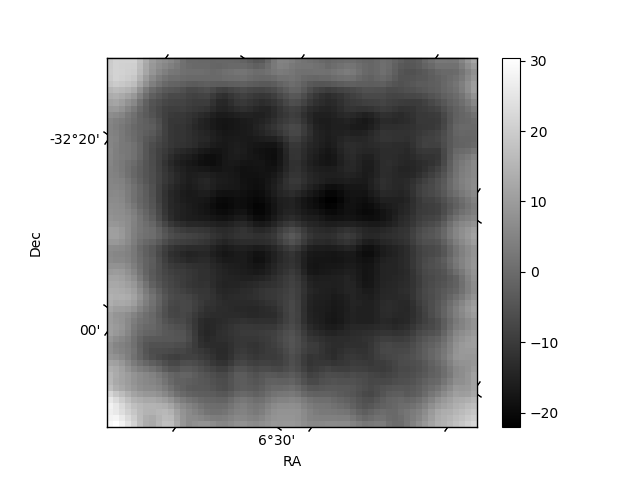
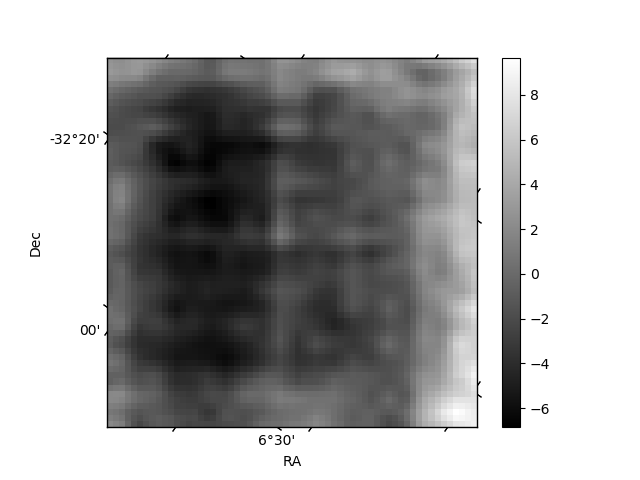
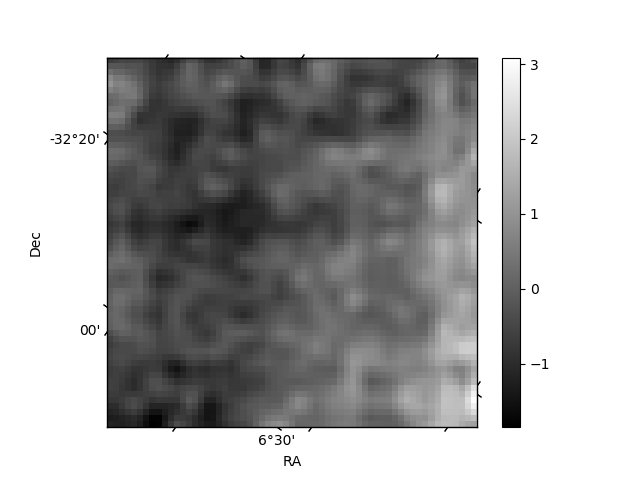
Histogram calculated using DETX and DETY for each event in the final _common_clean file
| Quadrant A | 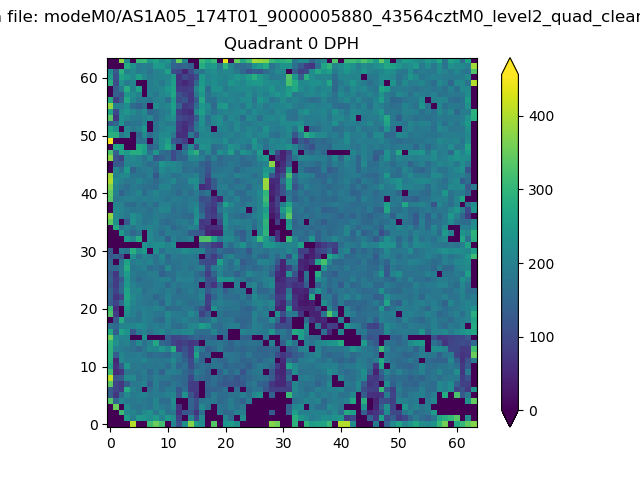 |
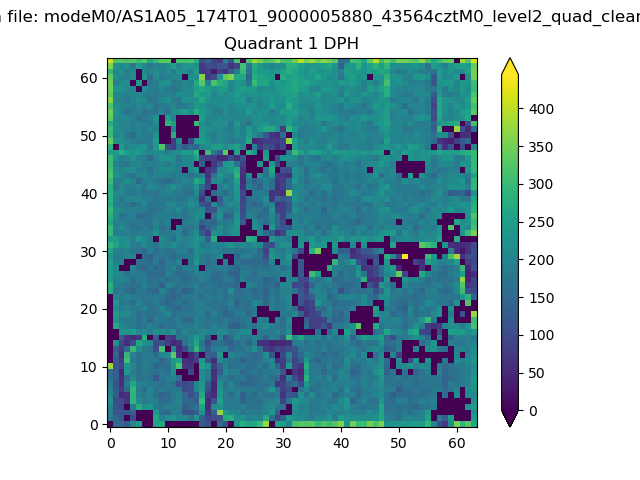 |
Quadrant B |
|---|---|---|---|
| Quadrant D | 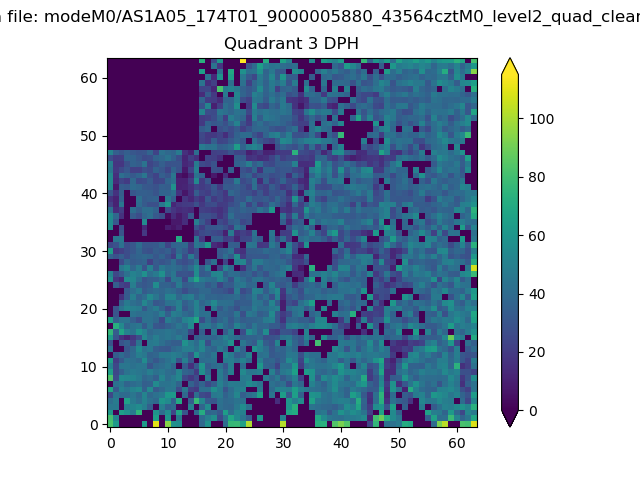 |
 |
Quadrant C |
| Plot type | Count rate plots | Images |
|---|---|---|
| Comparison with Poisson distribution Blue bars denote a histogram of data divided into 1 sec bins. Red curve is a Poisson curve with rate = median count rate of data. |
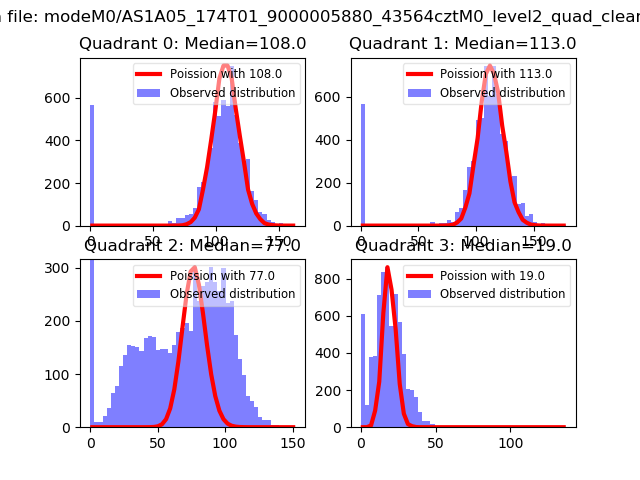 |
 |
| Quadrant-wise count rates Data is divided into 100 sec bins |
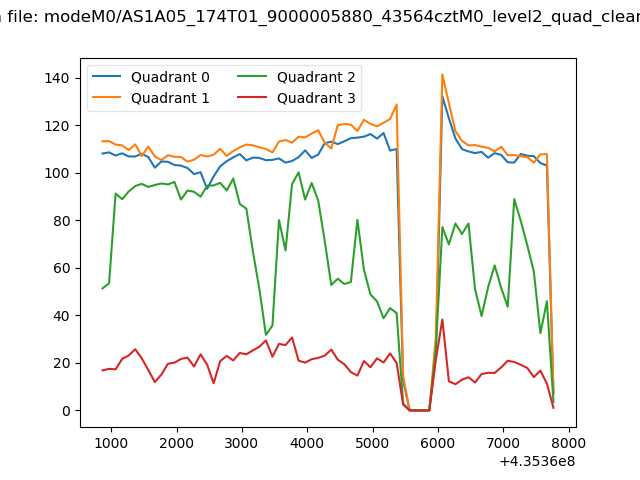 |
|
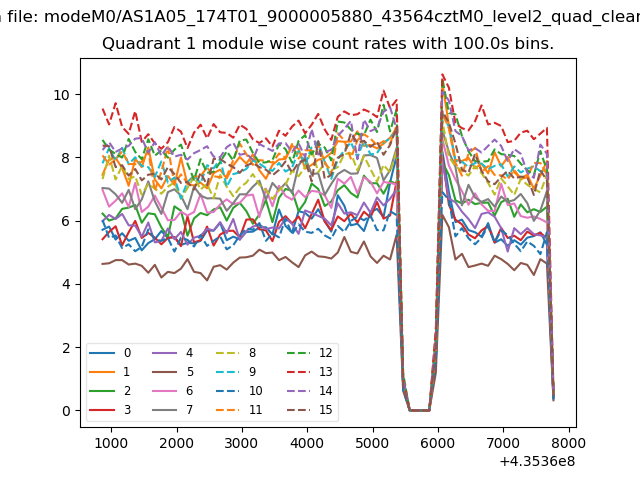
| Module-wise count rates for Quadrant A Data is divided into 100 sec bins |
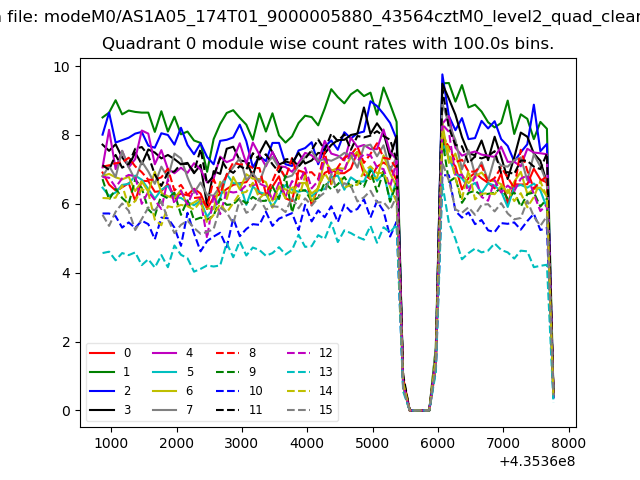 |
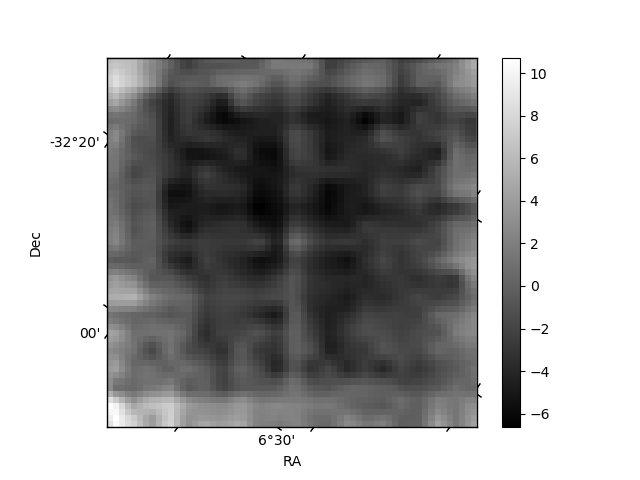 |
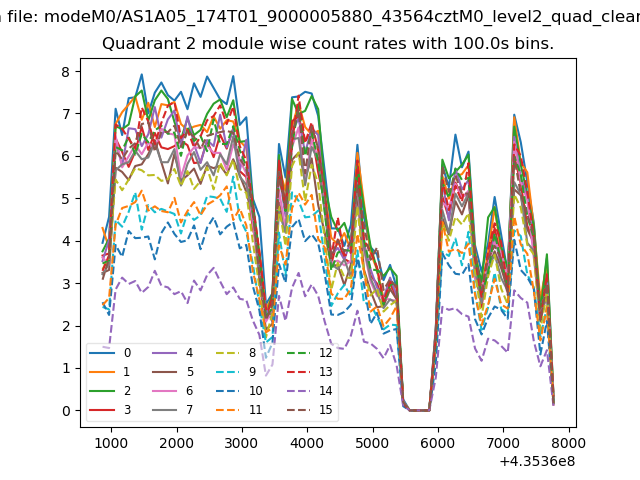
| Module-wise count rates for Quadrant B Data is divided into 100 sec bins |
 |
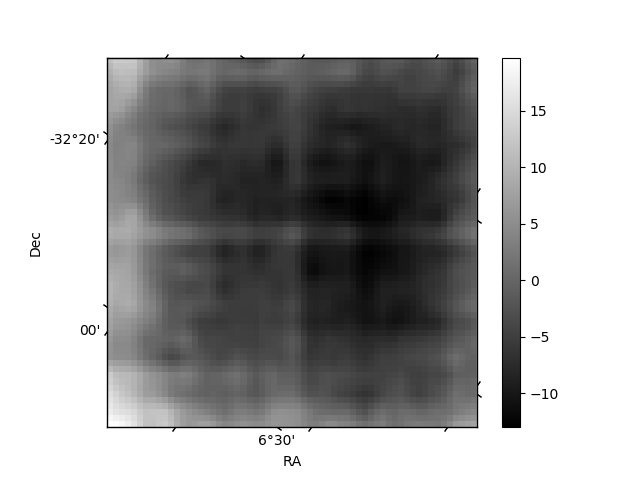 |
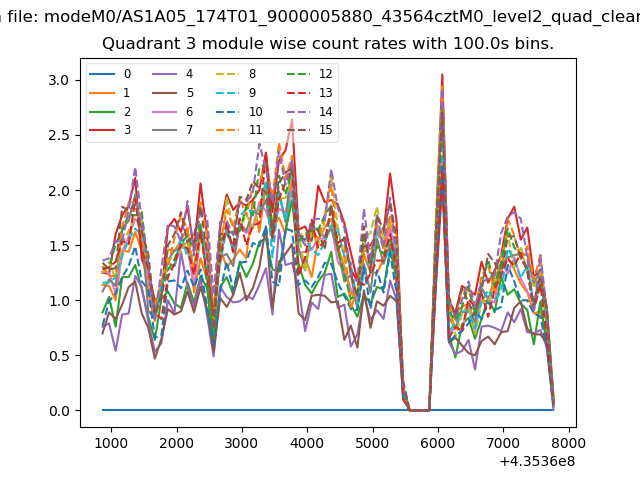
| Module-wise count rates for Quadrant C Data is divided into 100 sec bins |
 |
 |
| Module-wise count rates for Quadrant D Data is divided into 100 sec bins |
 |
 |
| Parameter | Plot |
|---|---|
| CZT HV Monitor | 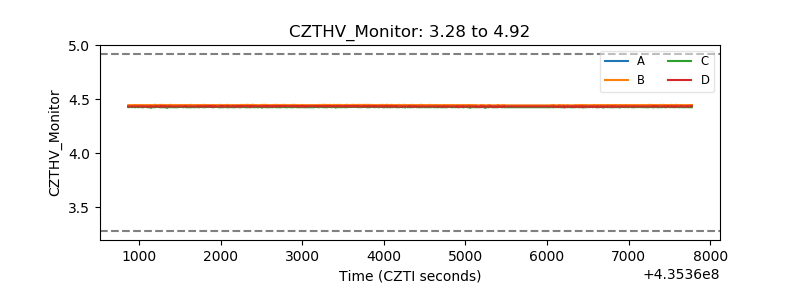 |
| D_VDD | 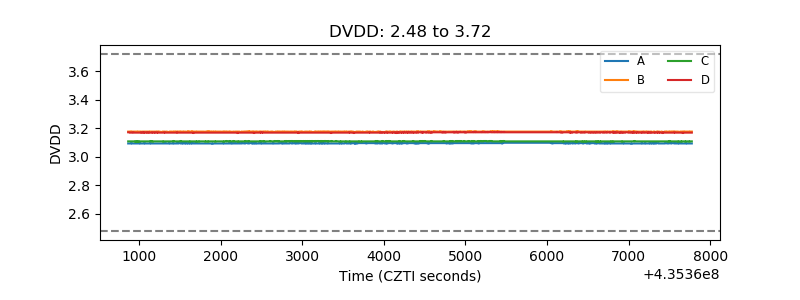 |
| Temperature 1 | 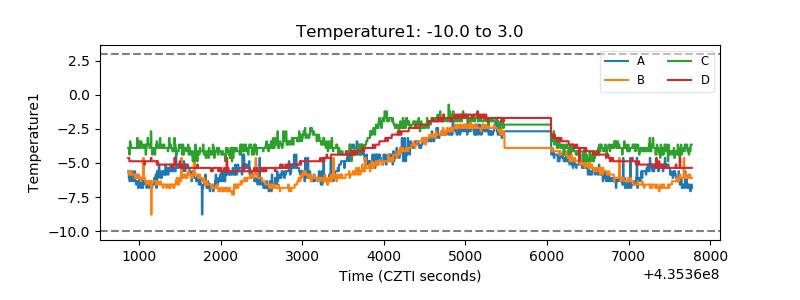 |
| Veto HV Monitor | 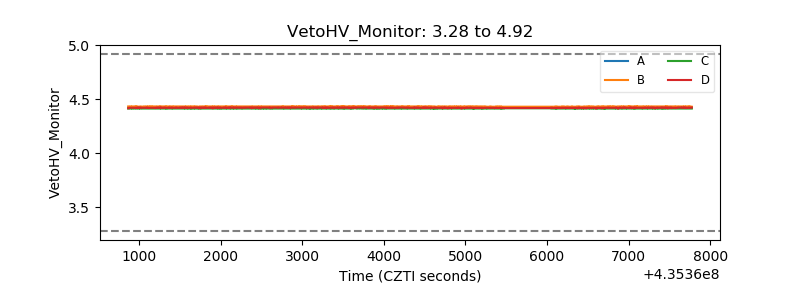 |
| Veto LLD | 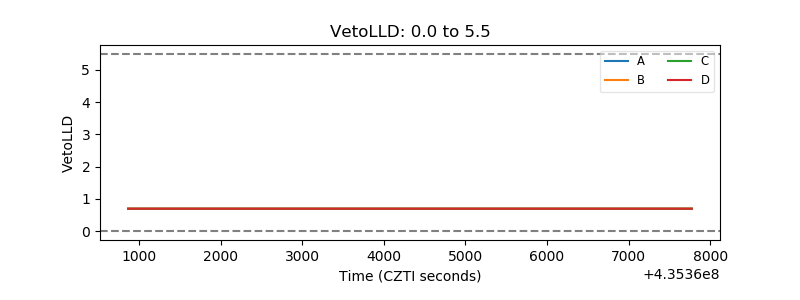 |
| Alpha Counter | 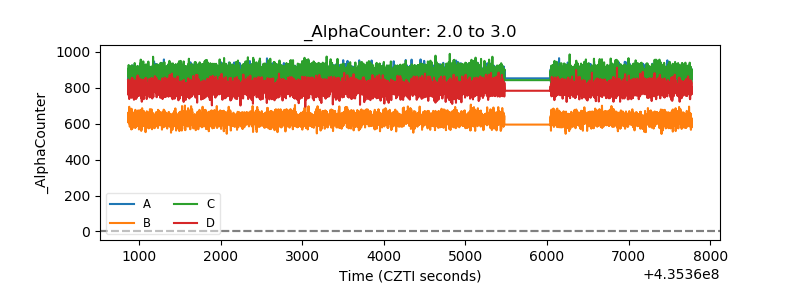 |
| _CPM_Rate | 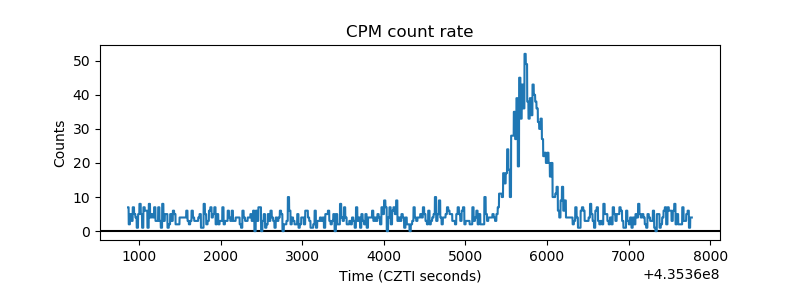 |
| CZT Counter | 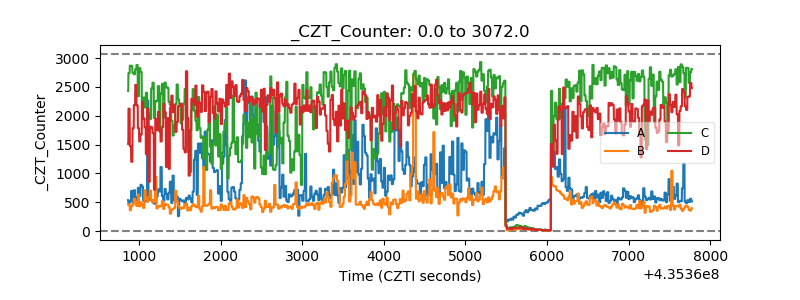 |
| +2.5 Volts monitor | 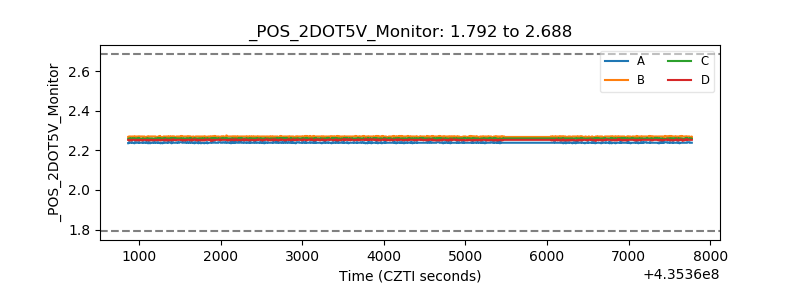 |
| +5 Volts monitor | 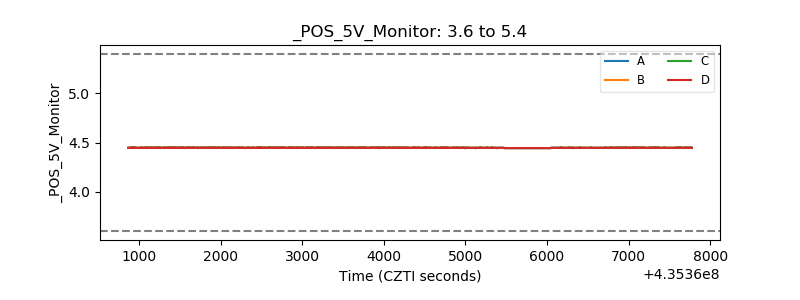 |
| _ROLL_ROT | 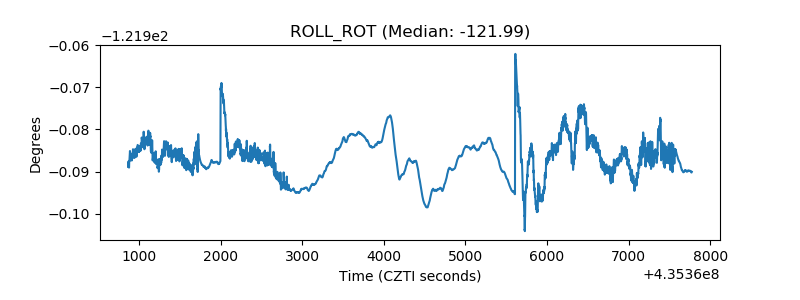 |
| _Roll_DEC | 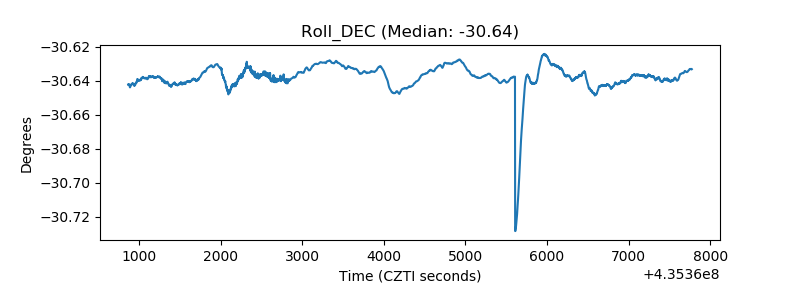 |
| _Roll_RA | 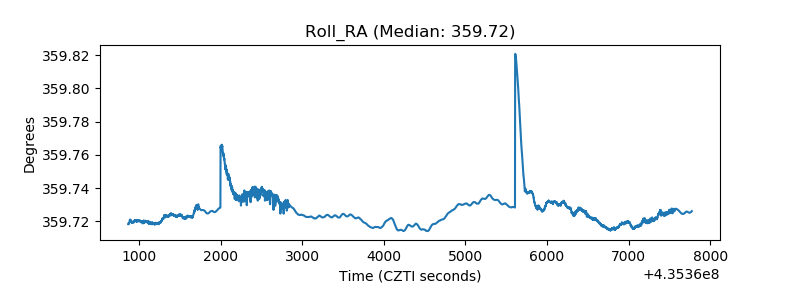 |
| Veto Counter | 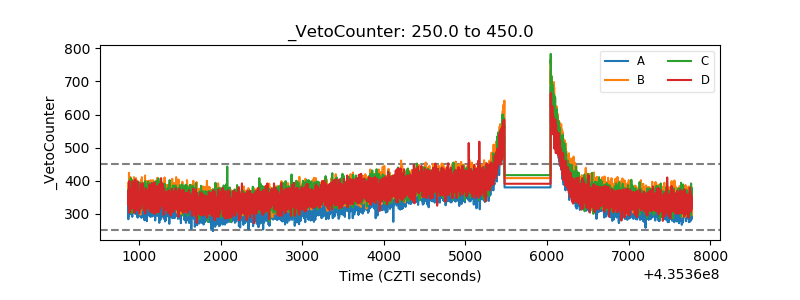 |