| Param | Original file | Final file |
|---|---|---|
| Filename | modeM0/AS1A05_174T01_9000005880_43565cztM0_level2.fits | modeM0/AS1A05_174T01_9000005880_43565cztM0_level2_quad_clean.evt |
| Size (bytes) | 1,246,075,200 | 82,586,880 |
| Size | 1.2 GB | 78.8 MB |
| Events in quadrant A | 7,194,529 | 749,091 |
| Events in quadrant B | 4,183,793 | 786,616 |
| Events in quadrant C | 18,184,240 | 333,673 |
| Events in quadrant D | 16,015,474 | 130,006 |
| Mode M0 | |||
|---|---|---|---|
| Quadrant | BADHDUFLAG | Total packets | Discarded packets |
| A | 0 | 26411 | 1 |
| B | 0 | 17395 | 3 |
| C | 0 | 58789 | 1 |
| D | 0 | 52372 | 1 |
| Mode SS | |||
|---|---|---|---|
| Quadrant | BADHDUFLAG | Total packets | Discarded packets |
| A | 0 | 142 | 0 |
| B | 0 | 142 | 0 |
| C | 0 | 142 | 0 |
| D | 0 | 142 | 0 |
| Quadrant | Total seconds | Saturated seconds | Saturation percentage |
|---|---|---|---|
| A | 7095 | 749 | 10.556730% |
| B | 7095 | 159 | 2.241015% |
| C | 7095 | 6711 | 94.587738% |
| D | 7095 | 7094 | 99.985906% |
Noise dominated data is calculated using 1-second bins in cleaned event files. If a bin has >2000 counts, and if more than 50% of those come from <1% of pixels, then it is considered to be noise-dominated and hence unusable.
| Quadrant | # 1 sec bins | Bins with >0 counts | Bins with >2000 counts | High rate bins dominated by noise | Noise dominated (total time) | Noise dominated (detector-on time) | Marked lightcurve |
|---|---|---|---|---|---|---|---|
| A | 7125 | 7097 | 276 | 276 | 3.87% | 3.89% | 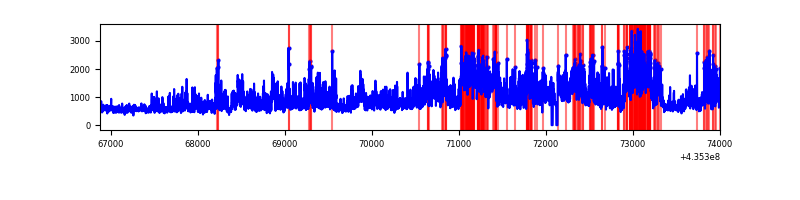 |
| B | 7125 | 7097 | 24 | 24 | 0.34% | 0.34% | 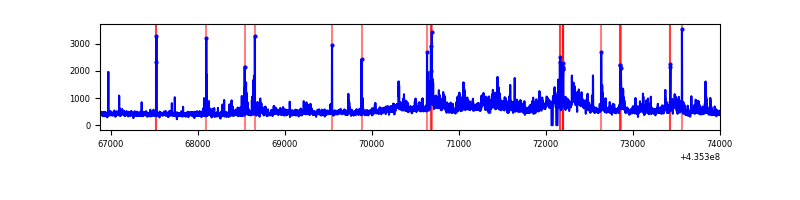 |
| C | 7125 | 7095 | 6512 | 6512 | 91.40% | 91.78% | 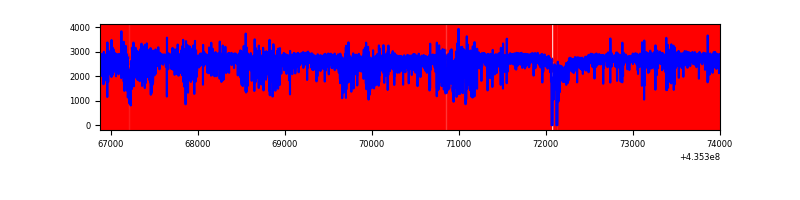 |
| D | 7124 | 7094 | 5950 | 5950 | 83.52% | 83.87% | 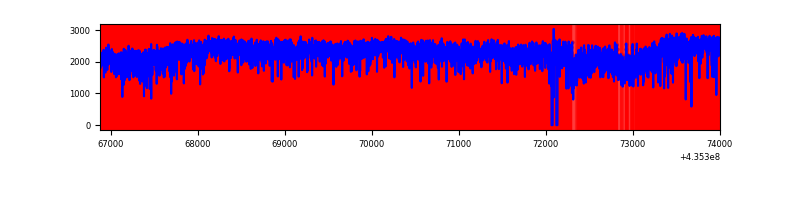 |
Top three noisy pixels from each quadrant. If the there are fewer than three noisy pixels in the level2.evt file, extra rows are filled as -1
| Pixel properties | Quadrant properties | ||||||
|---|---|---|---|---|---|---|---|
| Quadrant | DetID | PixID | Counts | Sigma | Mean | Median | Sigma |
| A | 0 | 228 | 1651464 | 10222.81 | 776 | 760 | 161.5 |
| A | 15 | 222 | 814090 | 5036.95 | 776 | 760 | 161.5 |
| A | 10 | 99 | 671890 | 4156.31 | 776 | 760 | 161.5 |
| B | 4 | 206 | 553447 | 3540.37 | 796 | 771 | 156.1 |
| B | 12 | 3 | 116300 | 740.06 | 796 | 771 | 156.1 |
| B | 0 | 200 | 65429 | 414.19 | 796 | 771 | 156.1 |
| C | 15 | 174 | 10371453 | 123566.38 | 356 | 358 | 83.9 |
| C | 15 | 142 | 3897002 | 46426.55 | 356 | 358 | 83.9 |
| C | 15 | 158 | 921755 | 10977.98 | 356 | 358 | 83.9 |
| D | 4 | 216 | 8300587 | 158104.99 | 167 | 160 | 52.5 |
| D | 4 | 212 | 3449818 | 65708.45 | 167 | 160 | 52.5 |
| D | 5 | 222 | 474510 | 9035.33 | 167 | 160 | 52.5 |
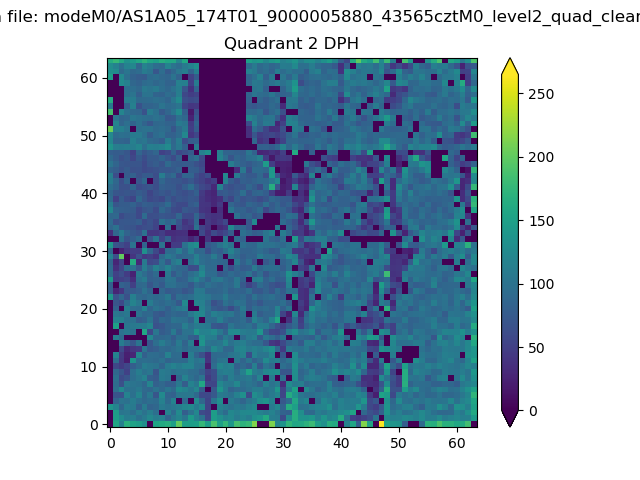
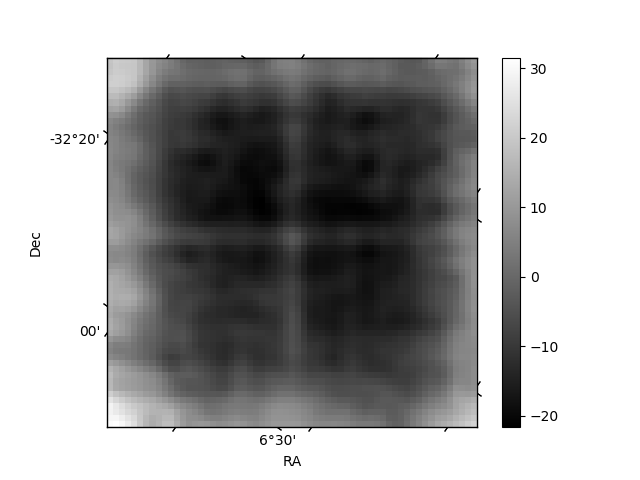
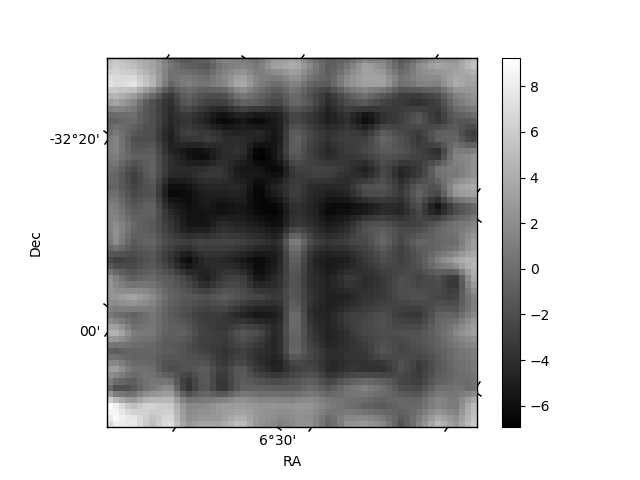
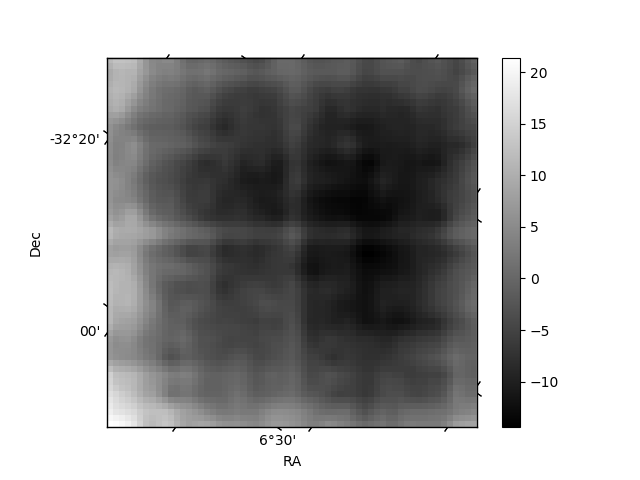
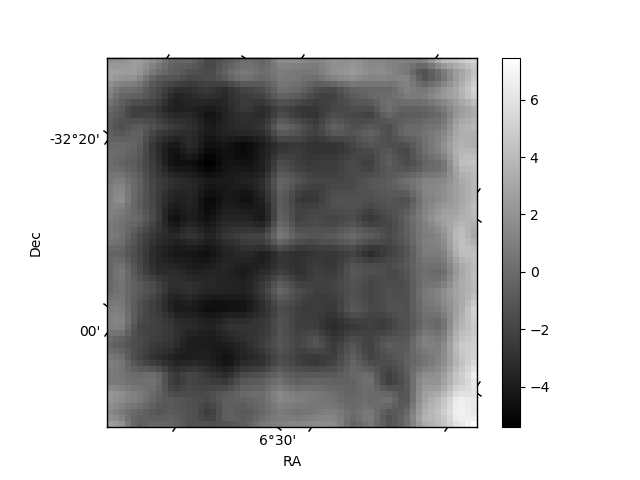
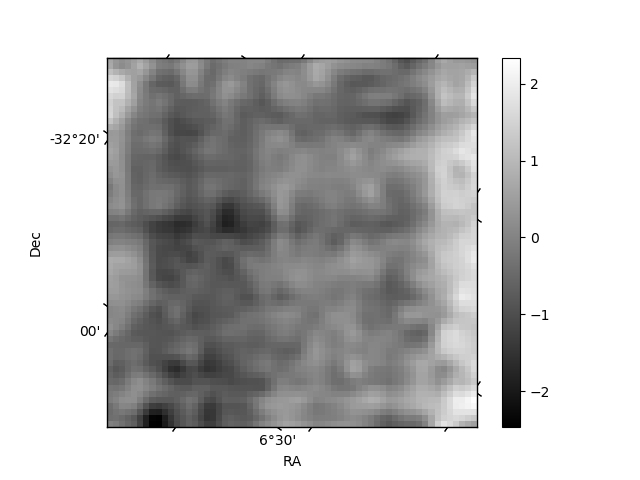
Histogram calculated using DETX and DETY for each event in the final _common_clean file
| Quadrant A | 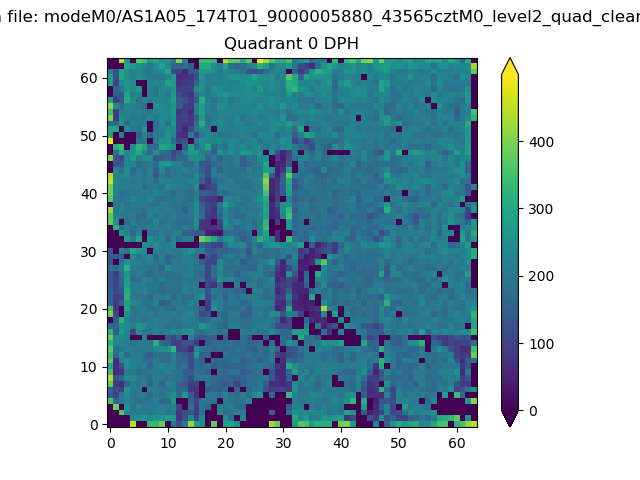 |
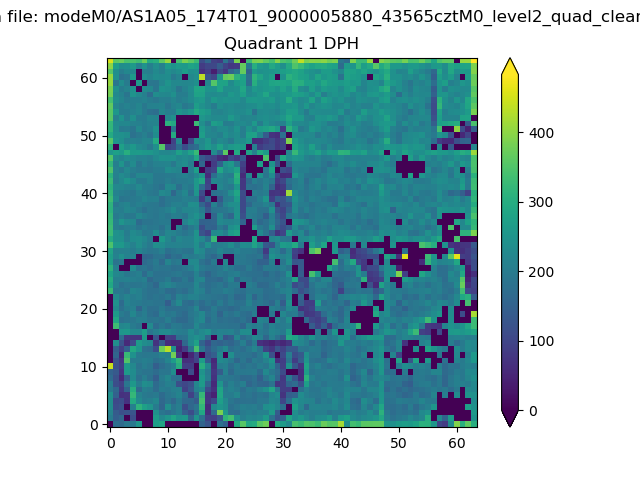 |
Quadrant B |
|---|---|---|---|
| Quadrant D | 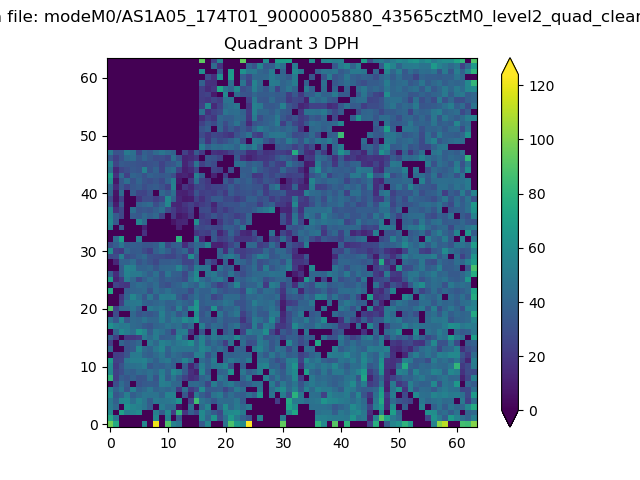 |
 |
Quadrant C |
| Plot type | Count rate plots | Images |
|---|---|---|
| Comparison with Poisson distribution Blue bars denote a histogram of data divided into 1 sec bins. Red curve is a Poisson curve with rate = median count rate of data. |
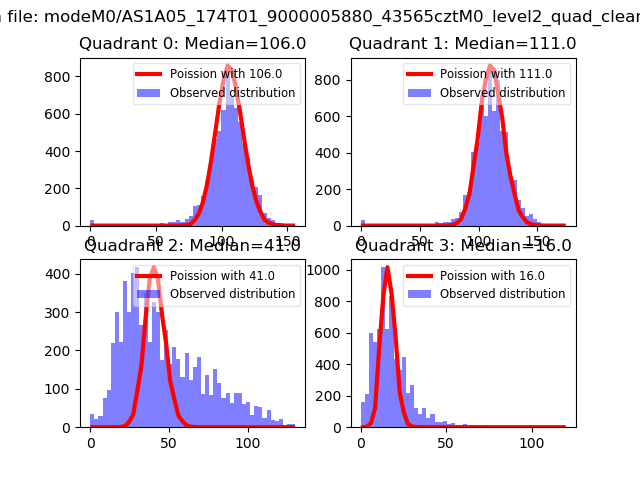 |
 |
| Quadrant-wise count rates Data is divided into 100 sec bins |
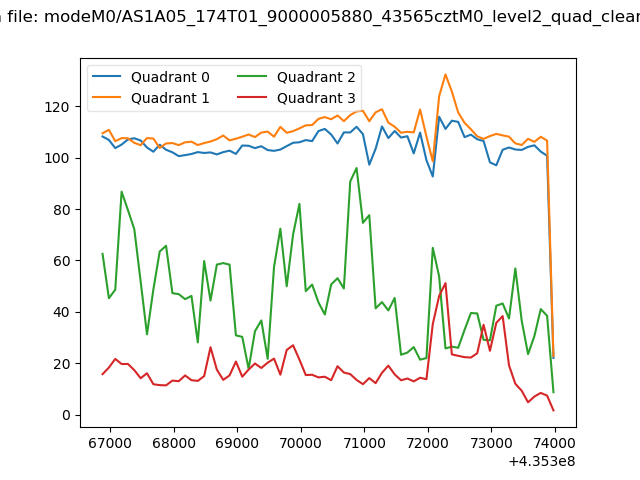 |
|
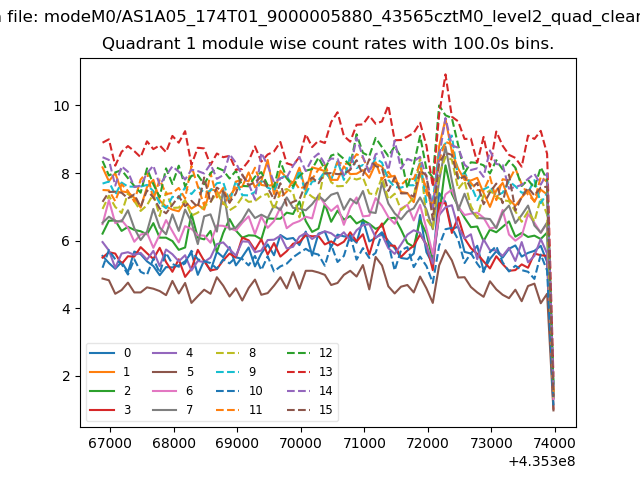
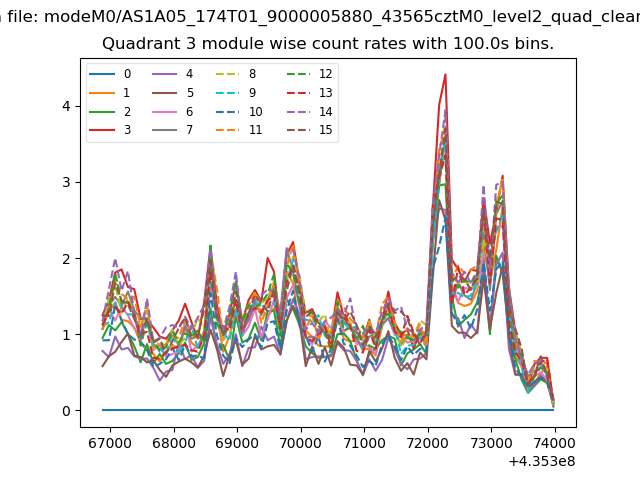
| Module-wise count rates for Quadrant A Data is divided into 100 sec bins |
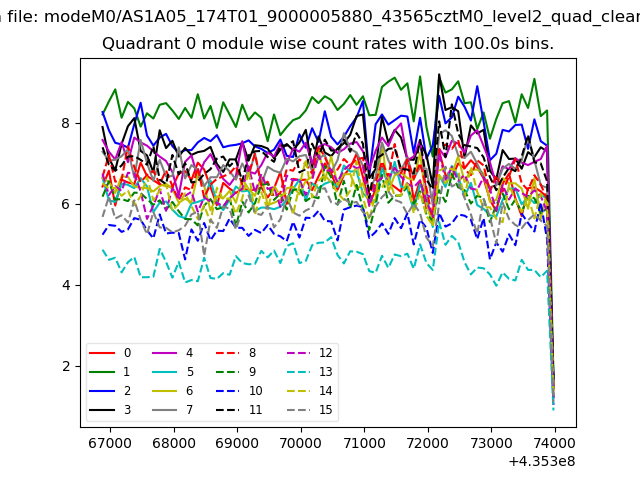 |
 |
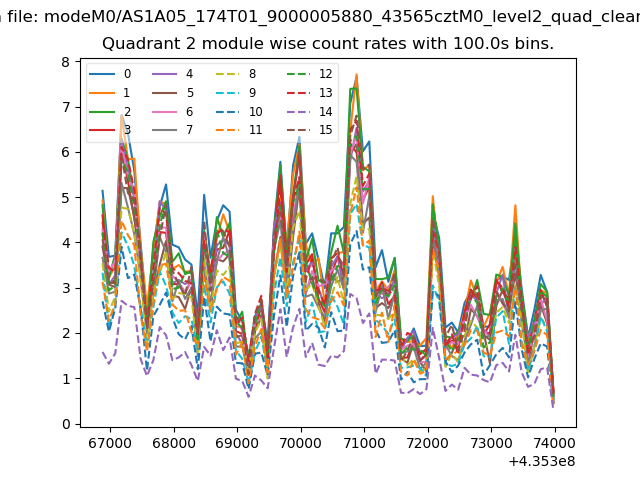
| Module-wise count rates for Quadrant B Data is divided into 100 sec bins |
 |
 |
| Module-wise count rates for Quadrant C Data is divided into 100 sec bins |
 |
 |
| Module-wise count rates for Quadrant D Data is divided into 100 sec bins |
 |
 |
| Parameter | Plot |
|---|---|
| CZT HV Monitor | 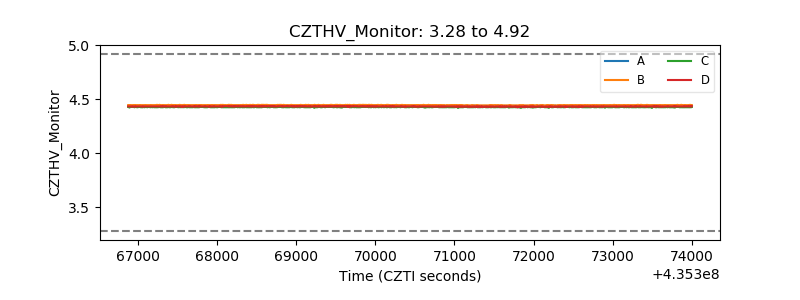 |
| D_VDD | 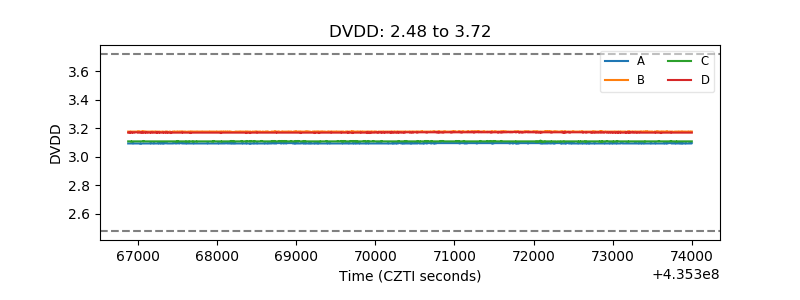 |
| Temperature 1 | 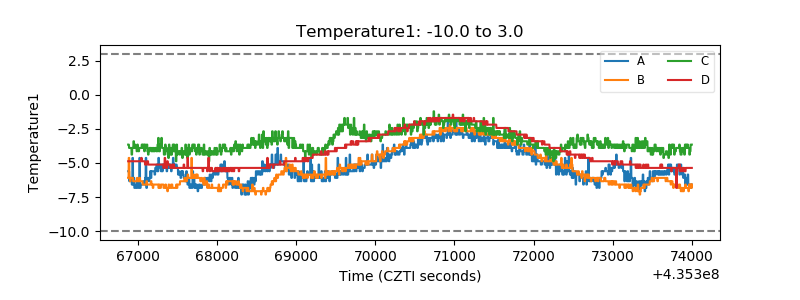 |
| Veto HV Monitor | 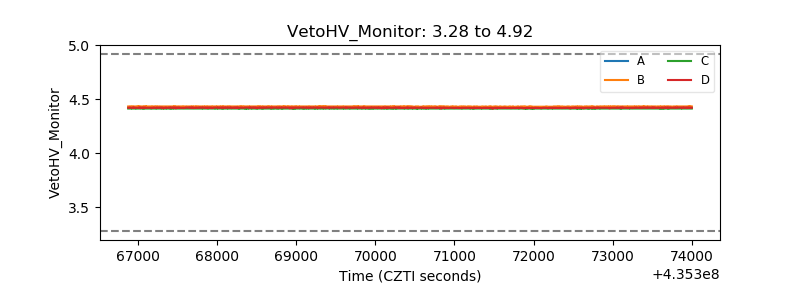 |
| Veto LLD | 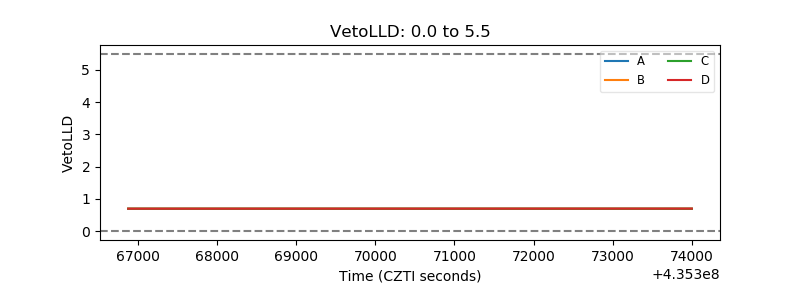 |
| Alpha Counter | 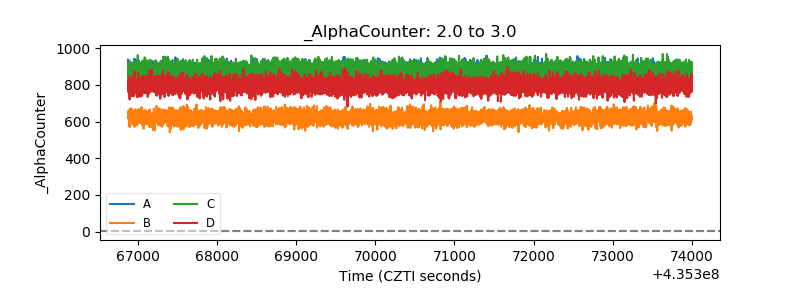 |
| _CPM_Rate | 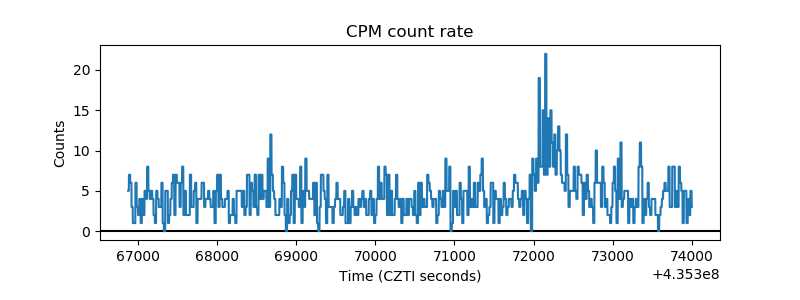 |
| CZT Counter | 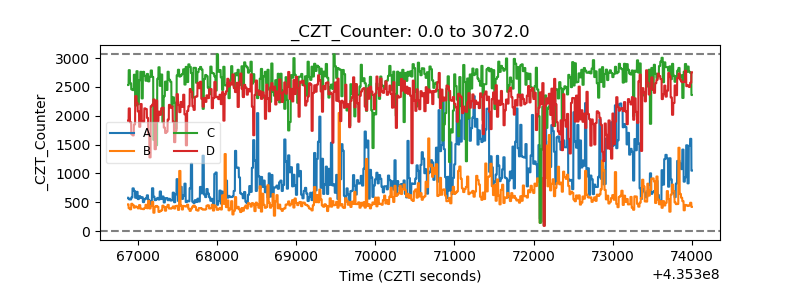 |
| +2.5 Volts monitor | 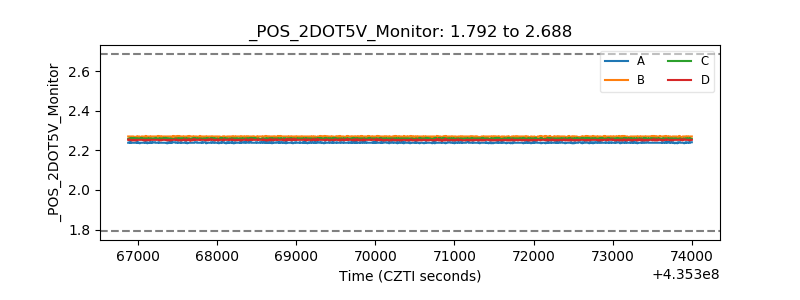 |
| +5 Volts monitor | 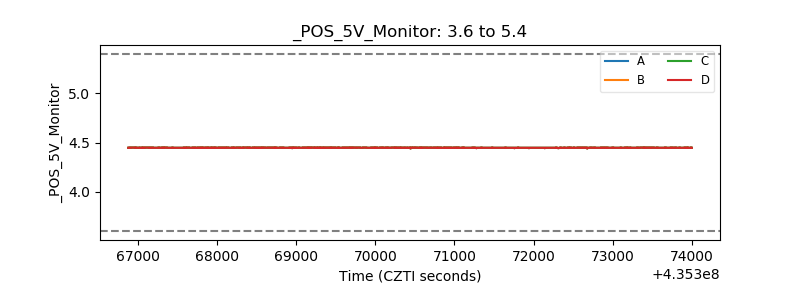 |
| _ROLL_ROT | 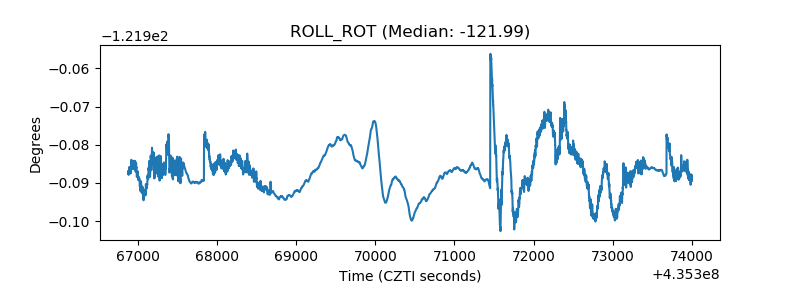 |
| _Roll_DEC | 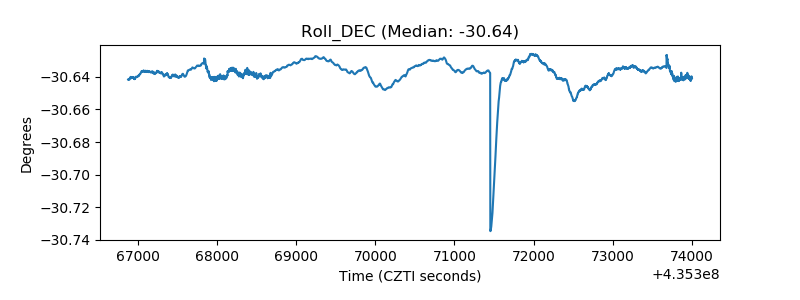 |
| _Roll_RA | 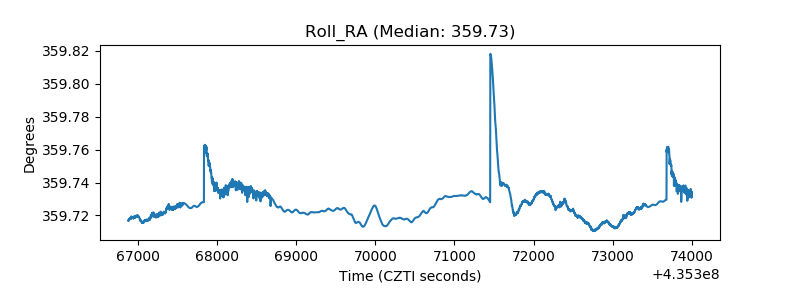 |
| Veto Counter | 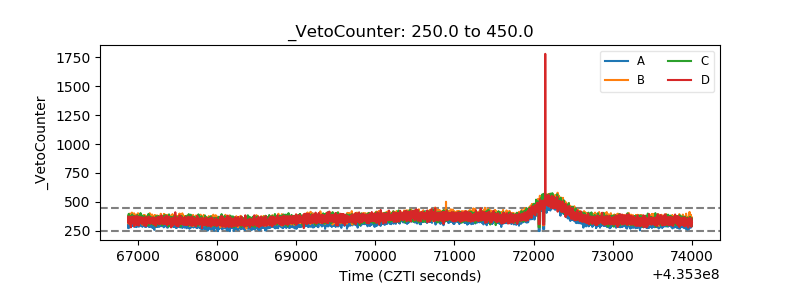 |