| Param | Original file | Final file |
|---|---|---|
| Filename | modeM0/AS1A05_174T01_9000005880_43570cztM0_level2.fits | modeM0/AS1A05_174T01_9000005880_43570cztM0_level2_quad_clean.evt |
| Size (bytes) | 1,232,640,000 | 89,282,880 |
| Size | 1.1 GB | 85.1 MB |
| Events in quadrant A | 9,444,820 | 727,354 |
| Events in quadrant B | 6,348,319 | 777,260 |
| Events in quadrant C | 15,940,546 | 532,938 |
| Events in quadrant D | 13,347,275 | 164,887 |
| Mode M9 | |||
|---|---|---|---|
| Quadrant | BADHDUFLAG | Total packets | Discarded packets |
| A | 0 | 11 | 0 |
| B | 0 | 12 | 0 |
| C | 0 | 12 | 0 |
| D | 0 | 12 | 0 |
| Mode M0 | |||
|---|---|---|---|
| Quadrant | BADHDUFLAG | Total packets | Discarded packets |
| A | 0 | 33113 | 2 |
| B | 0 | 24046 | 2 |
| C | 0 | 52247 | 2 |
| D | 0 | 44506 | 2 |
| Mode SS | |||
|---|---|---|---|
| Quadrant | BADHDUFLAG | Total packets | Discarded packets |
| A | 0 | 144 | 0 |
| B | 0 | 144 | 0 |
| C | 0 | 144 | 0 |
| D | 0 | 144 | 0 |
| Quadrant | Total seconds | Saturated seconds | Saturation percentage |
|---|---|---|---|
| A | 7093 | 1352 | 19.061046% |
| B | 7093 | 450 | 6.344283% |
| C | 7093 | 5483 | 77.301565% |
| D | 7092 | 7084 | 99.887197% |
Noise dominated data is calculated using 1-second bins in cleaned event files. If a bin has >2000 counts, and if more than 50% of those come from <1% of pixels, then it is considered to be noise-dominated and hence unusable.
| Quadrant | # 1 sec bins | Bins with >0 counts | Bins with >2000 counts | High rate bins dominated by noise | Noise dominated (total time) | Noise dominated (detector-on time) | Marked lightcurve |
|---|---|---|---|---|---|---|---|
| A | 7838 | 7093 | 917 | 917 | 11.70% | 12.93% | 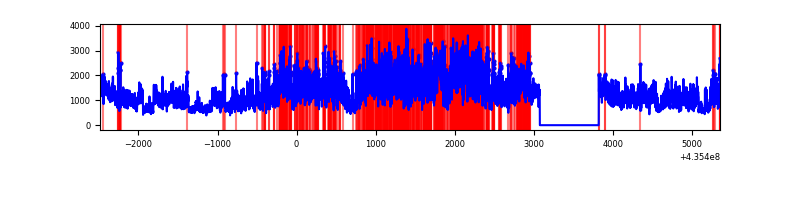 |
| B | 7838 | 7093 | 147 | 147 | 1.88% | 2.07% |  |
| C | 7837 | 7092 | 4889 | 4889 | 62.38% | 68.94% | 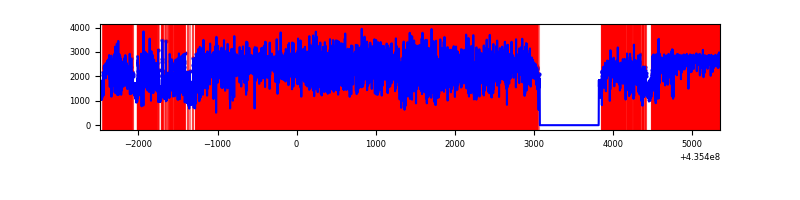 |
| D | 7836 | 7091 | 2744 | 2744 | 35.02% | 38.70% | 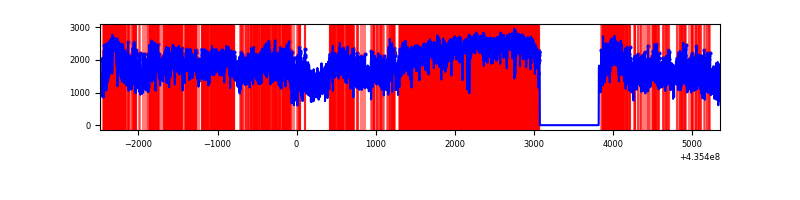 |
Top three noisy pixels from each quadrant. If the there are fewer than three noisy pixels in the level2.evt file, extra rows are filled as -1
| Pixel properties | Quadrant properties | ||||||
|---|---|---|---|---|---|---|---|
| Quadrant | DetID | PixID | Counts | Sigma | Mean | Median | Sigma |
| A | 15 | 222 | 2947916 | 18155.72 | 778 | 759 | 162.3 |
| A | 10 | 99 | 1300705 | 8008.21 | 778 | 759 | 162.3 |
| A | 0 | 228 | 1087399 | 6694.16 | 778 | 759 | 162.3 |
| B | 4 | 206 | 2357741 | 14654.18 | 803 | 778 | 160.8 |
| B | 3 | 25 | 334439 | 2074.5 | 803 | 778 | 160.8 |
| B | 0 | 199 | 161306 | 998.07 | 803 | 778 | 160.8 |
| C | 15 | 142 | 7541864 | 55755.6 | 568 | 570 | 135.3 |
| C | 15 | 174 | 3436016 | 25399.53 | 568 | 570 | 135.3 |
| C | 15 | 126 | 758699 | 5605.13 | 568 | 570 | 135.3 |
| D | 4 | 216 | 5190635 | 78827.99 | 220 | 210 | 65.8 |
| D | 4 | 212 | 3169408 | 48131.22 | 220 | 210 | 65.8 |
| D | 14 | 210 | 686175 | 10417.88 | 220 | 210 | 65.8 |
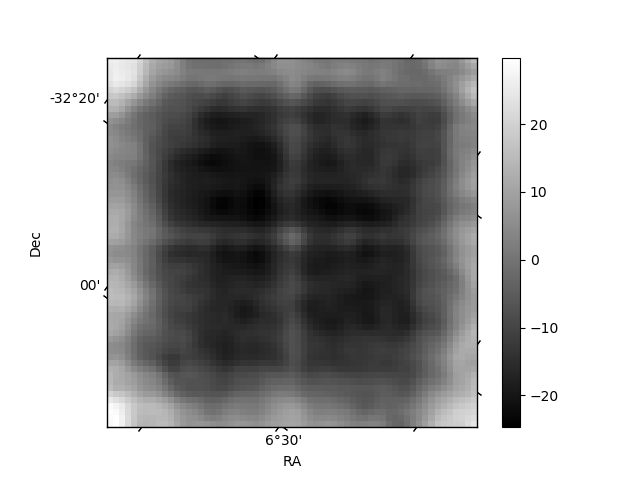
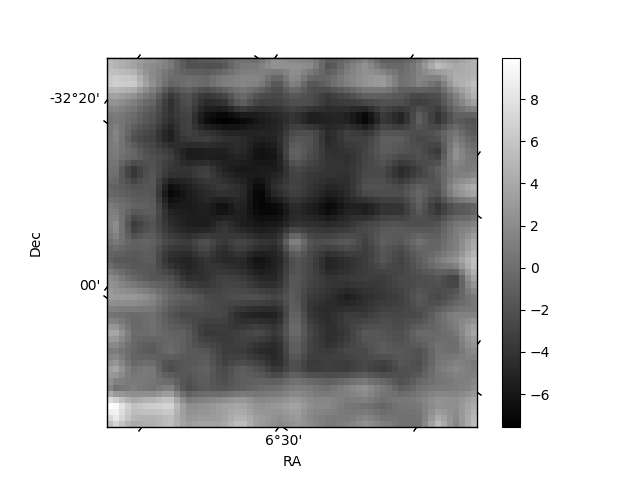
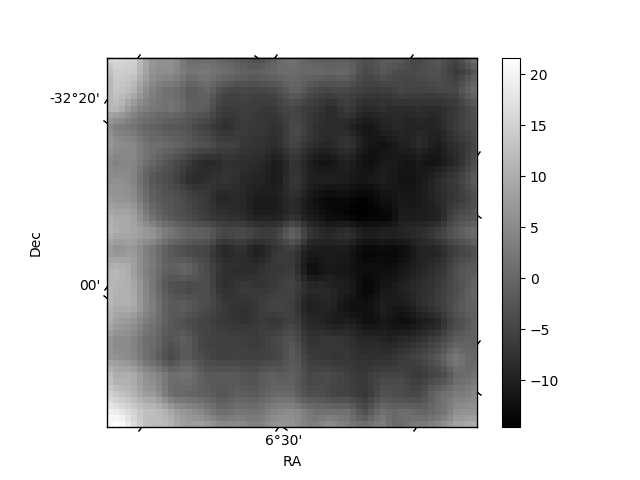
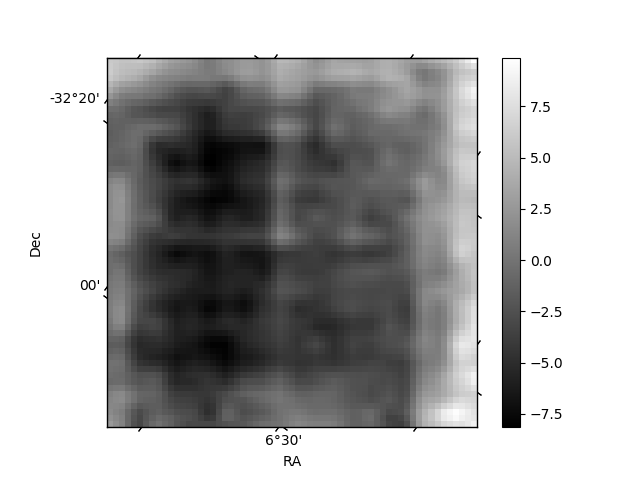
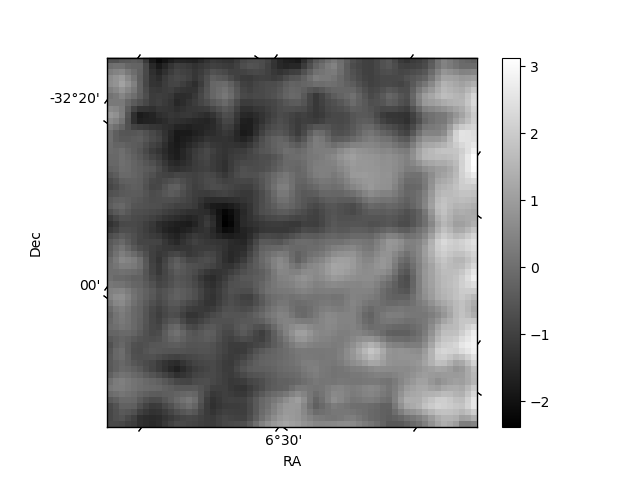
Histogram calculated using DETX and DETY for each event in the final _common_clean file
| Quadrant A | 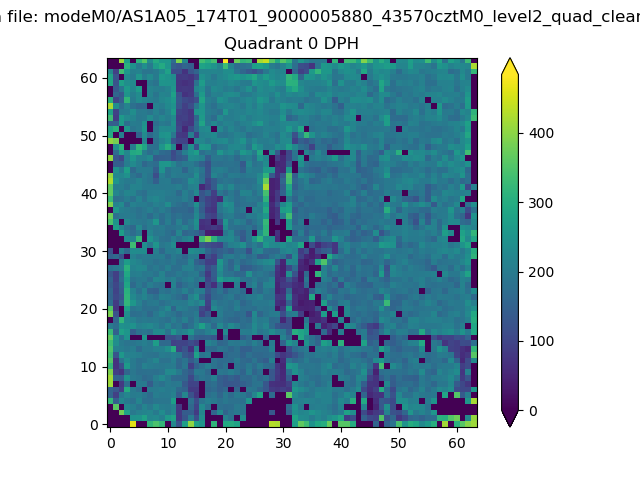 |
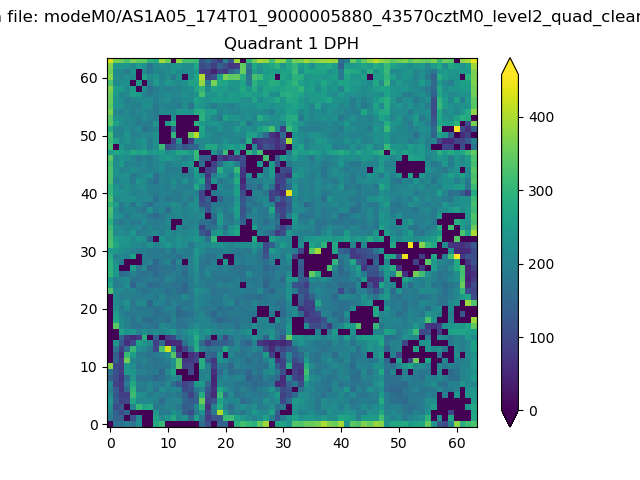 |
Quadrant B |
|---|---|---|---|
| Quadrant D | 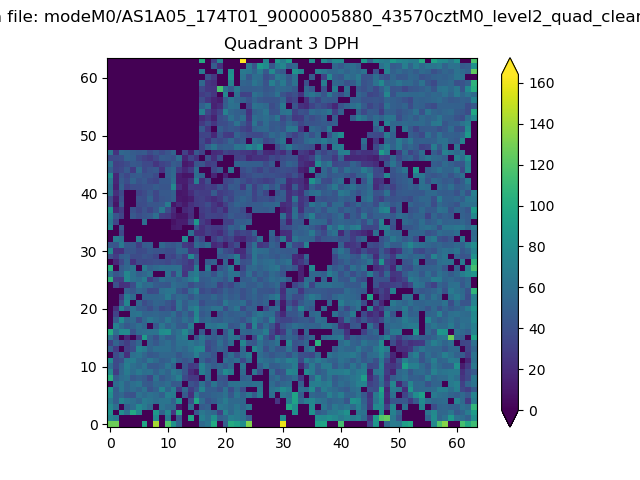 |
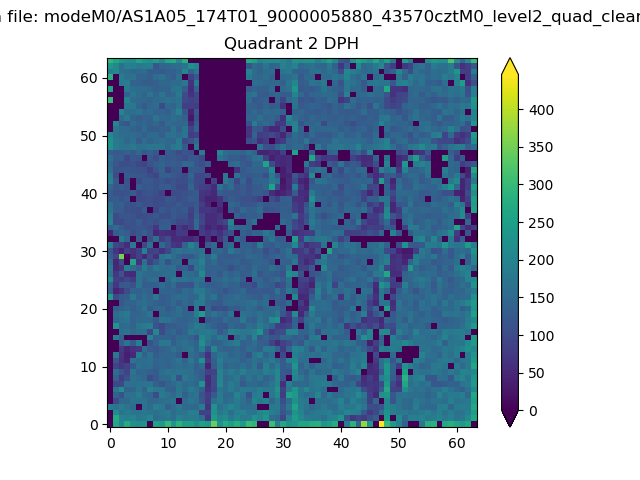 |
Quadrant C |
| Plot type | Count rate plots | Images |
|---|---|---|
| Comparison with Poisson distribution Blue bars denote a histogram of data divided into 1 sec bins. Red curve is a Poisson curve with rate = median count rate of data. |
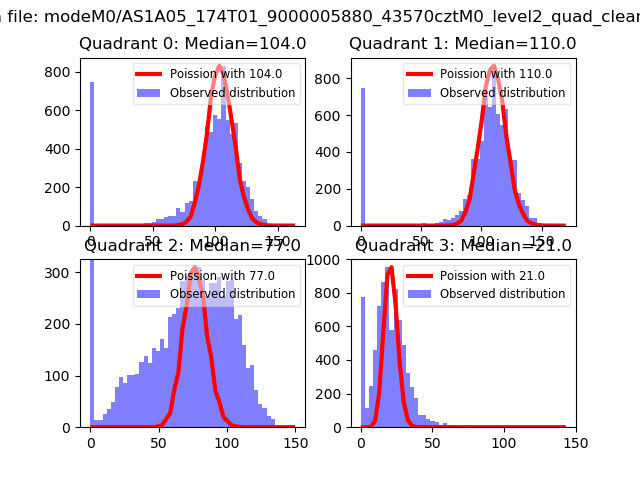 |
 |
| Quadrant-wise count rates Data is divided into 100 sec bins |
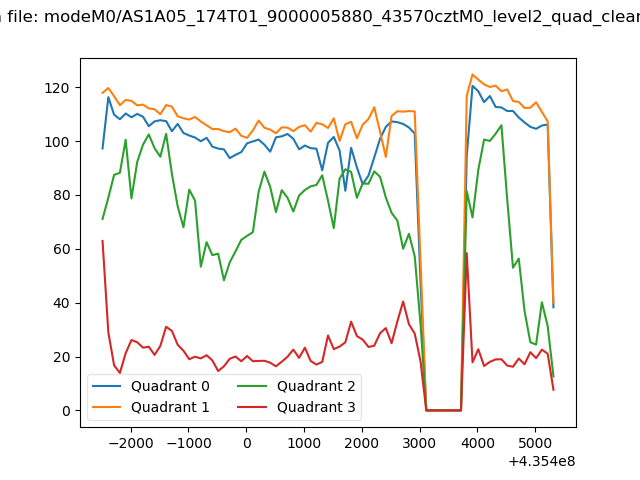 |
|
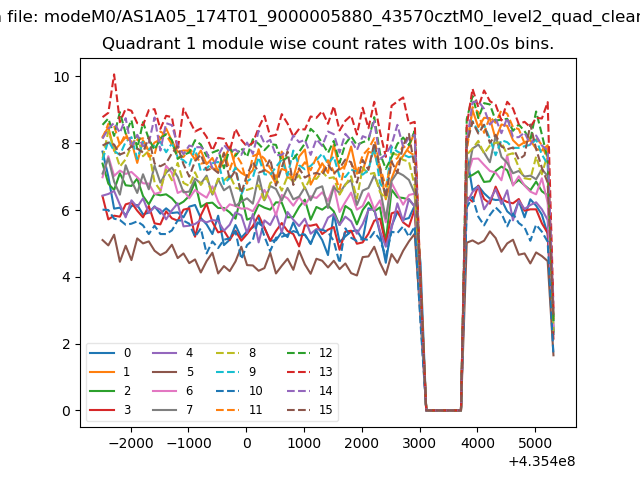
| Module-wise count rates for Quadrant A Data is divided into 100 sec bins |
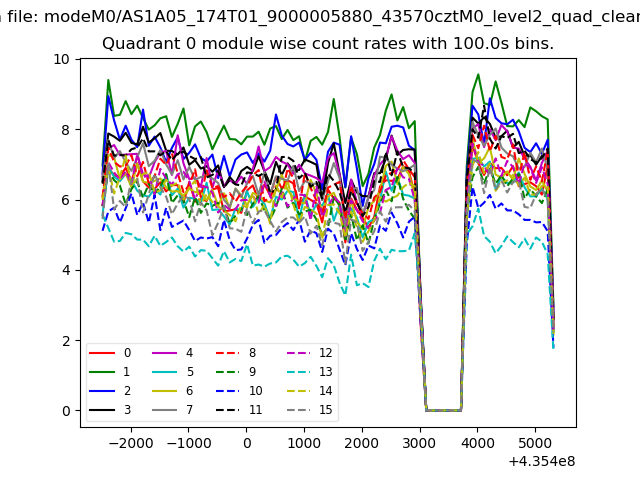 |
 |
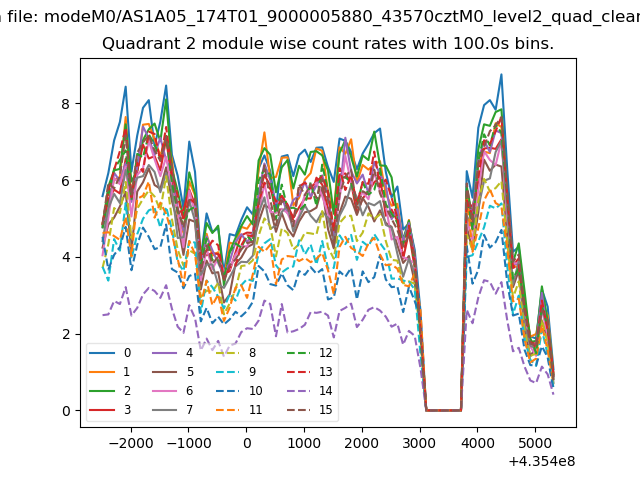
| Module-wise count rates for Quadrant B Data is divided into 100 sec bins |
 |
 |
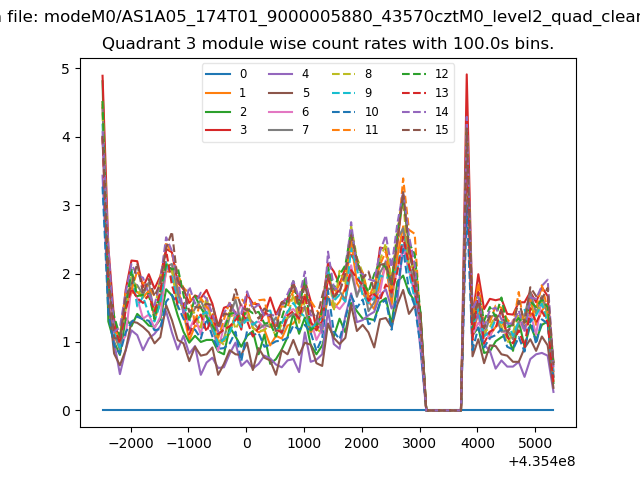
| Module-wise count rates for Quadrant C Data is divided into 100 sec bins |
 |
 |
| Module-wise count rates for Quadrant D Data is divided into 100 sec bins |
 |
 |
| Parameter | Plot |
|---|---|
| CZT HV Monitor | 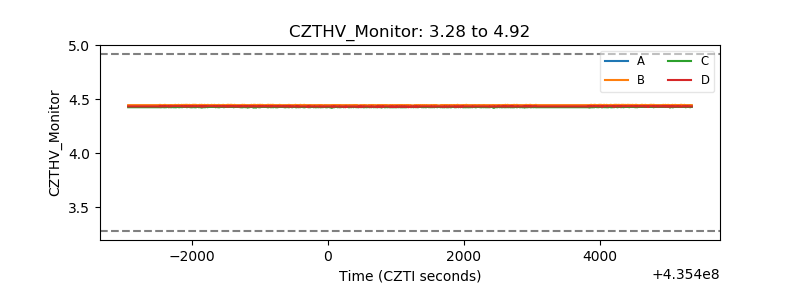 |
| D_VDD | 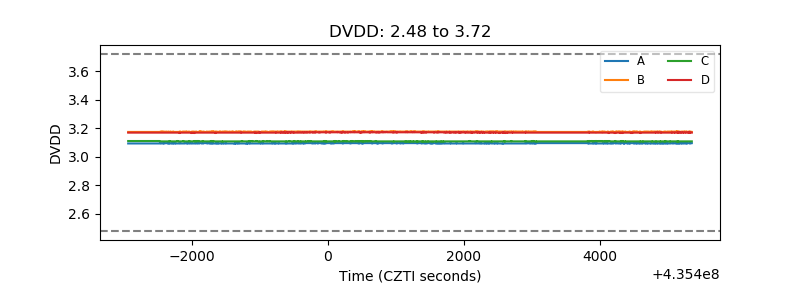 |
| Temperature 1 | 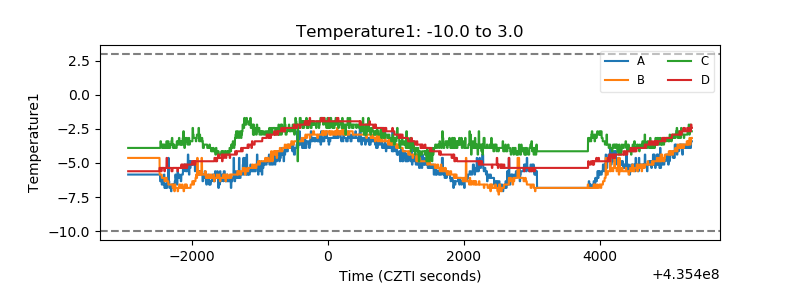 |
| Veto HV Monitor | 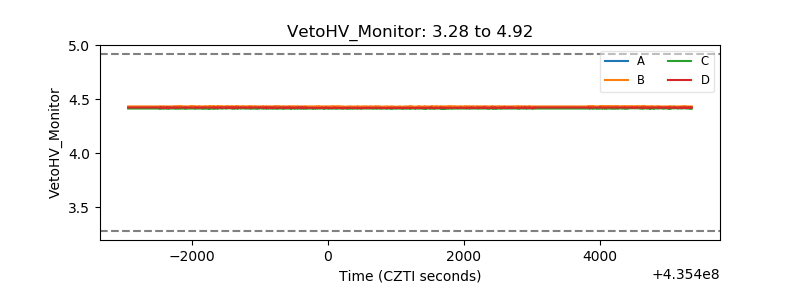 |
| Veto LLD | 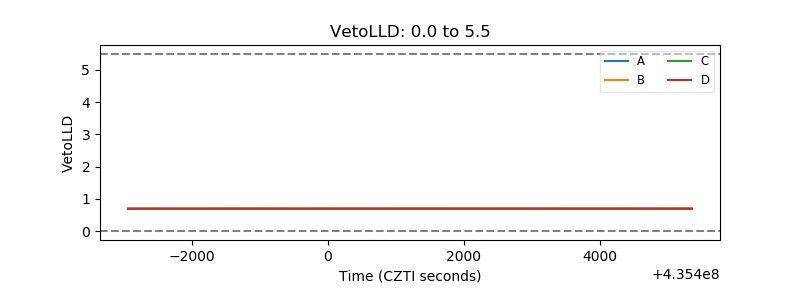 |
| Alpha Counter | 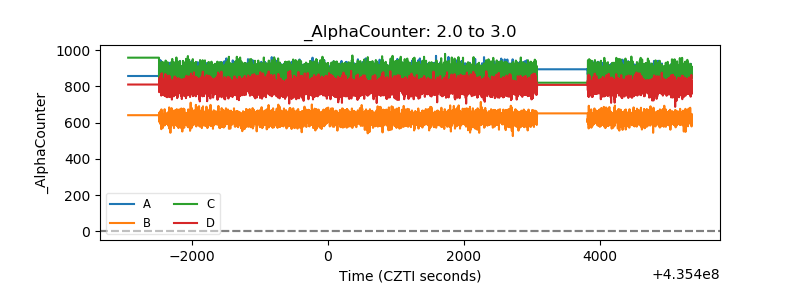 |
| _CPM_Rate | 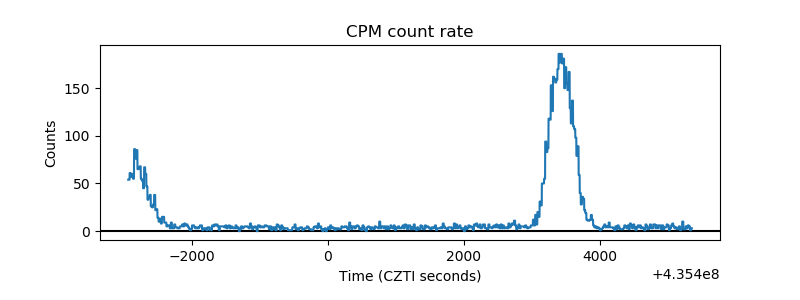 |
| CZT Counter | 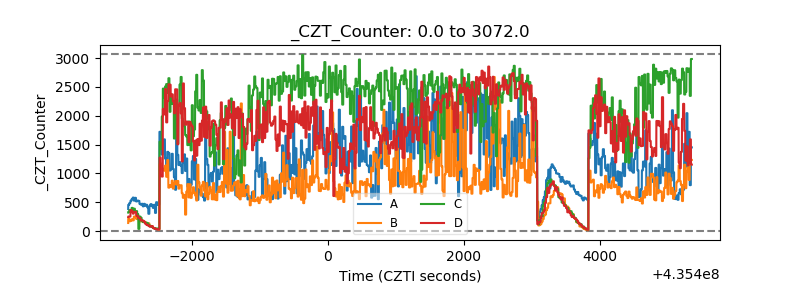 |
| +2.5 Volts monitor | 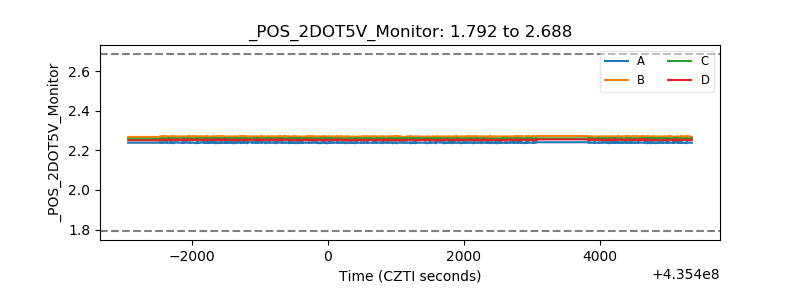 |
| +5 Volts monitor | 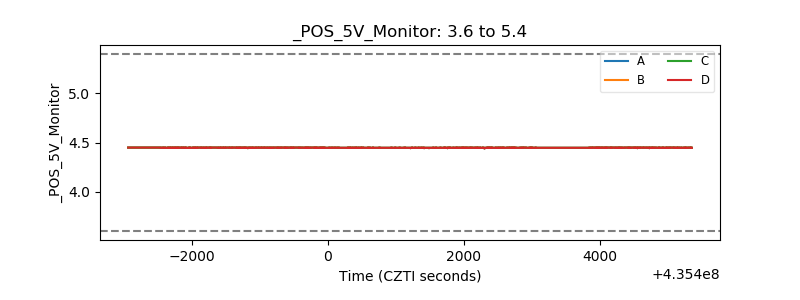 |
| _ROLL_ROT | 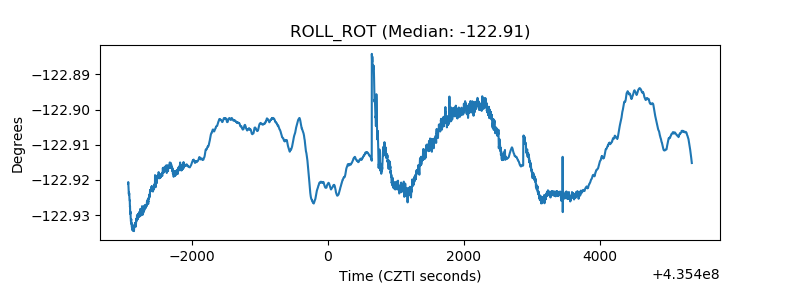 |
| _Roll_DEC | 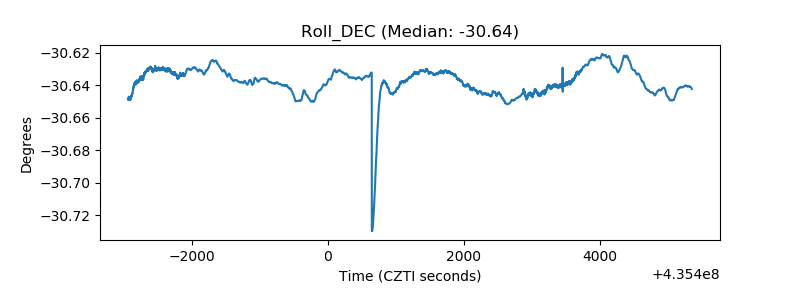 |
| _Roll_RA | 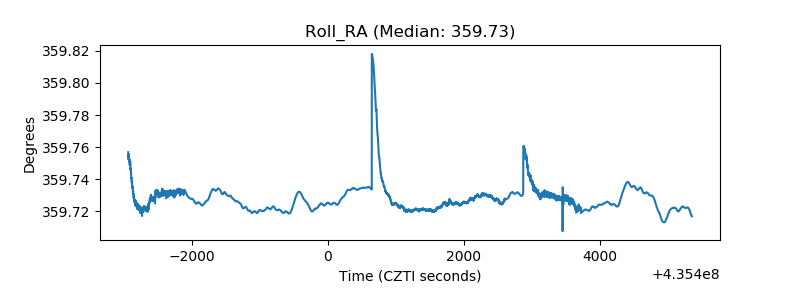 |
| Veto Counter | 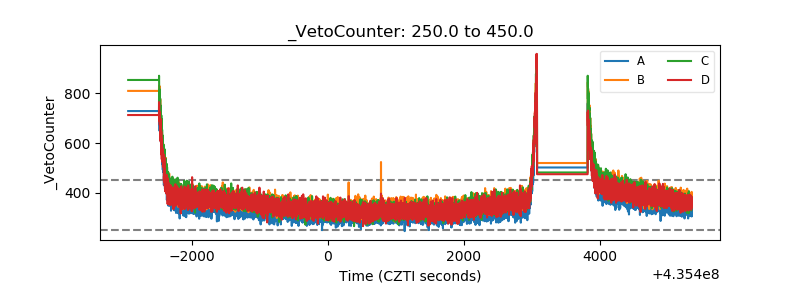 |