| Param | Original file | Final file |
|---|---|---|
| Filename | modeM0/AS1A05_174T01_9000005880_43571cztM0_level2.fits | modeM0/AS1A05_174T01_9000005880_43571cztM0_level2_quad_clean.evt |
| Size (bytes) | 1,130,103,360 | 83,759,040 |
| Size | 1.1 GB | 79.9 MB |
| Events in quadrant A | 7,153,199 | 716,795 |
| Events in quadrant B | 6,087,352 | 743,346 |
| Events in quadrant C | 16,135,217 | 432,130 |
| Events in quadrant D | 11,938,380 | 169,675 |
| Mode M9 | |||
|---|---|---|---|
| Quadrant | BADHDUFLAG | Total packets | Discarded packets |
| A | 0 | 14 | 1 |
| B | 0 | 14 | 0 |
| C | 0 | 15 | 1 |
| D | 0 | 14 | 0 |
| Mode M0 | |||
|---|---|---|---|
| Quadrant | BADHDUFLAG | Total packets | Discarded packets |
| A | 0 | 26501 | 426 |
| B | 0 | 23198 | 294 |
| C | 0 | 53566 | 1020 |
| D | 0 | 40868 | 763 |
| Mode SS | |||
|---|---|---|---|
| Quadrant | BADHDUFLAG | Total packets | Discarded packets |
| A | 0 | 140 | 2 |
| B | 0 | 140 | 4 |
| C | 0 | 141 | 5 |
| D | 0 | 140 | 4 |
| Quadrant | Total seconds | Saturated seconds | Saturation percentage |
|---|---|---|---|
| A | 6707 | 809 | 12.062025% |
| B | 6717 | 642 | 9.557838% |
| C | 6693 | 5956 | 88.988495% |
| D | 6697 | 6689 | 99.880544% |
Noise dominated data is calculated using 1-second bins in cleaned event files. If a bin has >2000 counts, and if more than 50% of those come from <1% of pixels, then it is considered to be noise-dominated and hence unusable.
| Quadrant | # 1 sec bins | Bins with >0 counts | Bins with >2000 counts | High rate bins dominated by noise | Noise dominated (total time) | Noise dominated (detector-on time) | Marked lightcurve |
|---|---|---|---|---|---|---|---|
| A | 7770 | 6715 | 509 | 509 | 6.55% | 7.58% | 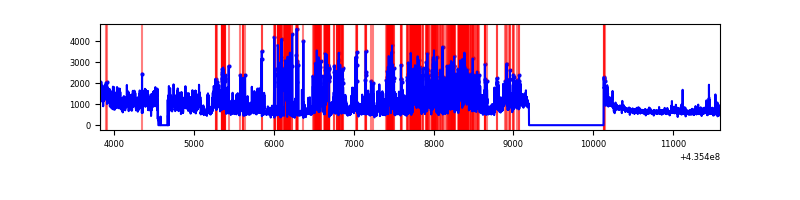 |
| B | 7770 | 6732 | 377 | 377 | 4.85% | 5.60% | 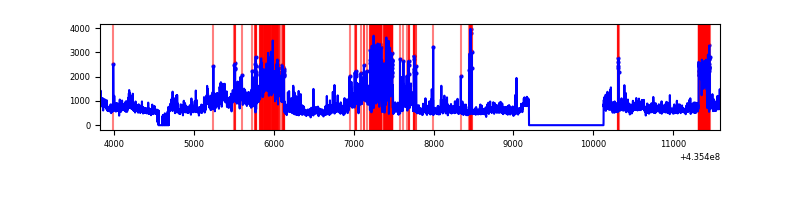 |
| C | 7768 | 6695 | 5475 | 5475 | 70.48% | 81.78% | 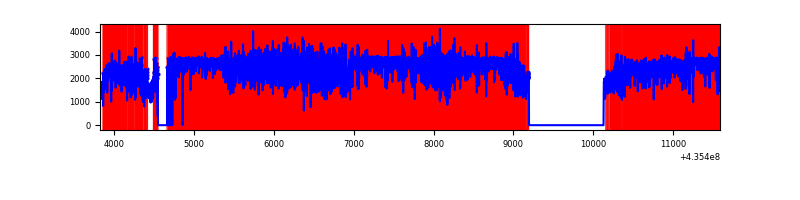 |
| D | 7768 | 6697 | 2362 | 2362 | 30.41% | 35.27% | 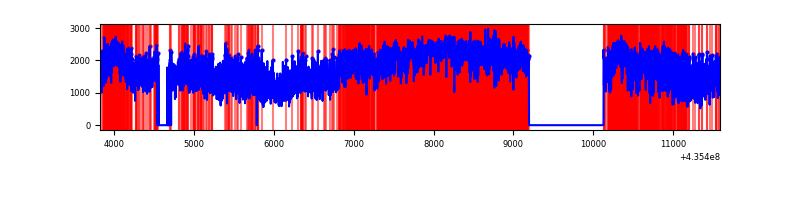 |
Top three noisy pixels from each quadrant. If the there are fewer than three noisy pixels in the level2.evt file, extra rows are filled as -1
| Pixel properties | Quadrant properties | ||||||
|---|---|---|---|---|---|---|---|
| Quadrant | DetID | PixID | Counts | Sigma | Mean | Median | Sigma |
| A | 10 | 99 | 1372015 | 8862.21 | 751 | 734 | 154.7 |
| A | 15 | 222 | 757104 | 4888.21 | 751 | 734 | 154.7 |
| A | 10 | 83 | 752234 | 4856.74 | 751 | 734 | 154.7 |
| B | 4 | 206 | 2413946 | 16264.48 | 755 | 734 | 148.4 |
| B | 0 | 200 | 275715 | 1853.31 | 755 | 734 | 148.4 |
| B | 3 | 25 | 222639 | 1495.59 | 755 | 734 | 148.4 |
| C | 15 | 142 | 6801533 | 63277.63 | 454 | 457 | 107.5 |
| C | 15 | 174 | 4142673 | 38539.43 | 454 | 457 | 107.5 |
| C | 15 | 158 | 1891267 | 17592.21 | 454 | 457 | 107.5 |
| D | 4 | 212 | 4146240 | 64029.25 | 216 | 206 | 64.8 |
| D | 4 | 216 | 2369536 | 36590.73 | 216 | 206 | 64.8 |
| D | 8 | 48 | 985434 | 15215.36 | 216 | 206 | 64.8 |
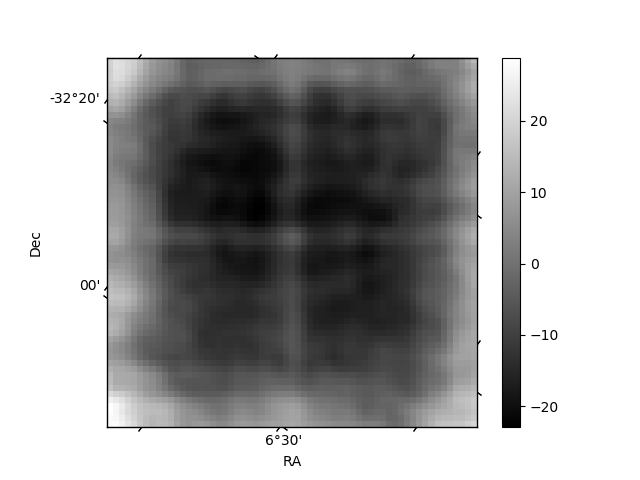
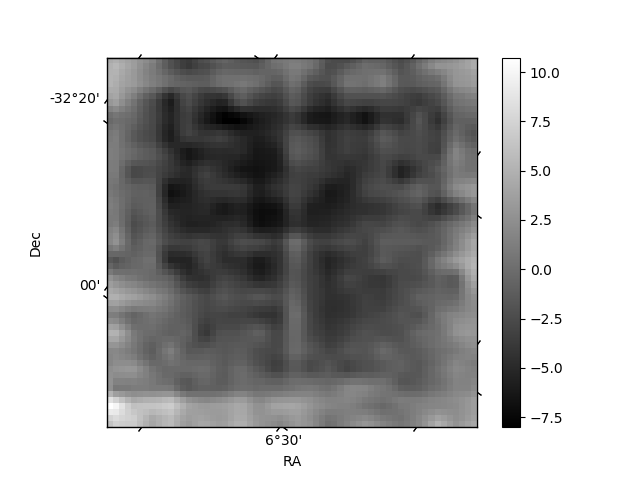
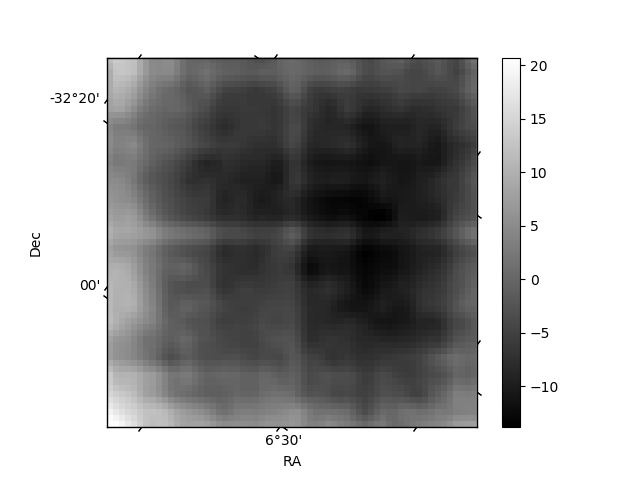
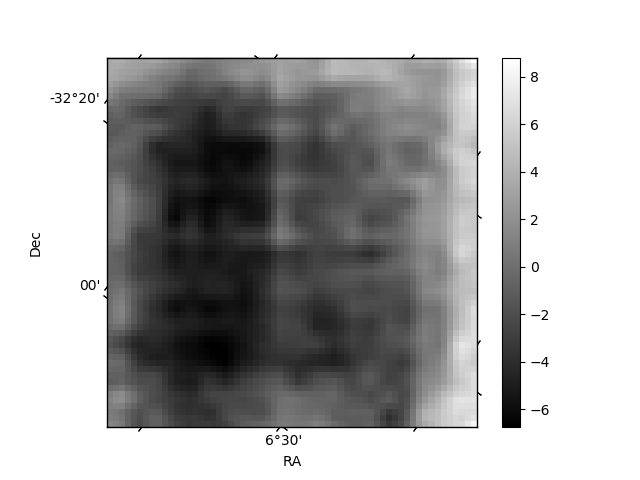
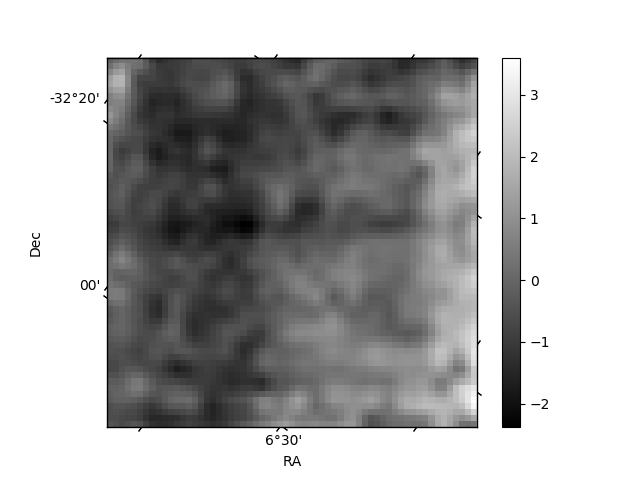
Histogram calculated using DETX and DETY for each event in the final _common_clean file
| Quadrant A | 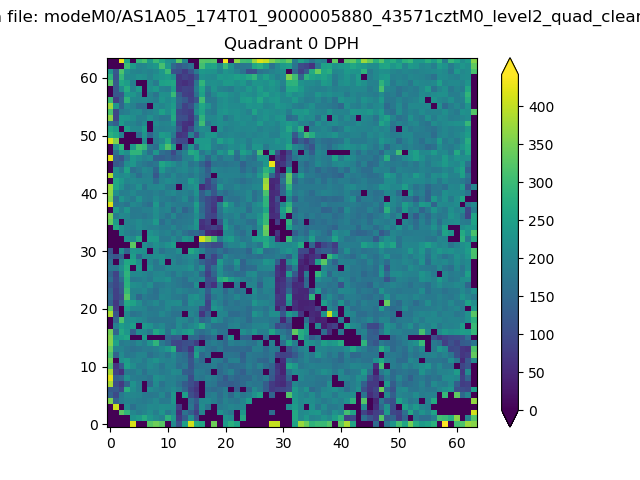 |
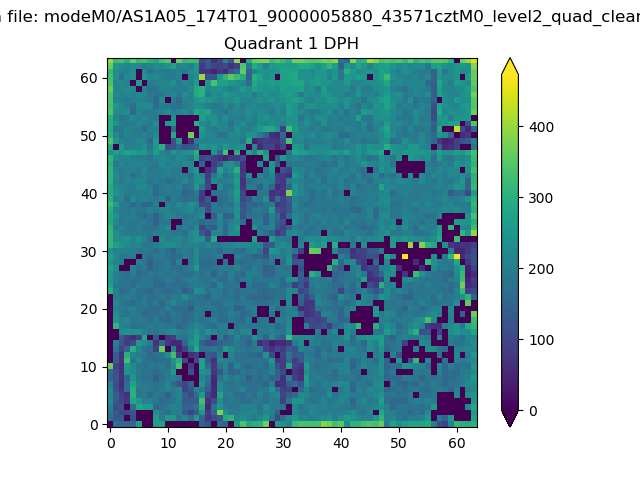 |
Quadrant B |
|---|---|---|---|
| Quadrant D | 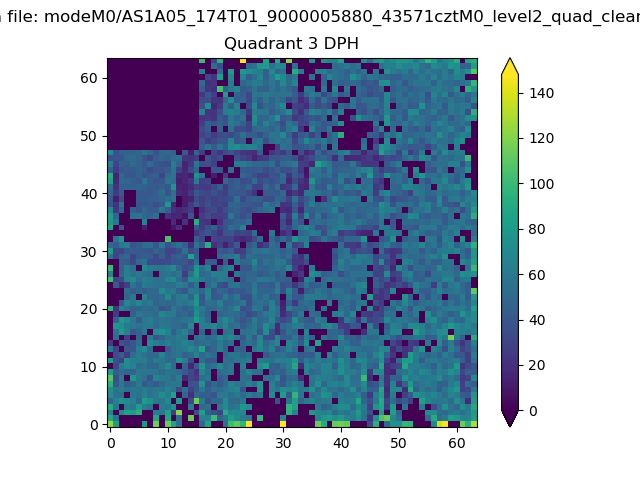 |
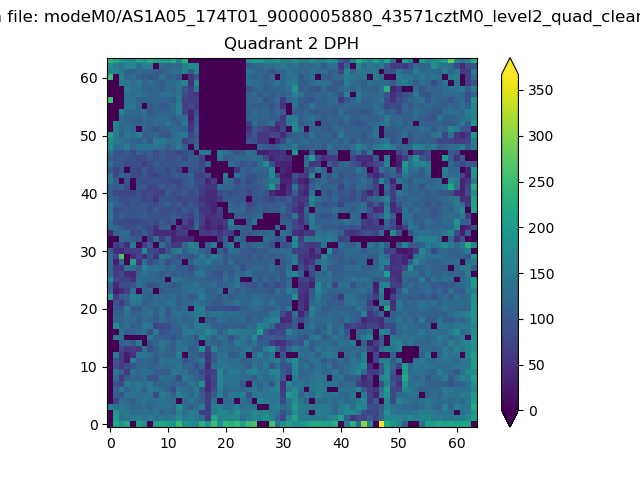 |
Quadrant C |
| Plot type | Count rate plots | Images |
|---|---|---|
| Comparison with Poisson distribution Blue bars denote a histogram of data divided into 1 sec bins. Red curve is a Poisson curve with rate = median count rate of data. |
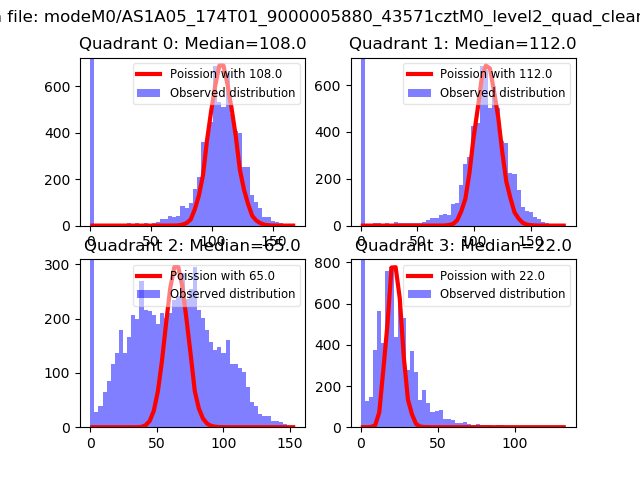 |
 |
| Quadrant-wise count rates Data is divided into 100 sec bins |
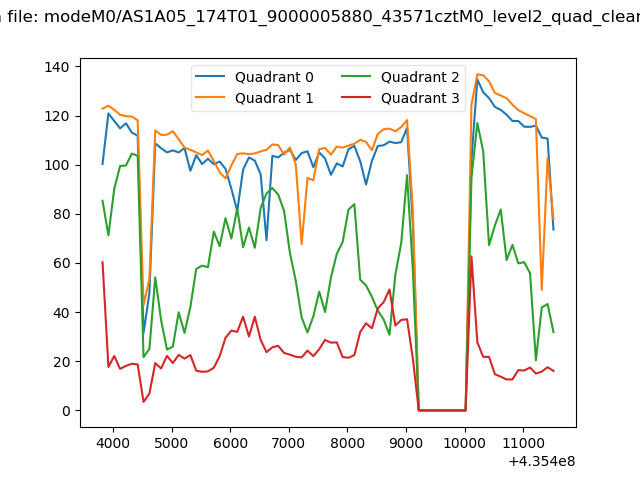 |
|
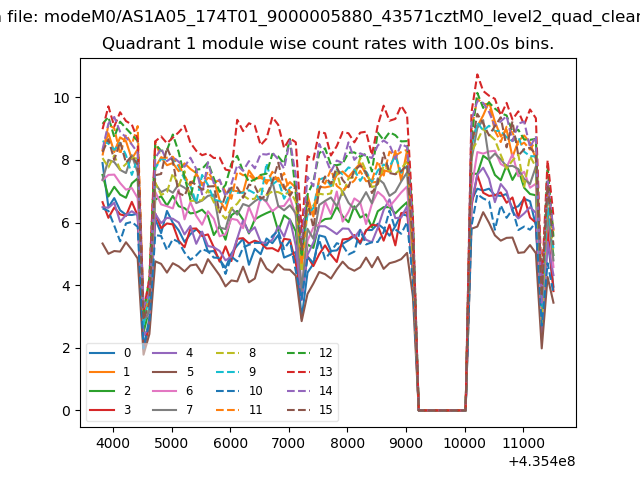
| Module-wise count rates for Quadrant A Data is divided into 100 sec bins |
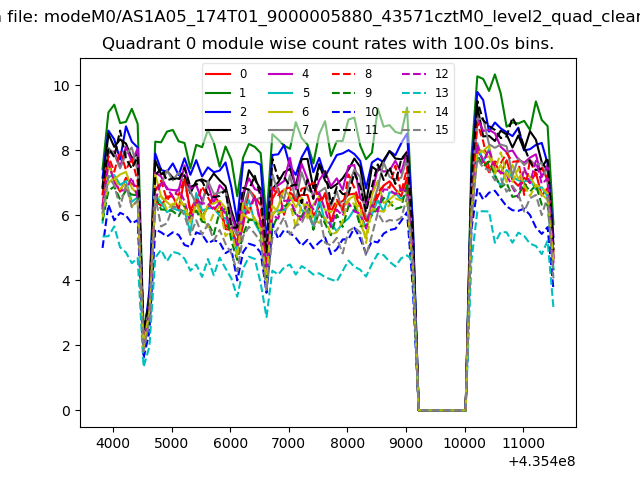 |
 |
| Module-wise count rates for Quadrant B Data is divided into 100 sec bins |
 |
 |
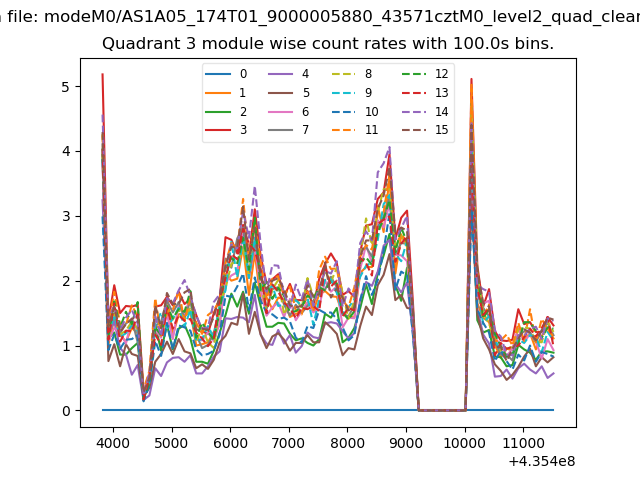
| Module-wise count rates for Quadrant C Data is divided into 100 sec bins |
 |
 |
| Module-wise count rates for Quadrant D Data is divided into 100 sec bins |
 |
 |
| Parameter | Plot |
|---|---|
| CZT HV Monitor | 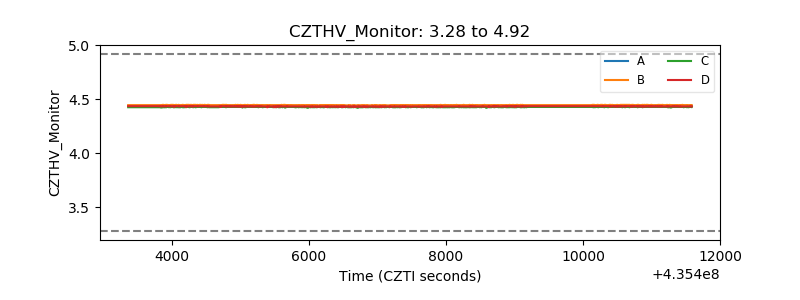 |
| D_VDD | 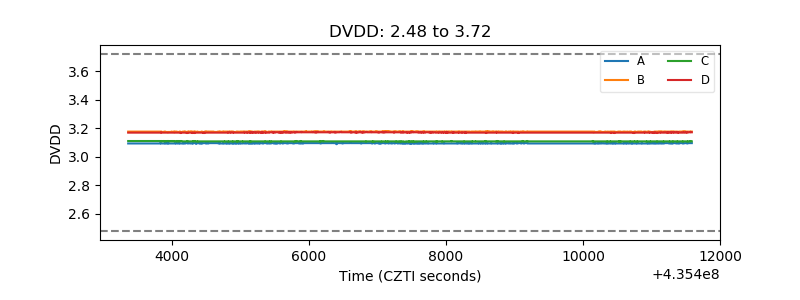 |
| Temperature 1 | 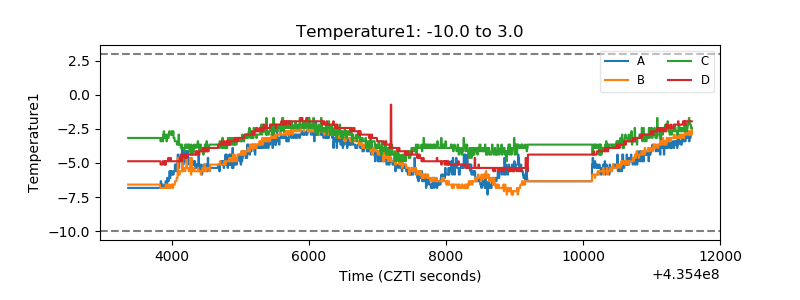 |
| Veto HV Monitor | 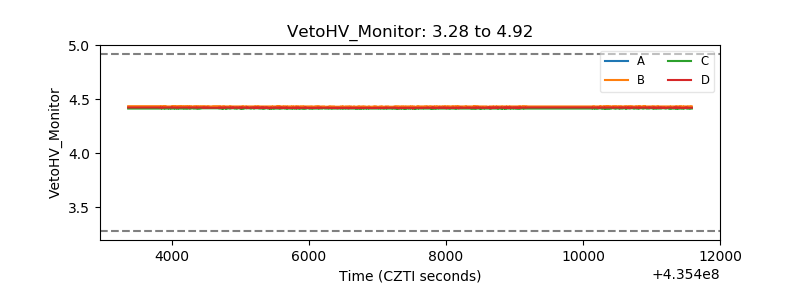 |
| Veto LLD | 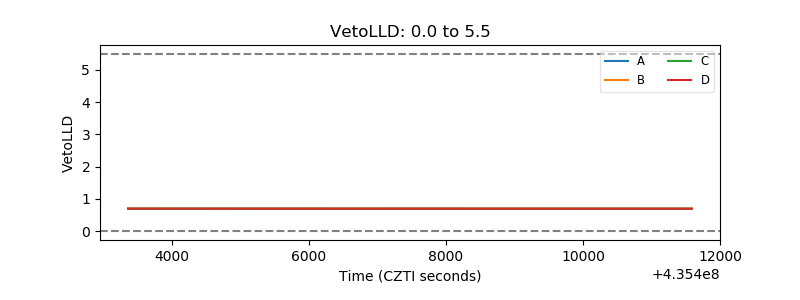 |
| Alpha Counter | 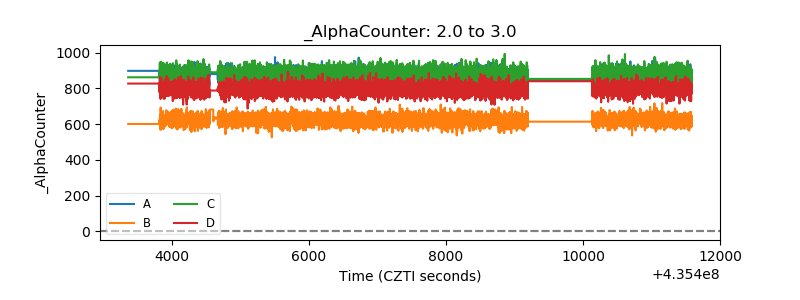 |
| _CPM_Rate | 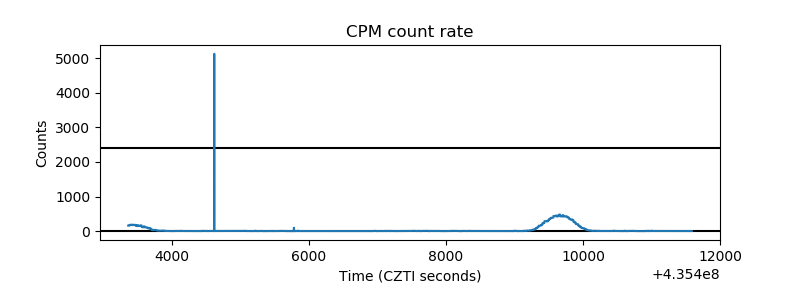 |
| CZT Counter | 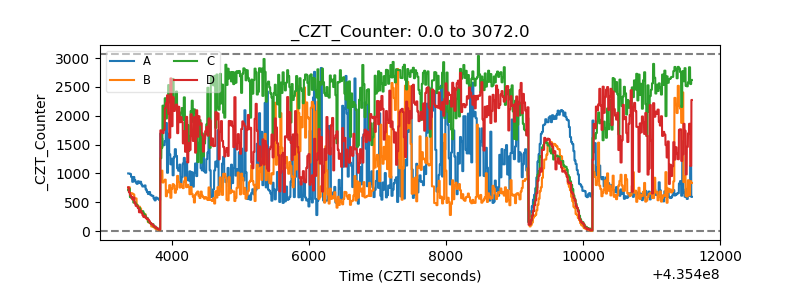 |
| +2.5 Volts monitor | 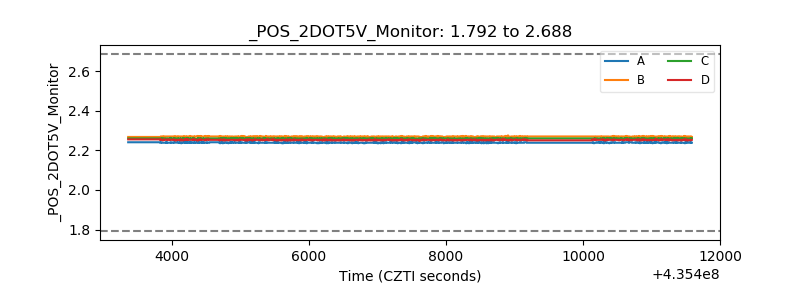 |
| +5 Volts monitor | 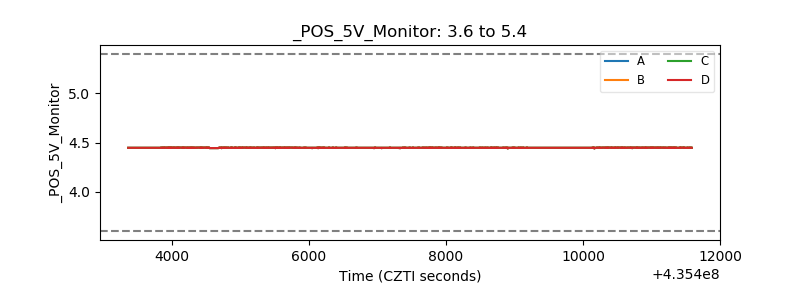 |
| _ROLL_ROT | 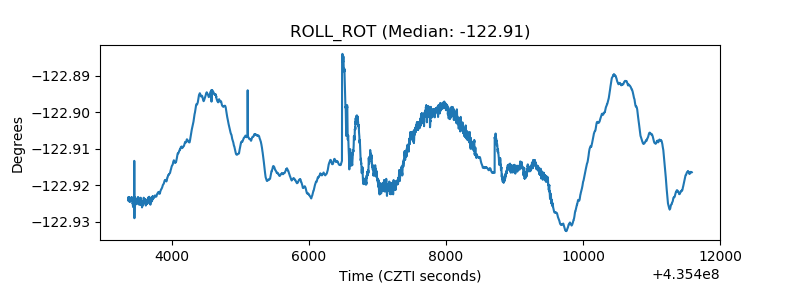 |
| _Roll_DEC | 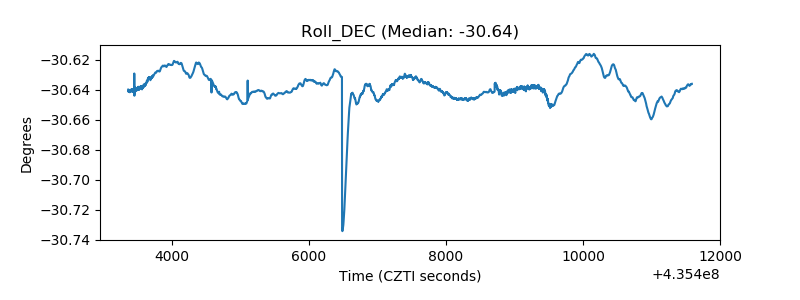 |
| _Roll_RA | 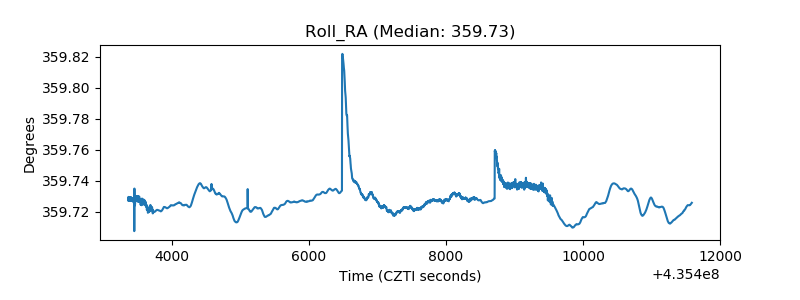 |
| Veto Counter | 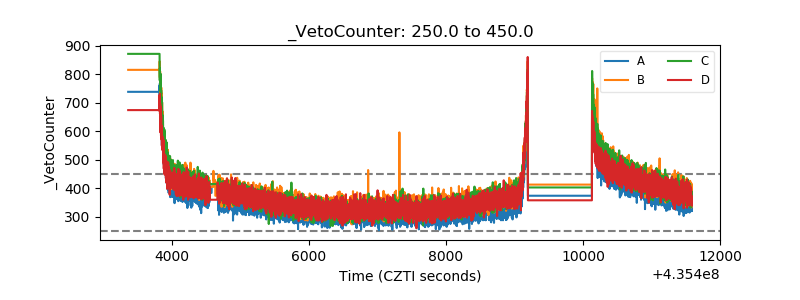 |