| Param | Original file | Final file |
|---|---|---|
| Filename | modeM0/AS1A05_174T01_9000005880_43573cztM0_level2.fits | modeM0/AS1A05_174T01_9000005880_43573cztM0_level2_quad_clean.evt |
| Size (bytes) | 1,137,651,840 | 57,818,880 |
| Size | 1.1 GB | 55.1 MB |
| Events in quadrant A | 8,514,067 | 554,395 |
| Events in quadrant B | 4,810,372 | 720,692 |
| Events in quadrant C | 16,153,767 | 29,539 |
| Events in quadrant D | 12,149,640 | 7,891 |
| Mode M9 | |||
|---|---|---|---|
| Quadrant | BADHDUFLAG | Total packets | Discarded packets |
| A | 0 | 11 | 0 |
| B | 0 | 11 | 0 |
| C | 0 | 11 | 0 |
| D | 0 | 11 | 0 |
| Mode M0 | |||
|---|---|---|---|
| Quadrant | BADHDUFLAG | Total packets | Discarded packets |
| A | 0 | 29844 | 1 |
| B | 0 | 18739 | 1 |
| C | 0 | 52176 | 1 |
| D | 0 | 40413 | 3 |
| Mode SS | |||
|---|---|---|---|
| Quadrant | BADHDUFLAG | Total packets | Discarded packets |
| A | 0 | 128 | 0 |
| B | 0 | 128 | 0 |
| C | 0 | 128 | 0 |
| D | 0 | 128 | 0 |
| Quadrant | Total seconds | Saturated seconds | Saturation percentage |
|---|---|---|---|
| A | 6273 | 1750 | 27.897338% |
| B | 6273 | 257 | 4.096923% |
| C | 6273 | 6107 | 97.353738% |
| D | 6273 | 6223 | 99.202933% |
Noise dominated data is calculated using 1-second bins in cleaned event files. If a bin has >2000 counts, and if more than 50% of those come from <1% of pixels, then it is considered to be noise-dominated and hence unusable.
| Quadrant | # 1 sec bins | Bins with >0 counts | Bins with >2000 counts | High rate bins dominated by noise | Noise dominated (total time) | Noise dominated (detector-on time) | Marked lightcurve |
|---|---|---|---|---|---|---|---|
| A | 7338 | 6273 | 1471 | 1471 | 20.05% | 23.45% | 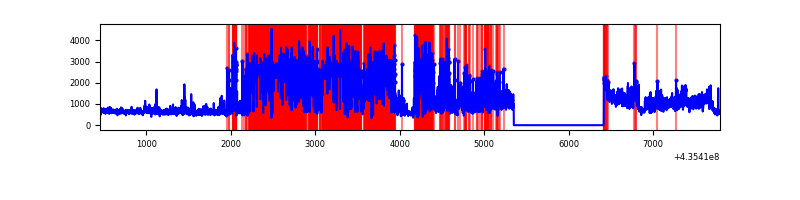 |
| B | 7338 | 6273 | 122 | 122 | 1.66% | 1.94% | 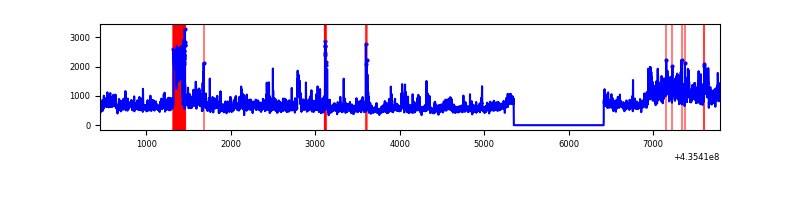 |
| C | 7337 | 6272 | 5916 | 5916 | 80.63% | 94.32% | 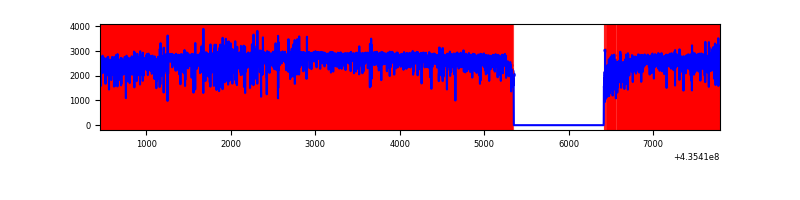 |
| D | 7337 | 6272 | 3103 | 3103 | 42.29% | 49.47% | 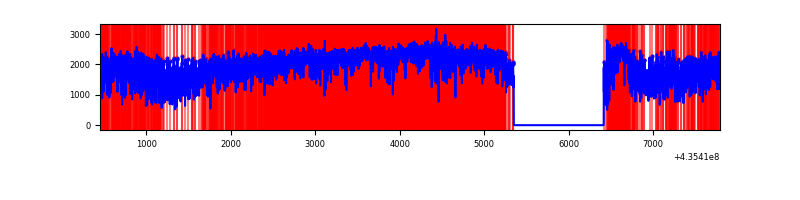 |
Top three noisy pixels from each quadrant. If the there are fewer than three noisy pixels in the level2.evt file, extra rows are filled as -1
| Pixel properties | Quadrant properties | ||||||
|---|---|---|---|---|---|---|---|
| Quadrant | DetID | PixID | Counts | Sigma | Mean | Median | Sigma |
| A | 14 | 63 | 3081738 | 22600.72 | 662 | 649 | 136.3 |
| A | 10 | 99 | 890631 | 6528.29 | 662 | 649 | 136.3 |
| A | 15 | 222 | 658569 | 4826.04 | 662 | 649 | 136.3 |
| B | 4 | 206 | 1433828 | 10151.43 | 720 | 699 | 141.2 |
| B | 0 | 200 | 299063 | 2113.43 | 720 | 699 | 141.2 |
| B | 3 | 25 | 60402 | 422.9 | 720 | 699 | 141.2 |
| C | 15 | 174 | 6886320 | 84932.98 | 336 | 338 | 81.1 |
| C | 15 | 142 | 5368291 | 66209.33 | 336 | 338 | 81.1 |
| C | 15 | 158 | 1781024 | 21963.31 | 336 | 338 | 81.1 |
| D | 4 | 212 | 4587451 | 80566.64 | 196 | 188 | 56.9 |
| D | 4 | 216 | 2497522 | 43860.97 | 196 | 188 | 56.9 |
| D | 8 | 48 | 599988 | 10534.36 | 196 | 188 | 56.9 |
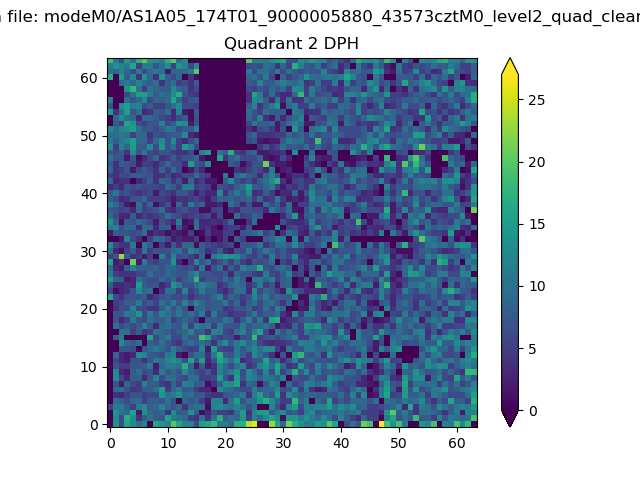
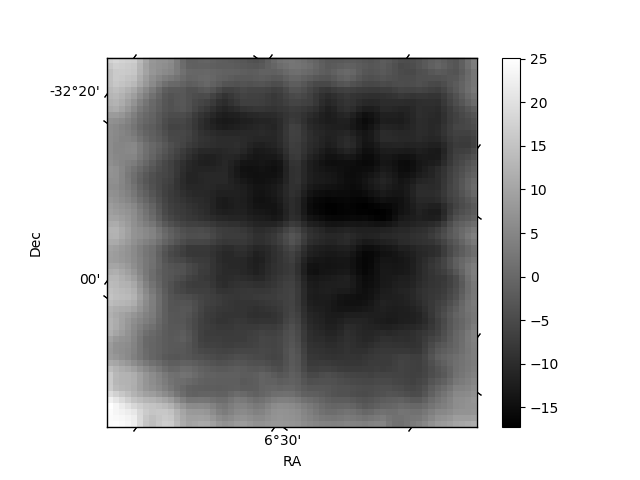
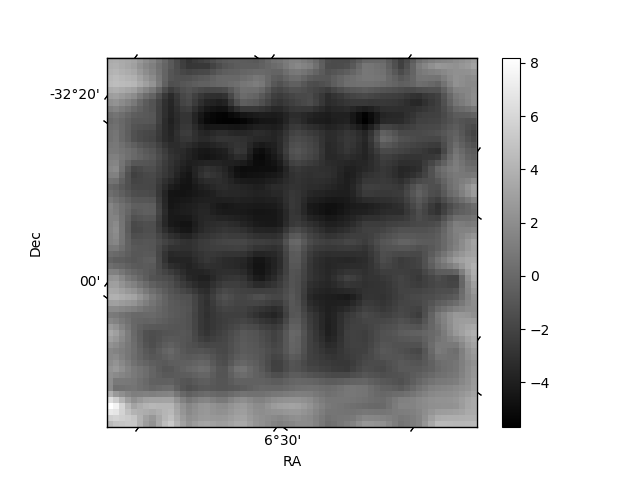
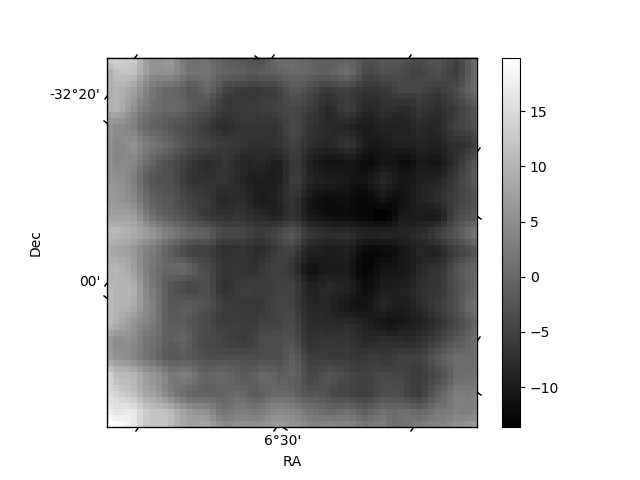
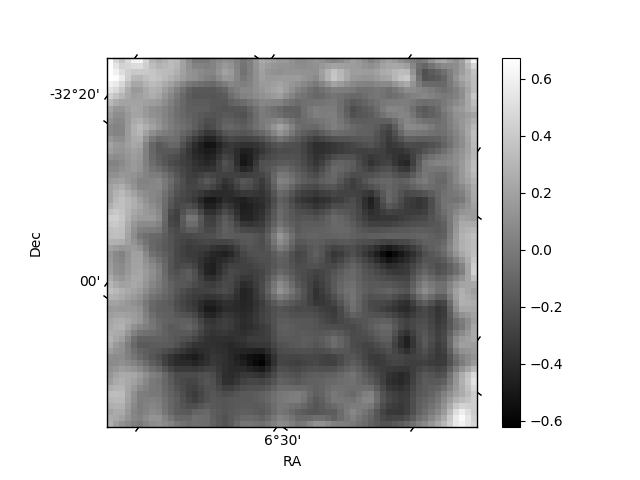
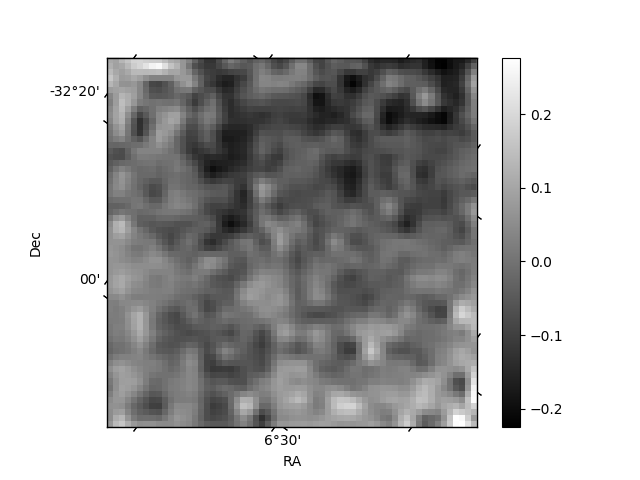
Histogram calculated using DETX and DETY for each event in the final _common_clean file
| Quadrant A | 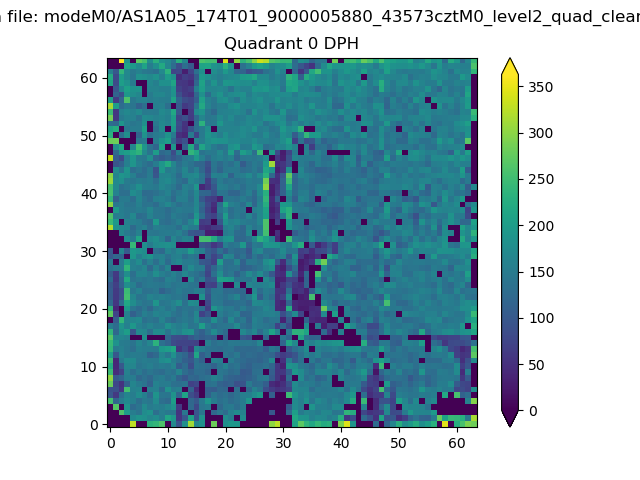 |
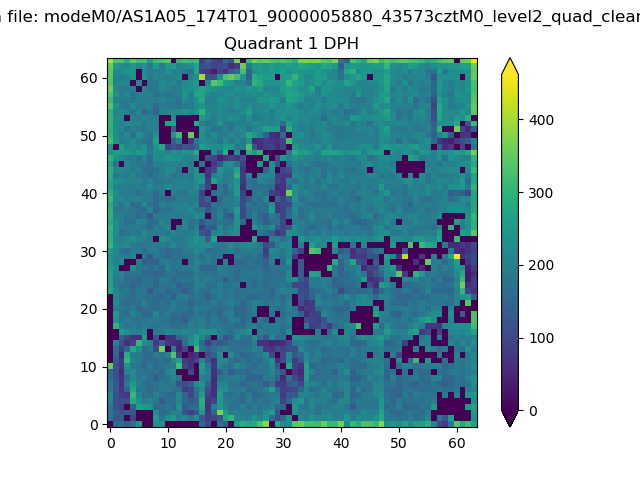 |
Quadrant B |
|---|---|---|---|
| Quadrant D | 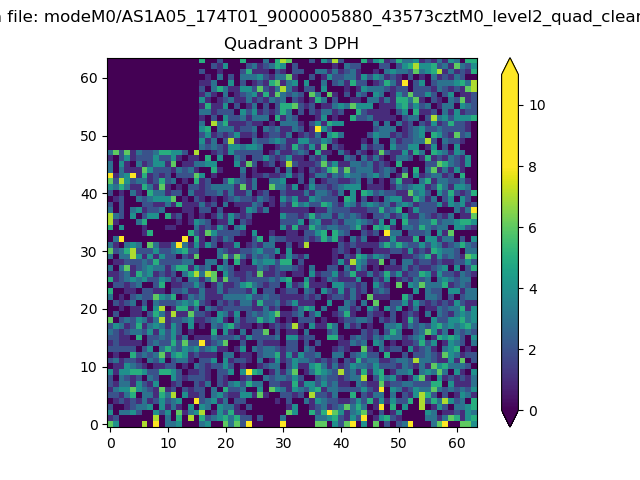 |
 |
Quadrant C |
| Plot type | Count rate plots | Images |
|---|---|---|
| Comparison with Poisson distribution Blue bars denote a histogram of data divided into 1 sec bins. Red curve is a Poisson curve with rate = median count rate of data. |
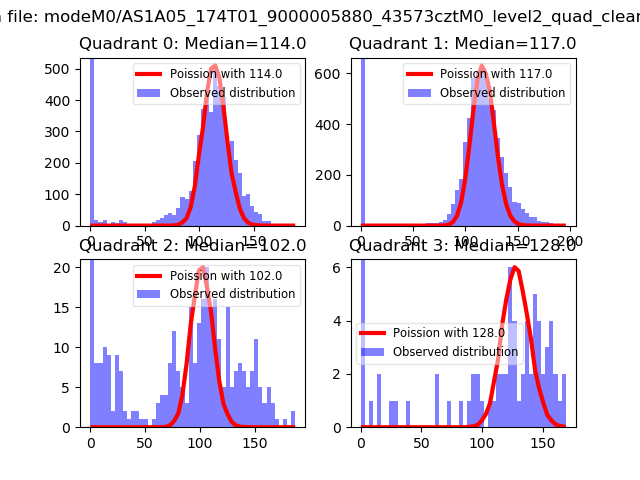 |
 |
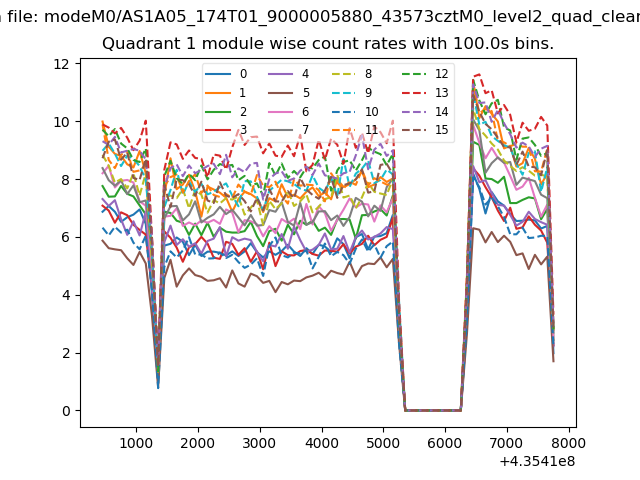
| Quadrant-wise count rates Data is divided into 100 sec bins |
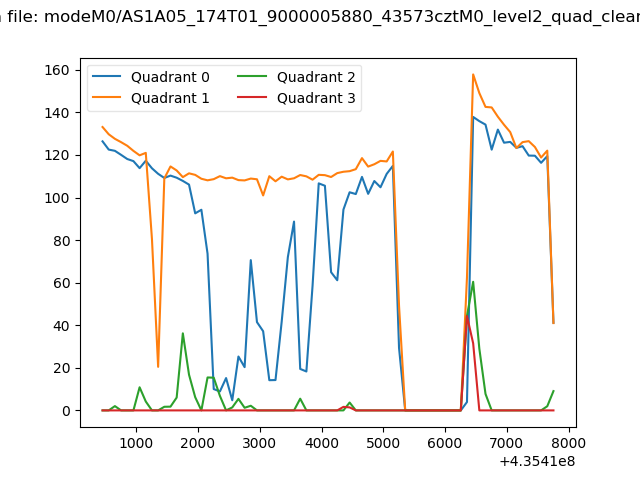 |
|
| Module-wise count rates for Quadrant A Data is divided into 100 sec bins |
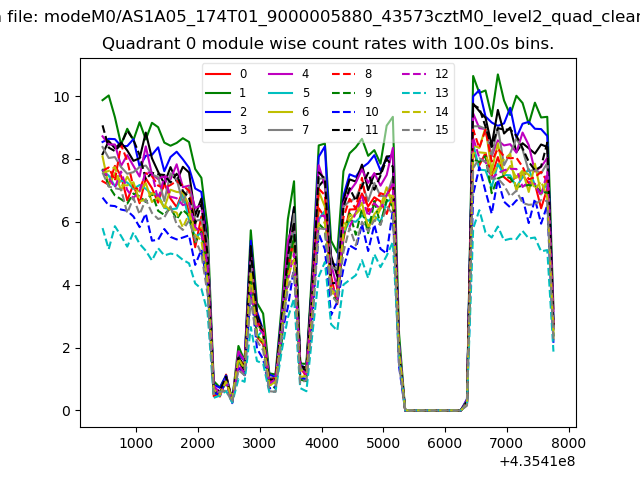 |
 |
| Module-wise count rates for Quadrant B Data is divided into 100 sec bins |
 |
 |
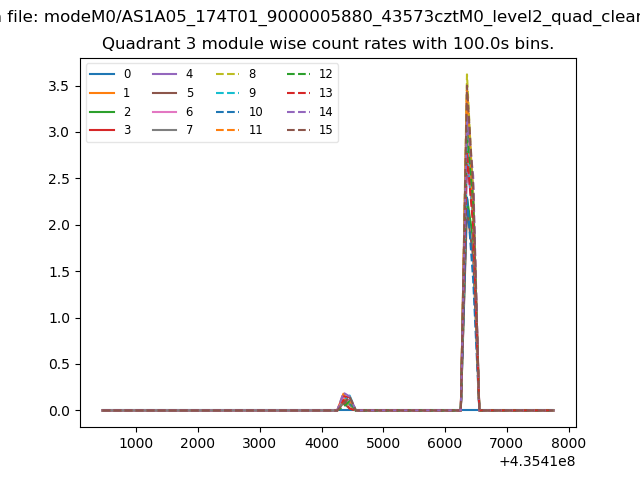
| Module-wise count rates for Quadrant C Data is divided into 100 sec bins |
 |
 |
| Module-wise count rates for Quadrant D Data is divided into 100 sec bins |
 |
 |
| Parameter | Plot |
|---|---|
| CZT HV Monitor | 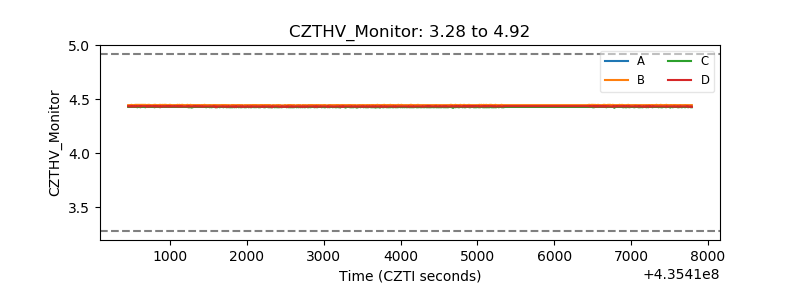 |
| D_VDD | 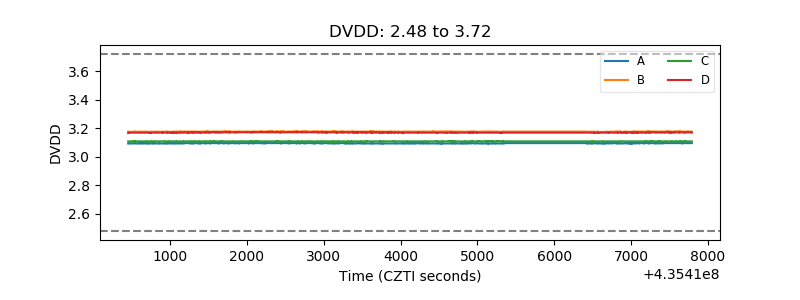 |
| Temperature 1 | 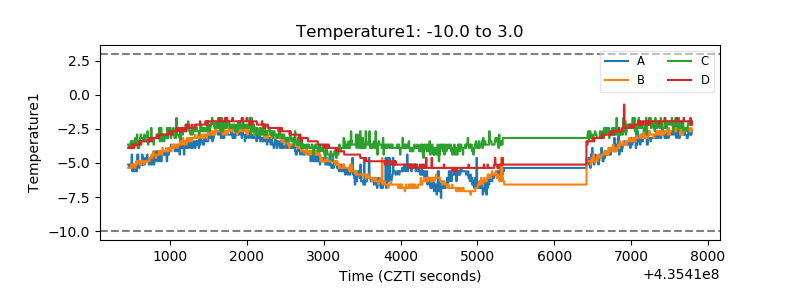 |
| Veto HV Monitor | 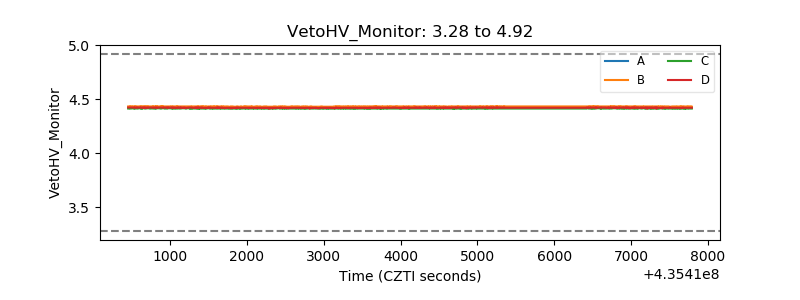 |
| Veto LLD | 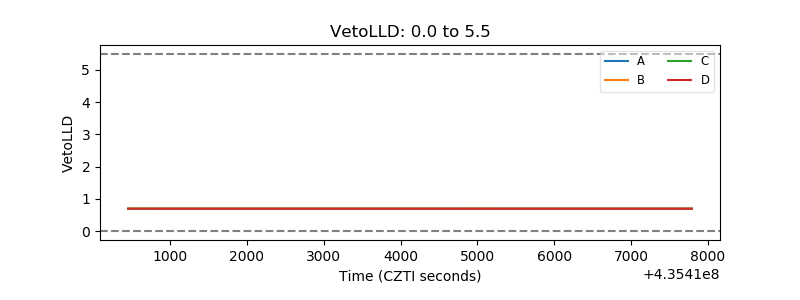 |
| Alpha Counter | 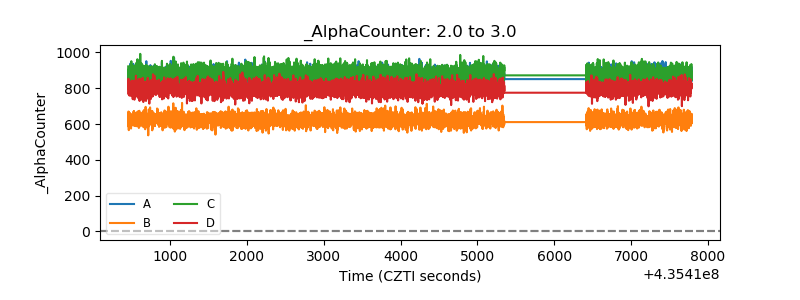 |
| _CPM_Rate | 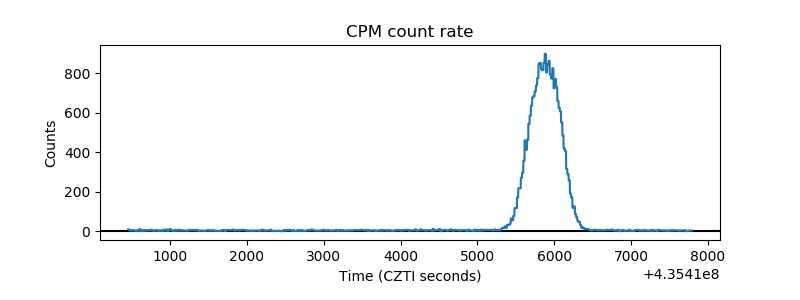 |
| CZT Counter | 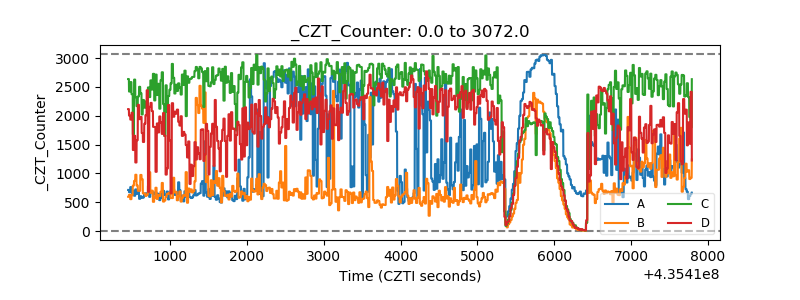 |
| +2.5 Volts monitor | 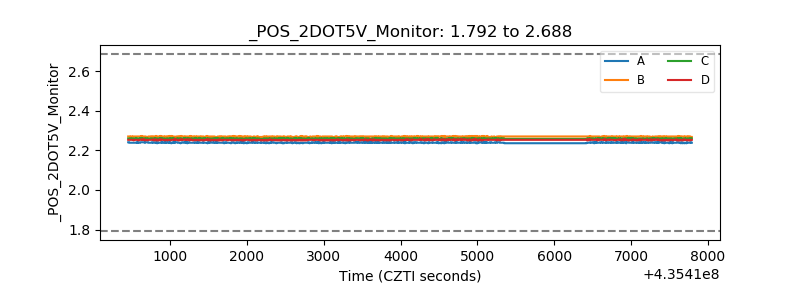 |
| +5 Volts monitor | 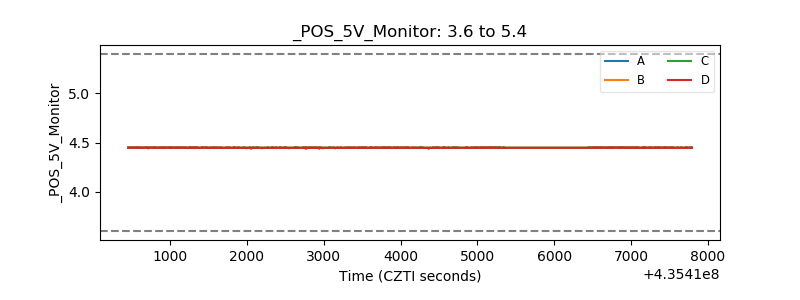 |
| _ROLL_ROT | 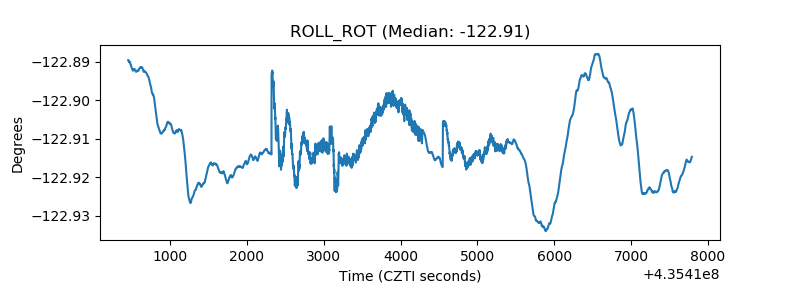 |
| _Roll_DEC | 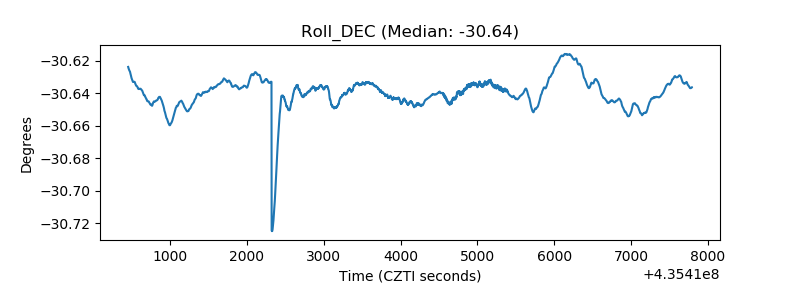 |
| _Roll_RA | 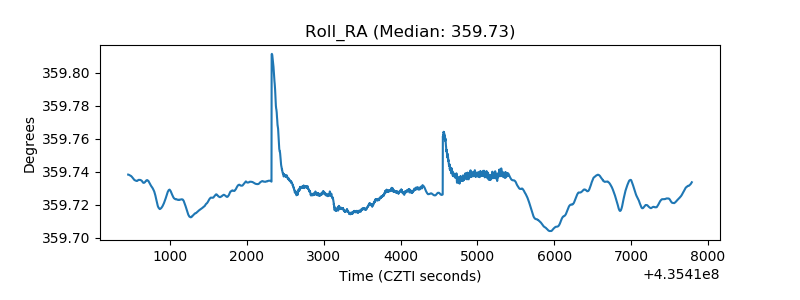 |
| Veto Counter | 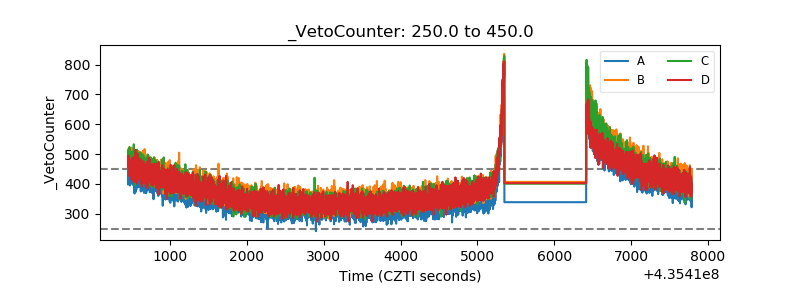 |