| Param | Original file | Final file |
|---|---|---|
| Filename | modeM0/AS1A05_174T01_9000005880_43574cztM0_level2.fits | modeM0/AS1A05_174T01_9000005880_43574cztM0_level2_quad_clean.evt |
| Size (bytes) | 1,057,631,040 | 75,741,120 |
| Size | 1008.6 MB | 72.2 MB |
| Events in quadrant A | 5,797,112 | 681,539 |
| Events in quadrant B | 6,614,239 | 693,316 |
| Events in quadrant C | 14,860,312 | 343,732 |
| Events in quadrant D | 11,429,274 | 162,861 |
| Mode M9 | |||
|---|---|---|---|
| Quadrant | BADHDUFLAG | Total packets | Discarded packets |
| A | 0 | 12 | 0 |
| B | 0 | 12 | 0 |
| C | 0 | 12 | 0 |
| D | 0 | 12 | 0 |
| Mode M0 | |||
|---|---|---|---|
| Quadrant | BADHDUFLAG | Total packets | Discarded packets |
| A | 0 | 21529 | 1 |
| B | 0 | 23873 | 1 |
| C | 0 | 48029 | 1 |
| D | 0 | 37985 | 1 |
| Mode SS | |||
|---|---|---|---|
| Quadrant | BADHDUFLAG | Total packets | Discarded packets |
| A | 0 | 116 | 0 |
| B | 0 | 116 | 0 |
| C | 0 | 116 | 0 |
| D | 0 | 116 | 0 |
| Quadrant | Total seconds | Saturated seconds | Saturation percentage |
|---|---|---|---|
| A | 5817 | 341 | 5.862128% |
| B | 5817 | 678 | 11.655493% |
| C | 5817 | 5520 | 94.894275% |
| D | 5818 | 5795 | 99.604675% |
Noise dominated data is calculated using 1-second bins in cleaned event files. If a bin has >2000 counts, and if more than 50% of those come from <1% of pixels, then it is considered to be noise-dominated and hence unusable.
| Quadrant | # 1 sec bins | Bins with >0 counts | Bins with >2000 counts | High rate bins dominated by noise | Noise dominated (total time) | Noise dominated (detector-on time) | Marked lightcurve |
|---|---|---|---|---|---|---|---|
| A | 6972 | 5817 | 233 | 233 | 3.34% | 4.01% |  |
| B | 6972 | 5817 | 558 | 558 | 8.00% | 9.59% | 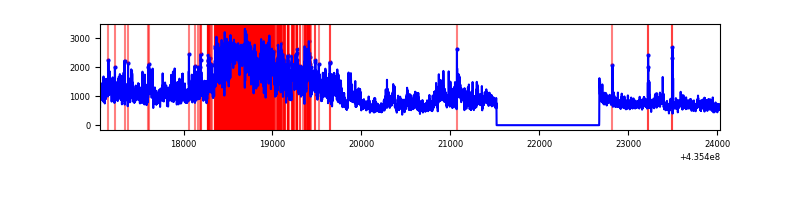 |
| C | 6971 | 5816 | 5335 | 5335 | 76.53% | 91.73% | 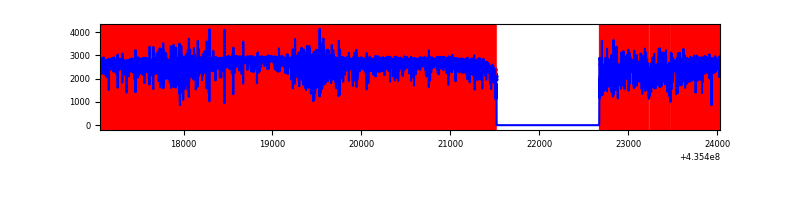 |
| D | 6972 | 5817 | 3028 | 3028 | 43.43% | 52.05% | 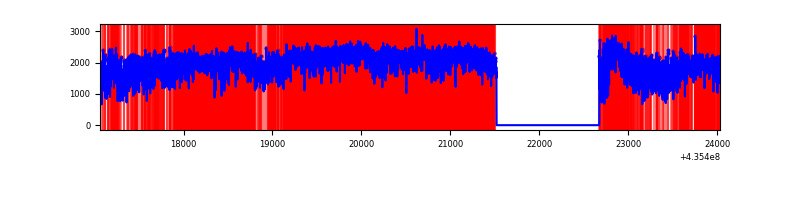 |
Top three noisy pixels from each quadrant. If the there are fewer than three noisy pixels in the level2.evt file, extra rows are filled as -1
| Pixel properties | Quadrant properties | ||||||
|---|---|---|---|---|---|---|---|
| Quadrant | DetID | PixID | Counts | Sigma | Mean | Median | Sigma |
| A | 15 | 222 | 982855 | 7009.29 | 677 | 666 | 140.1 |
| A | 10 | 99 | 688575 | 4909.19 | 677 | 666 | 140.1 |
| A | 10 | 83 | 650223 | 4635.49 | 677 | 666 | 140.1 |
| B | 4 | 206 | 3641155 | 28004.41 | 666 | 648 | 130.0 |
| B | 0 | 230 | 135296 | 1035.77 | 666 | 648 | 130.0 |
| B | 0 | 200 | 64210 | 488.95 | 666 | 648 | 130.0 |
| C | 15 | 174 | 6251898 | 78055.88 | 340 | 342 | 80.1 |
| C | 15 | 142 | 5548952 | 69279.01 | 340 | 342 | 80.1 |
| C | 15 | 126 | 690958 | 8622.92 | 340 | 342 | 80.1 |
| D | 4 | 212 | 5614417 | 94804.85 | 195 | 187 | 59.2 |
| D | 4 | 216 | 1765821 | 29815.43 | 195 | 187 | 59.2 |
| D | 14 | 210 | 357071 | 6026.53 | 195 | 187 | 59.2 |
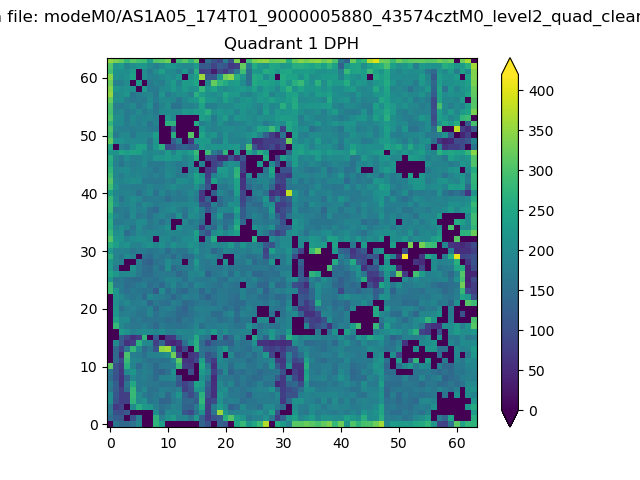
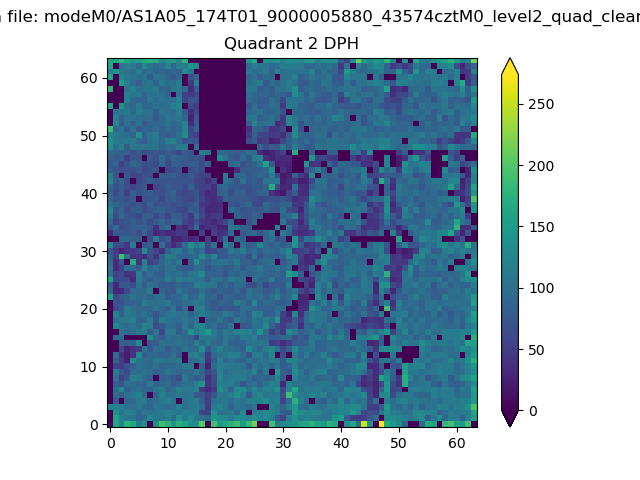
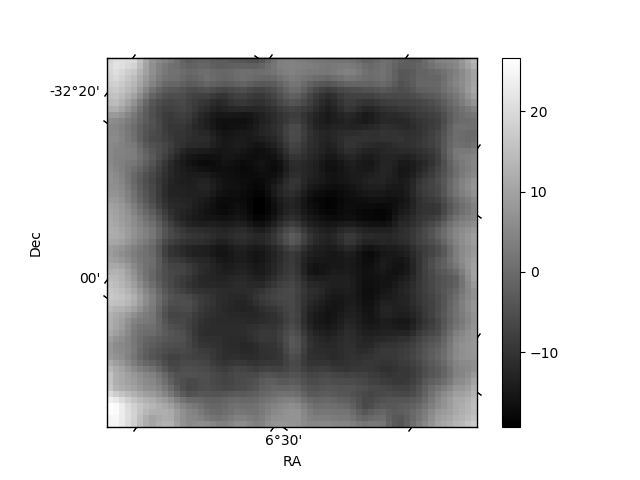
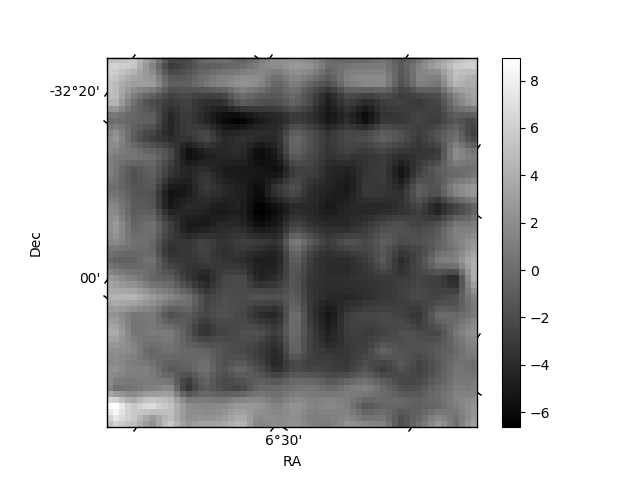
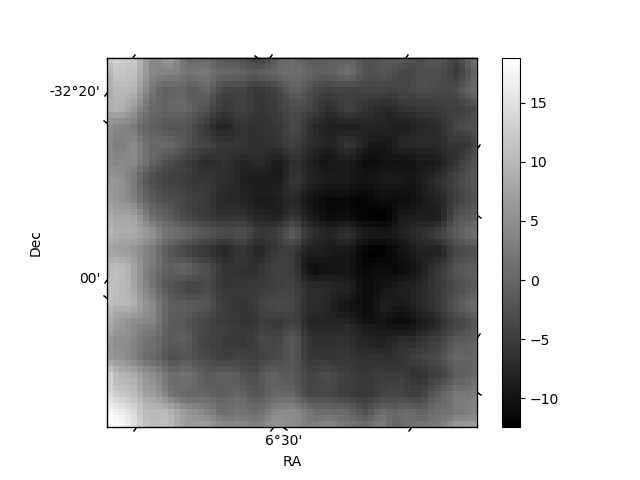
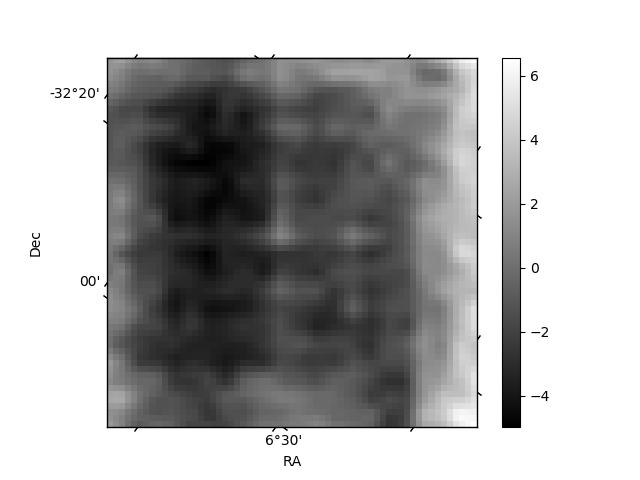
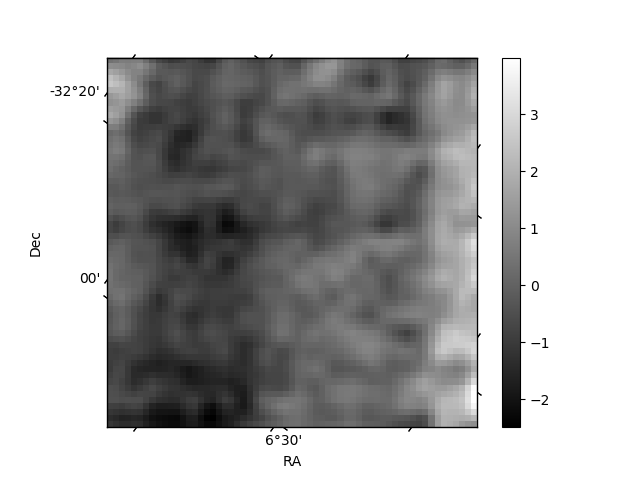
Histogram calculated using DETX and DETY for each event in the final _common_clean file
| Quadrant A | 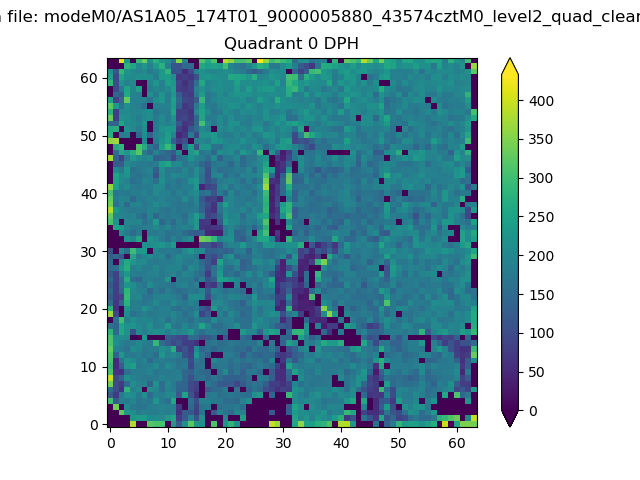 |
 |
Quadrant B |
|---|---|---|---|
| Quadrant D | 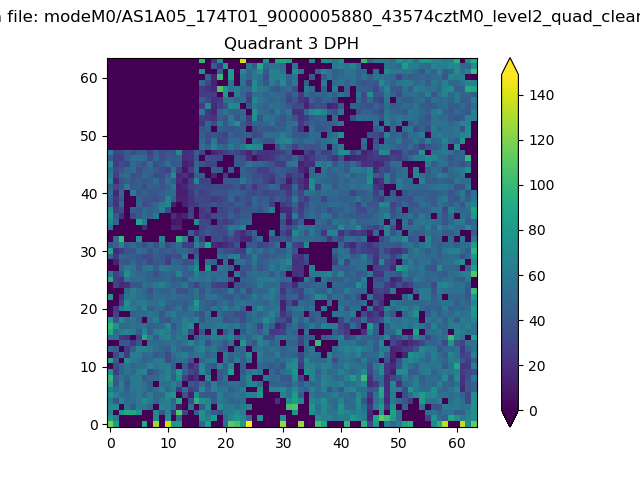 |
 |
Quadrant C |
| Plot type | Count rate plots | Images |
|---|---|---|
| Comparison with Poisson distribution Blue bars denote a histogram of data divided into 1 sec bins. Red curve is a Poisson curve with rate = median count rate of data. |
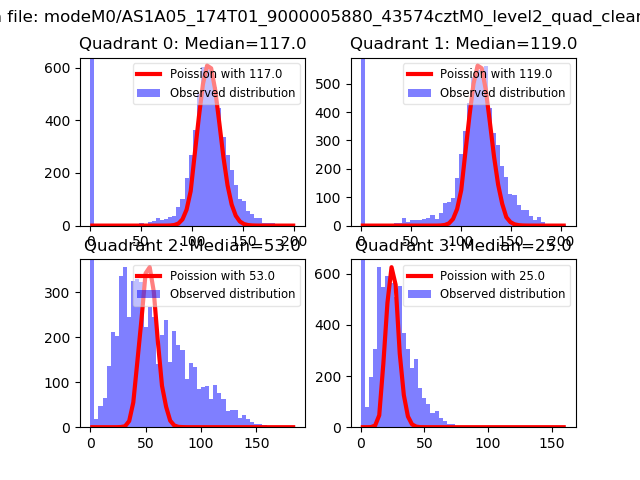 |
 |
| Quadrant-wise count rates Data is divided into 100 sec bins |
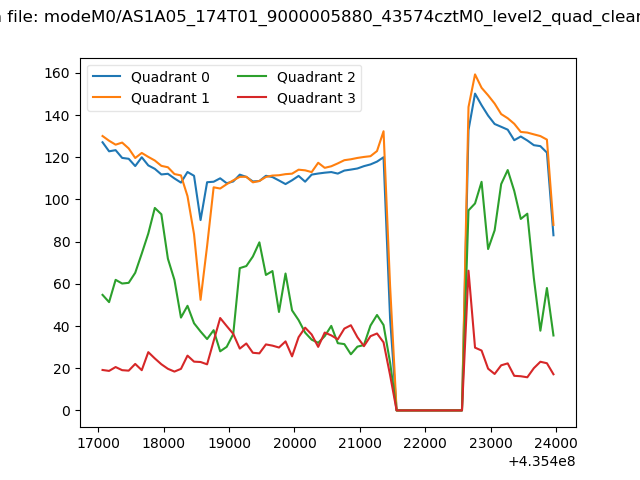 |
|
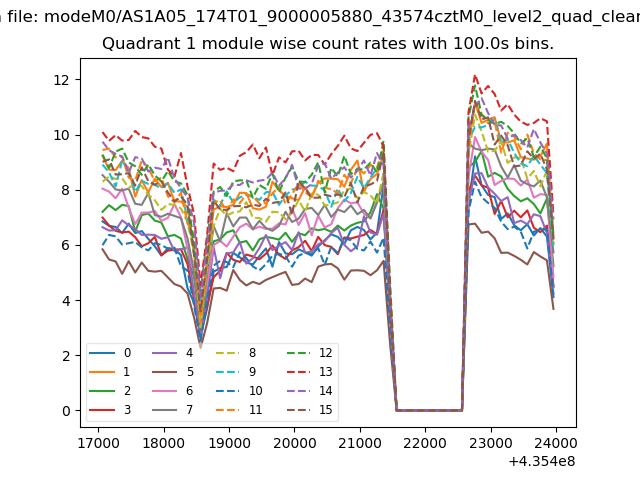
| Module-wise count rates for Quadrant A Data is divided into 100 sec bins |
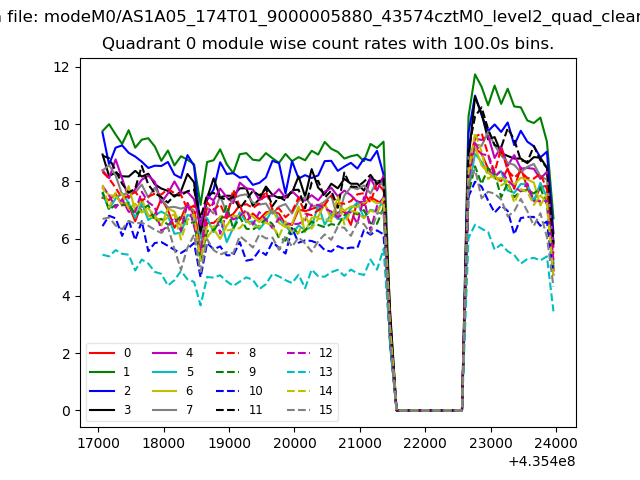 |
 |
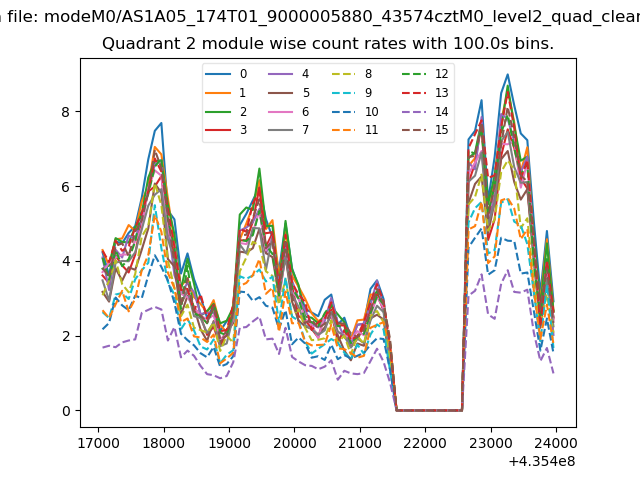
| Module-wise count rates for Quadrant B Data is divided into 100 sec bins |
 |
 |
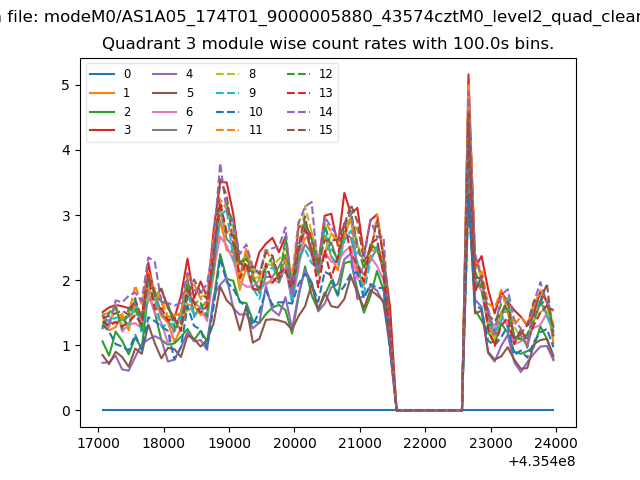
| Module-wise count rates for Quadrant C Data is divided into 100 sec bins |
 |
 |
| Module-wise count rates for Quadrant D Data is divided into 100 sec bins |
 |
 |
| Parameter | Plot |
|---|---|
| CZT HV Monitor | 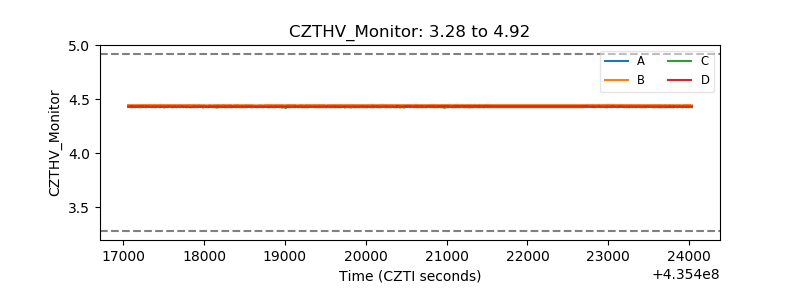 |
| D_VDD | 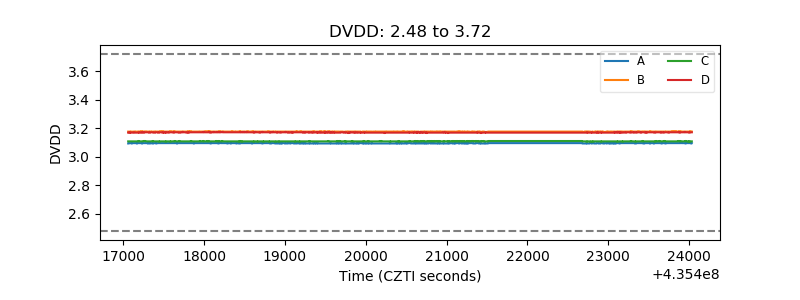 |
| Temperature 1 | 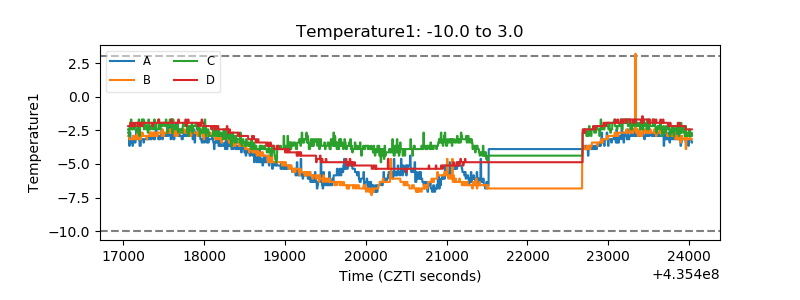 |
| Veto HV Monitor | 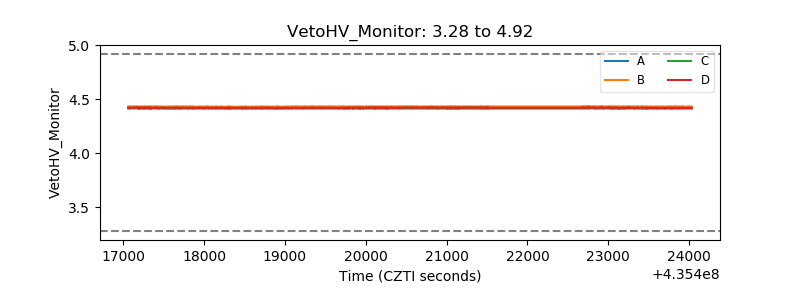 |
| Veto LLD | 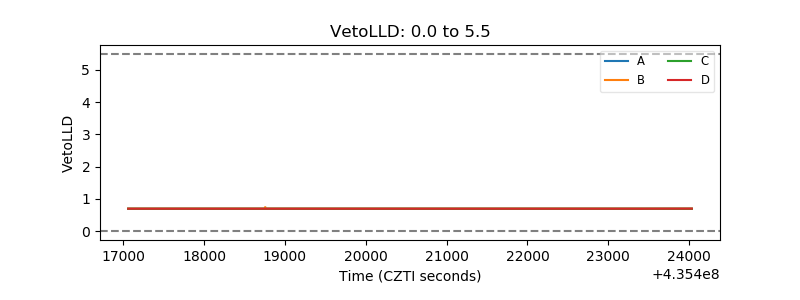 |
| Alpha Counter | 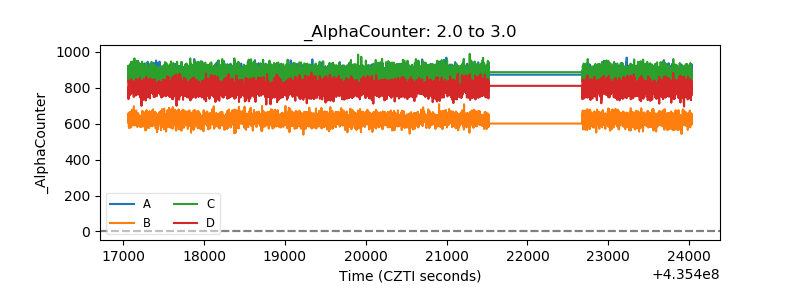 |
| _CPM_Rate | 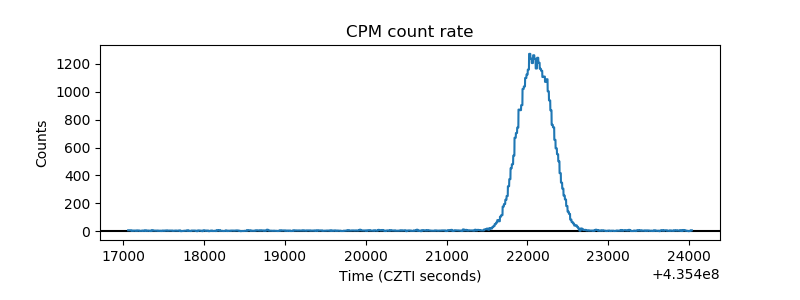 |
| CZT Counter | 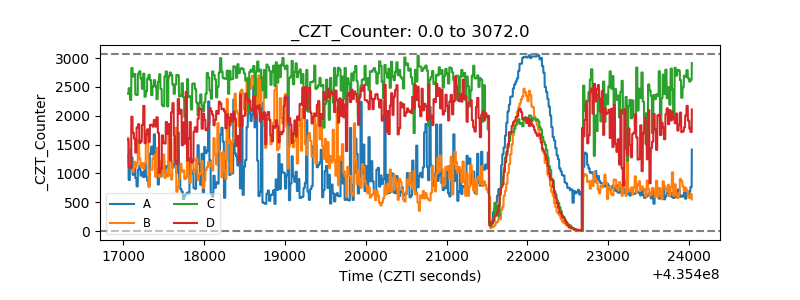 |
| +2.5 Volts monitor | 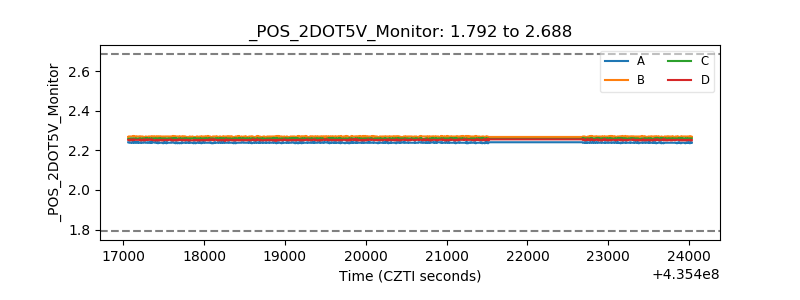 |
| +5 Volts monitor | 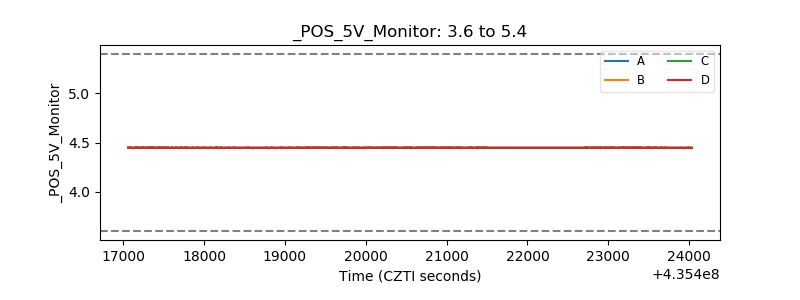 |
| _ROLL_ROT | 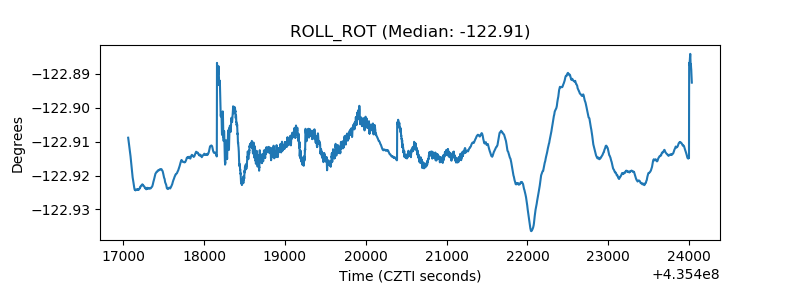 |
| _Roll_DEC | 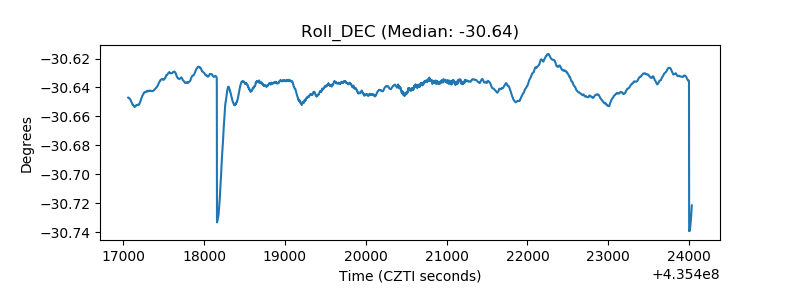 |
| _Roll_RA | 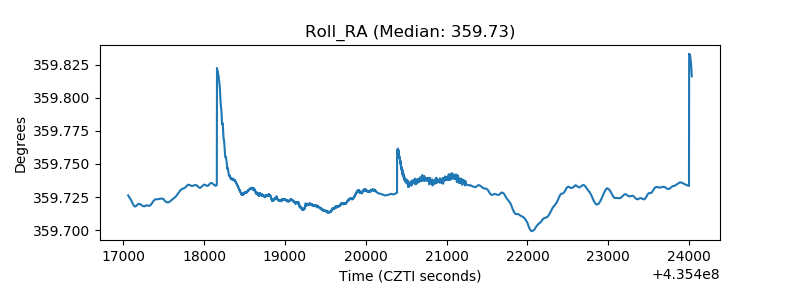 |
| Veto Counter | 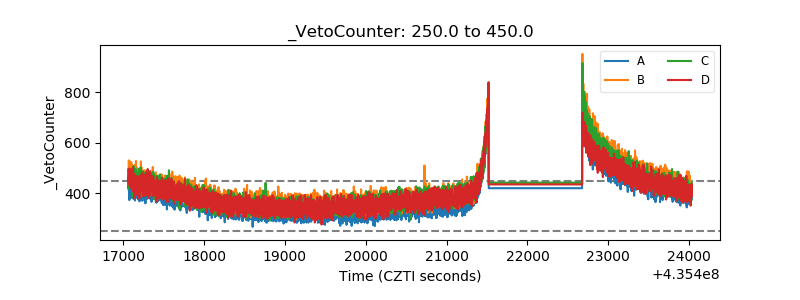 |