| Param | Original file | Final file |
|---|---|---|
| Filename | modeM0/AS1A05_174T01_9000005880_43575cztM0_level2.fits | modeM0/AS1A05_174T01_9000005880_43575cztM0_level2_quad_clean.evt |
| Size (bytes) | 1,104,120,000 | 89,628,480 |
| Size | 1.0 GB | 85.5 MB |
| Events in quadrant A | 5,542,188 | 812,330 |
| Events in quadrant B | 4,238,517 | 848,026 |
| Events in quadrant C | 16,804,506 | 430,555 |
| Events in quadrant D | 13,766,381 | 149,169 |
| Mode M9 | |||
|---|---|---|---|
| Quadrant | BADHDUFLAG | Total packets | Discarded packets |
| A | 0 | 12 | 0 |
| B | 0 | 12 | 0 |
| C | 0 | 12 | 0 |
| D | 0 | 12 | 0 |
| Mode M0 | |||
|---|---|---|---|
| Quadrant | BADHDUFLAG | Total packets | Discarded packets |
| A | 0 | 21376 | 2 |
| B | 0 | 17166 | 2 |
| C | 0 | 54419 | 2 |
| D | 0 | 45479 | 2 |
| Mode SS | |||
|---|---|---|---|
| Quadrant | BADHDUFLAG | Total packets | Discarded packets |
| A | 0 | 136 | 0 |
| B | 0 | 136 | 0 |
| C | 0 | 136 | 0 |
| D | 0 | 136 | 0 |
| Quadrant | Total seconds | Saturated seconds | Saturation percentage |
|---|---|---|---|
| A | 6711 | 336 | 5.006705% |
| B | 6711 | 131 | 1.952019% |
| C | 6711 | 6061 | 90.314409% |
| D | 6712 | 6711 | 99.985101% |
Noise dominated data is calculated using 1-second bins in cleaned event files. If a bin has >2000 counts, and if more than 50% of those come from <1% of pixels, then it is considered to be noise-dominated and hence unusable.
| Quadrant | # 1 sec bins | Bins with >0 counts | Bins with >2000 counts | High rate bins dominated by noise | Noise dominated (total time) | Noise dominated (detector-on time) | Marked lightcurve |
|---|---|---|---|---|---|---|---|
| A | 7906 | 6711 | 141 | 141 | 1.78% | 2.10% | 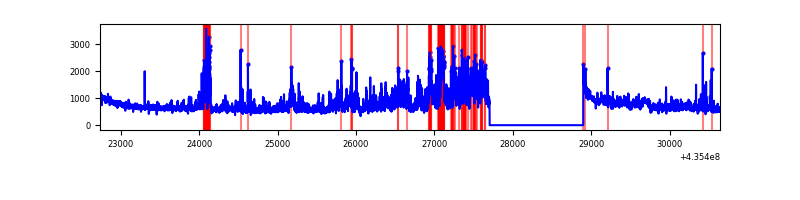 |
| B | 7906 | 6711 | 23 | 23 | 0.29% | 0.34% | 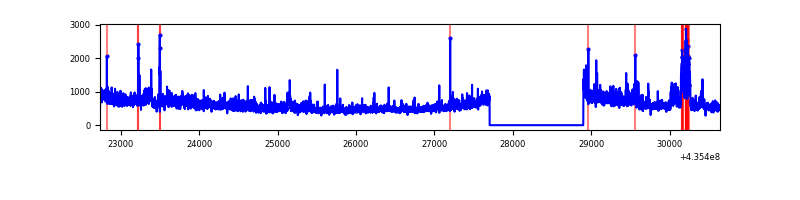 |
| C | 7905 | 6710 | 5894 | 5894 | 74.56% | 87.84% | 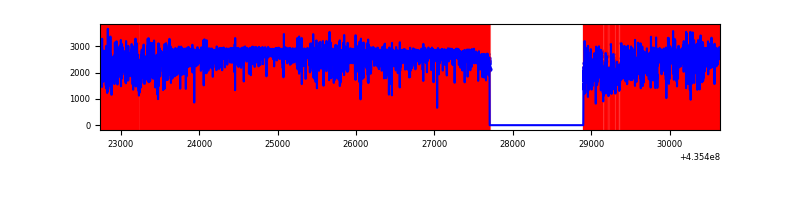 |
| D | 7906 | 6711 | 3959 | 3959 | 50.08% | 58.99% | 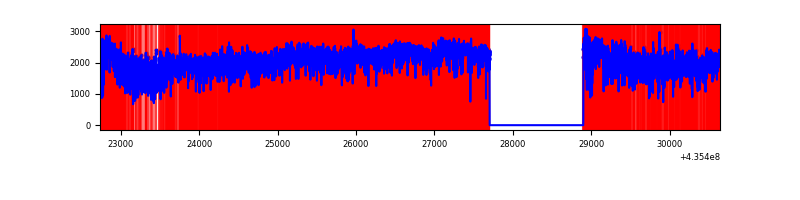 |
Top three noisy pixels from each quadrant. If the there are fewer than three noisy pixels in the level2.evt file, extra rows are filled as -1
| Pixel properties | Quadrant properties | ||||||
|---|---|---|---|---|---|---|---|
| Quadrant | DetID | PixID | Counts | Sigma | Mean | Median | Sigma |
| A | 10 | 83 | 803655 | 4905.31 | 800 | 789 | 163.7 |
| A | 10 | 99 | 756282 | 4615.87 | 800 | 789 | 163.7 |
| A | 15 | 222 | 310128 | 1889.98 | 800 | 789 | 163.7 |
| B | 4 | 206 | 783468 | 5000.3 | 807 | 784 | 156.5 |
| B | 0 | 230 | 103619 | 656.97 | 807 | 784 | 156.5 |
| B | 0 | 200 | 72549 | 458.48 | 807 | 784 | 156.5 |
| C | 15 | 174 | 7740599 | 76900.99 | 427 | 430 | 100.7 |
| C | 15 | 142 | 5305250 | 52705.04 | 427 | 430 | 100.7 |
| C | 15 | 126 | 977173 | 9704.25 | 427 | 430 | 100.7 |
| D | 4 | 212 | 5503623 | 101655.68 | 177 | 170 | 54.1 |
| D | 13 | 187 | 2195634 | 40552.97 | 177 | 170 | 54.1 |
| D | 4 | 216 | 1556411 | 28745.72 | 177 | 170 | 54.1 |
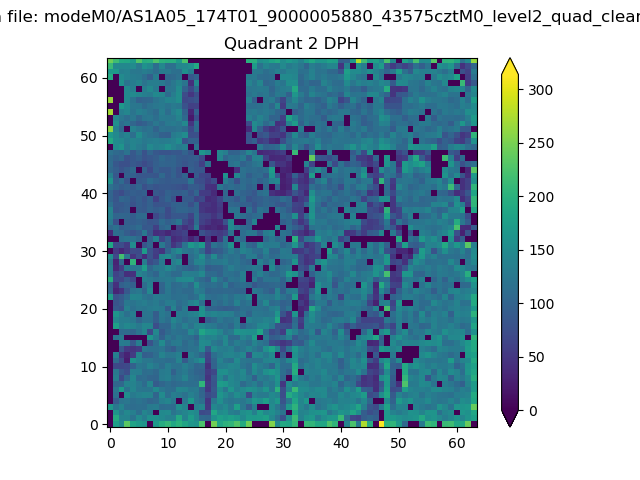
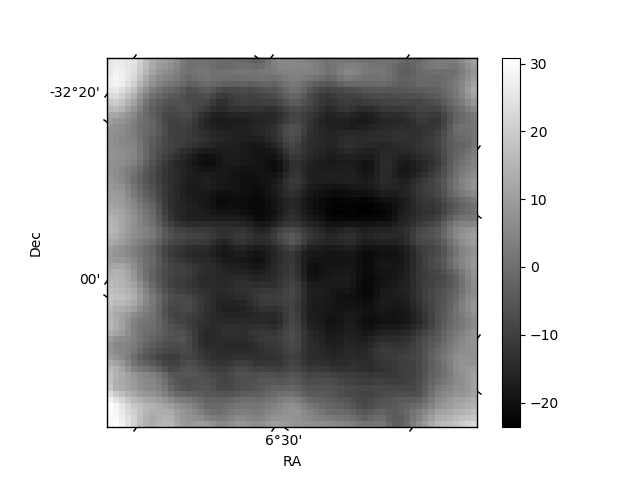
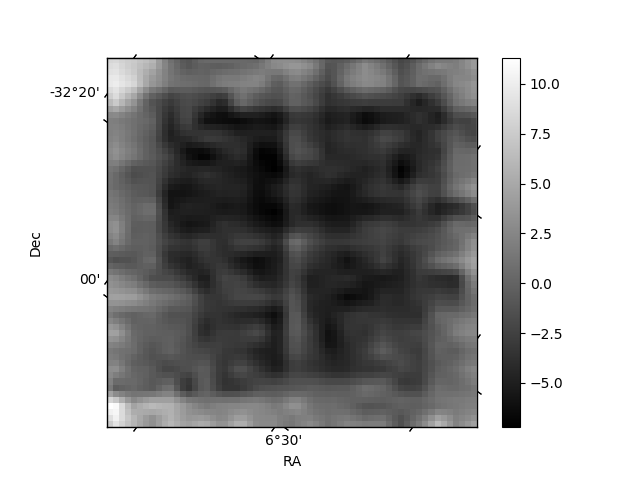
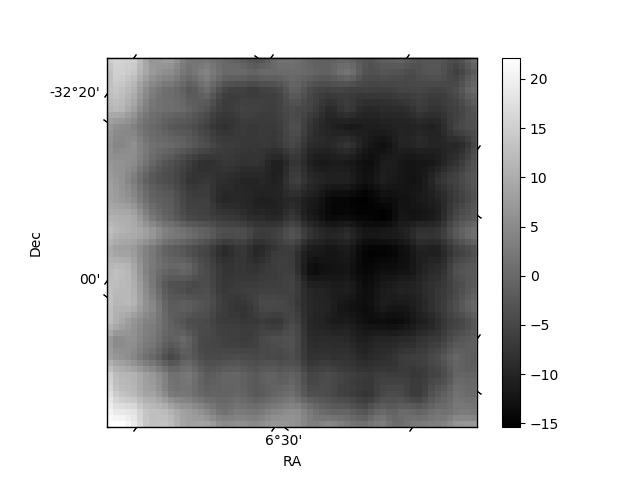
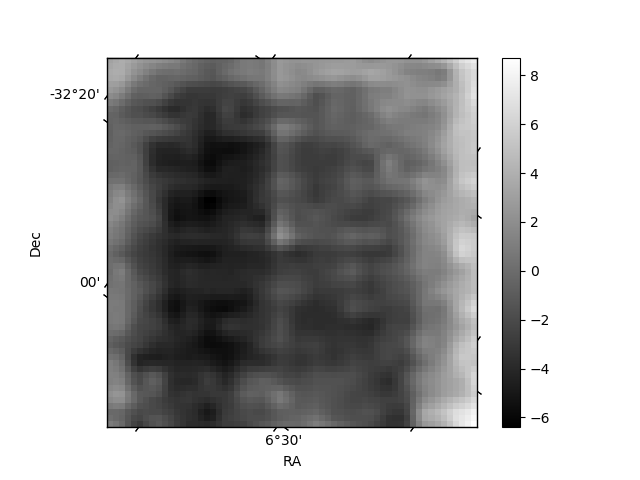
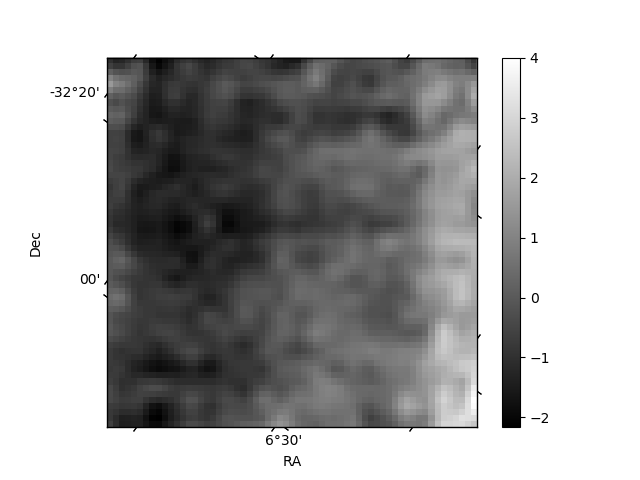
Histogram calculated using DETX and DETY for each event in the final _common_clean file
| Quadrant A | 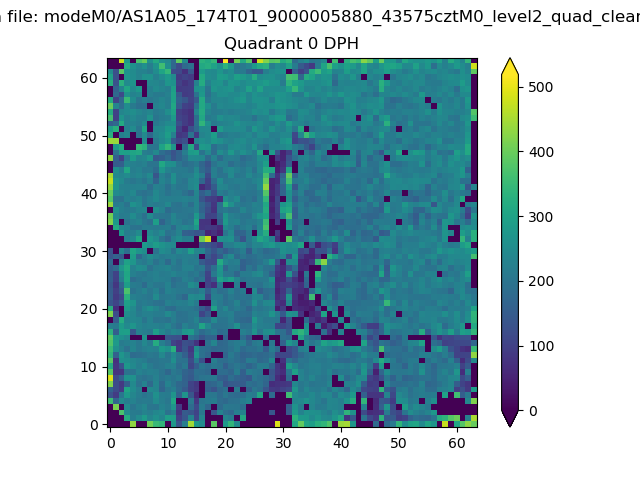 |
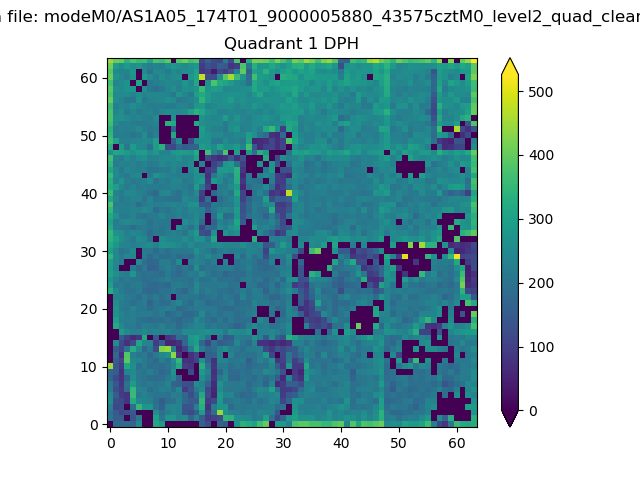 |
Quadrant B |
|---|---|---|---|
| Quadrant D | 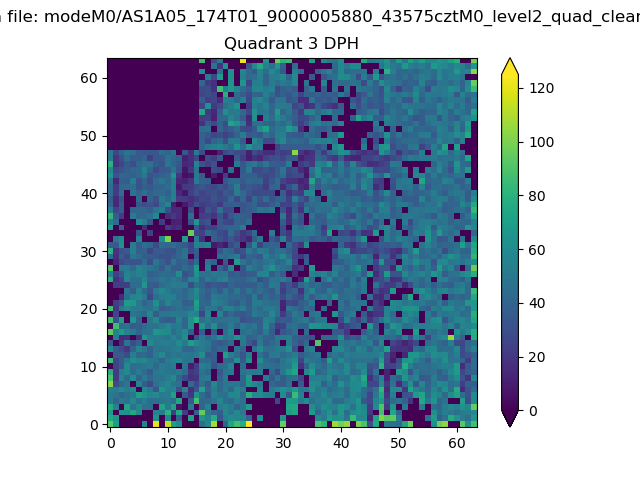 |
 |
Quadrant C |
| Plot type | Count rate plots | Images |
|---|---|---|
| Comparison with Poisson distribution Blue bars denote a histogram of data divided into 1 sec bins. Red curve is a Poisson curve with rate = median count rate of data. |
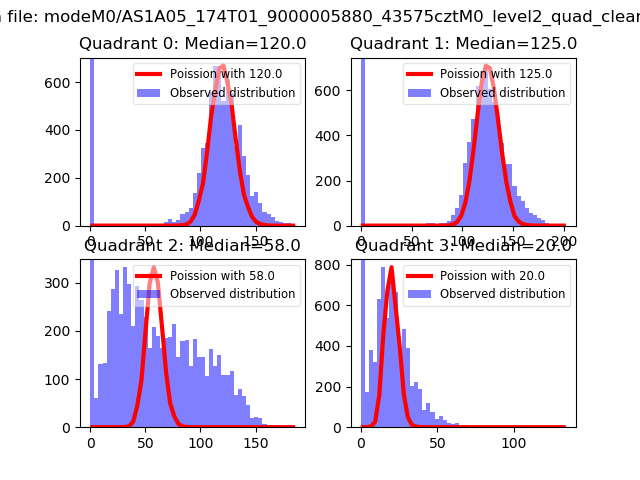 |
 |
| Quadrant-wise count rates Data is divided into 100 sec bins |
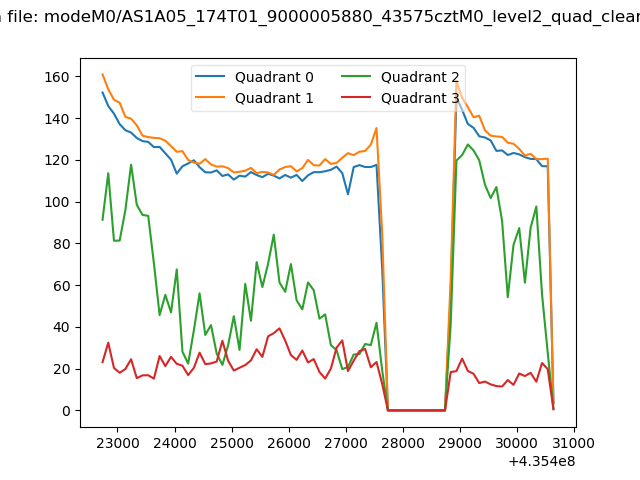 |
|
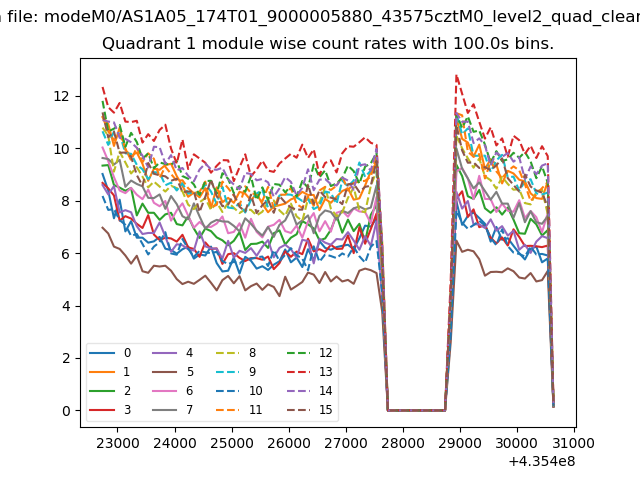
| Module-wise count rates for Quadrant A Data is divided into 100 sec bins |
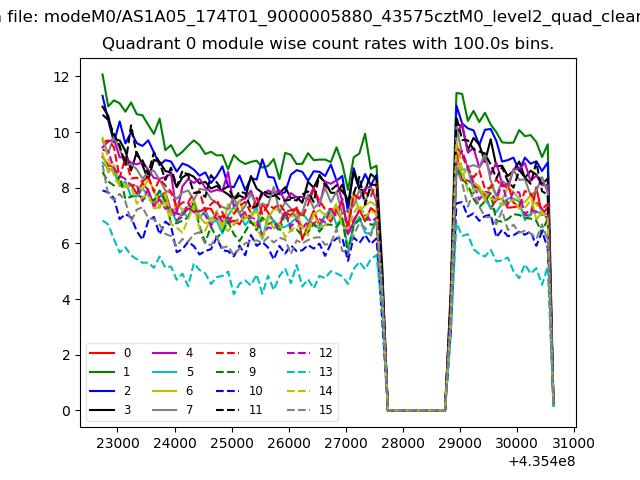 |
 |
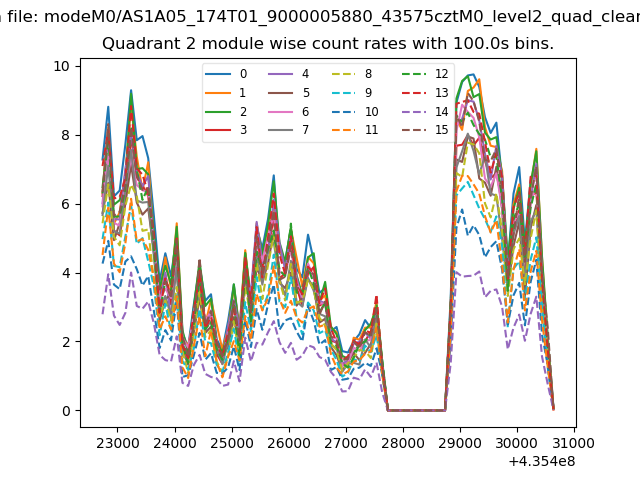
| Module-wise count rates for Quadrant B Data is divided into 100 sec bins |
 |
 |
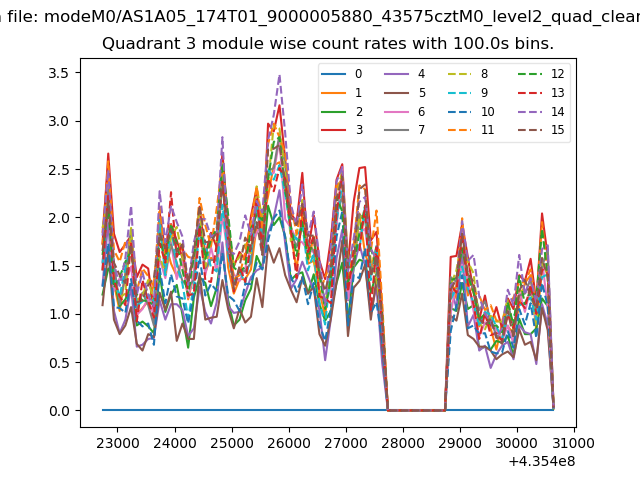
| Module-wise count rates for Quadrant C Data is divided into 100 sec bins |
 |
 |
| Module-wise count rates for Quadrant D Data is divided into 100 sec bins |
 |
 |
| Parameter | Plot |
|---|---|
| CZT HV Monitor | 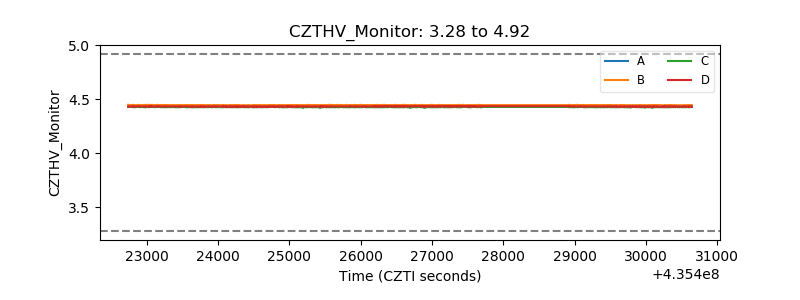 |
| D_VDD | 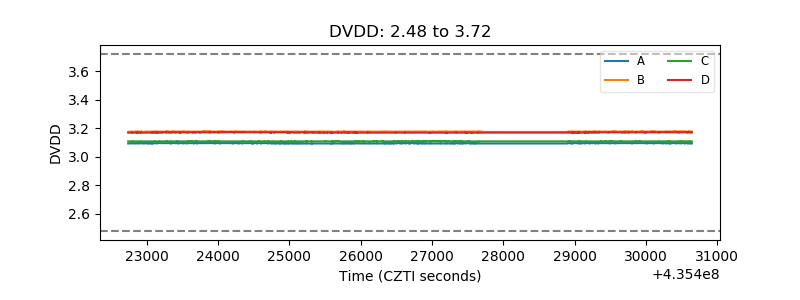 |
| Temperature 1 | 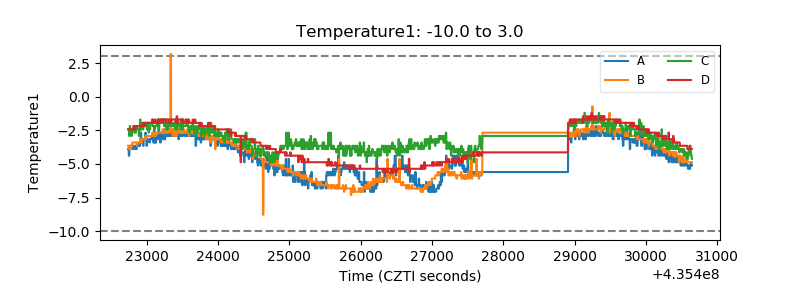 |
| Veto HV Monitor | 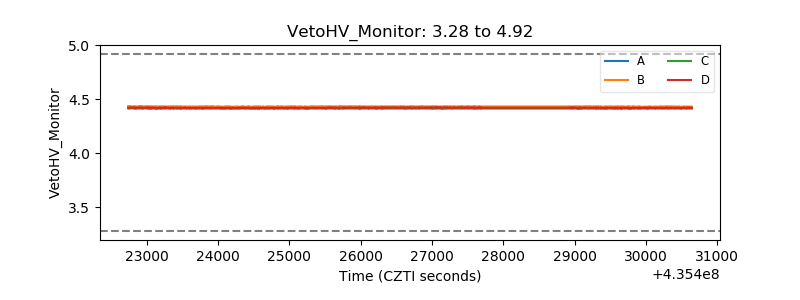 |
| Veto LLD | 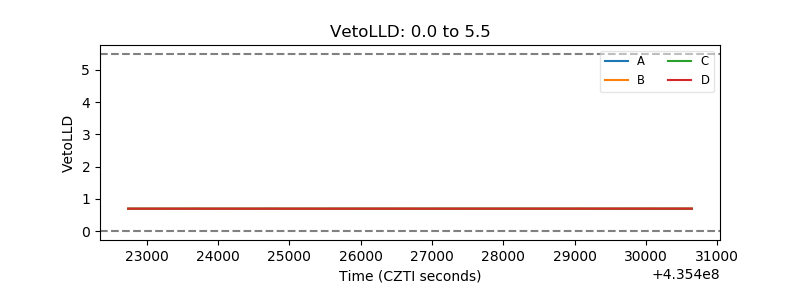 |
| Alpha Counter | 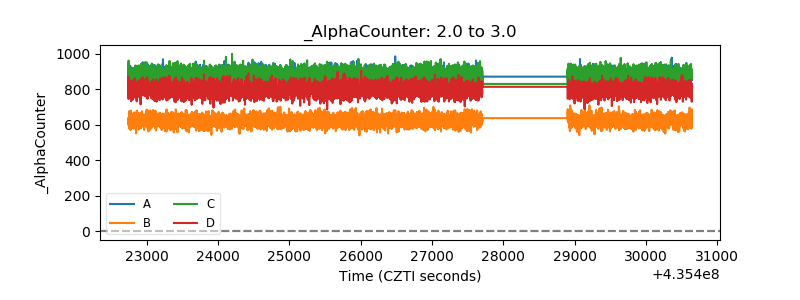 |
| _CPM_Rate | 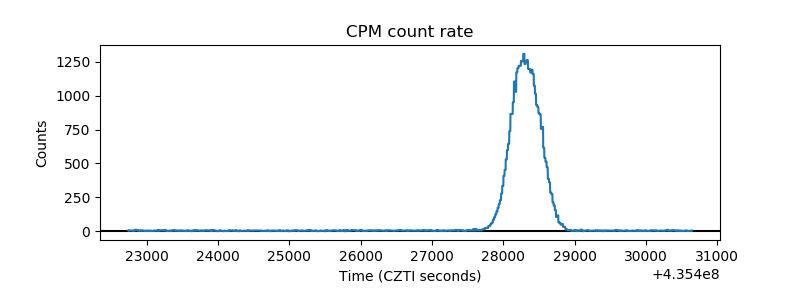 |
| CZT Counter | 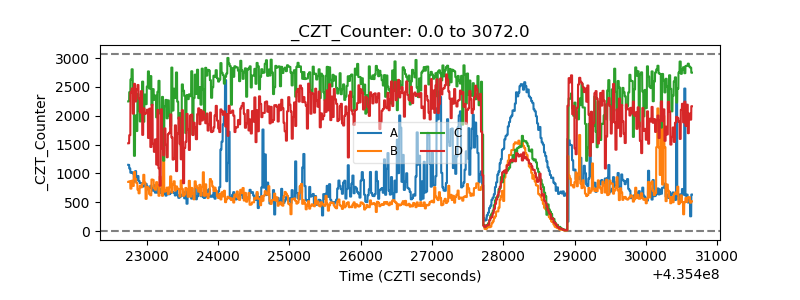 |
| +2.5 Volts monitor | 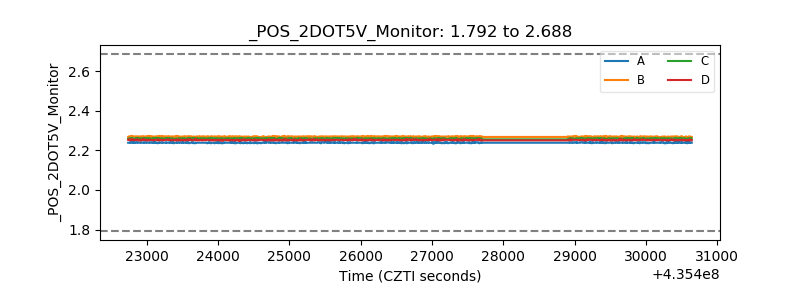 |
| +5 Volts monitor | 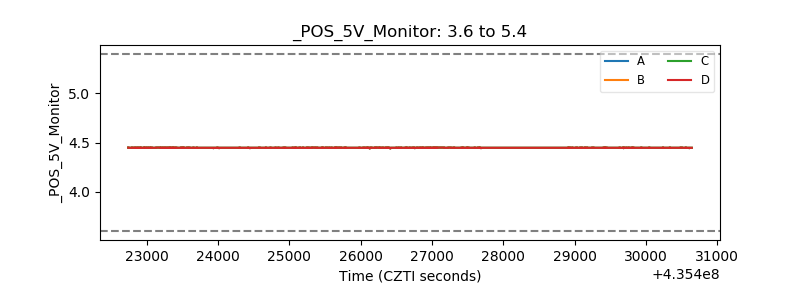 |
| _ROLL_ROT | 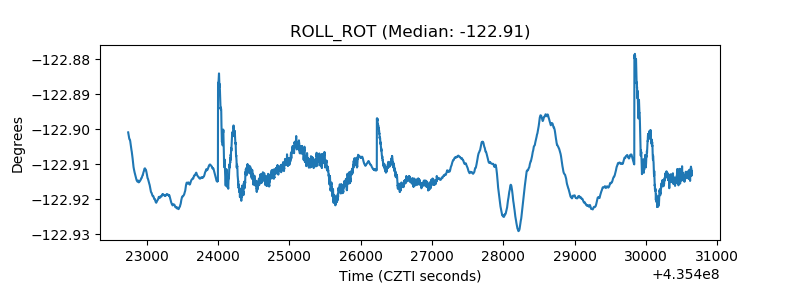 |
| _Roll_DEC | 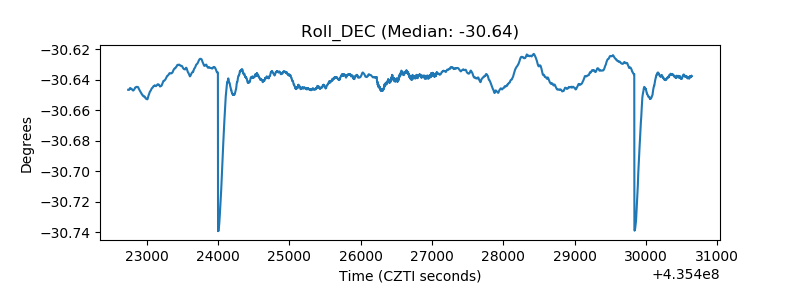 |
| _Roll_RA | 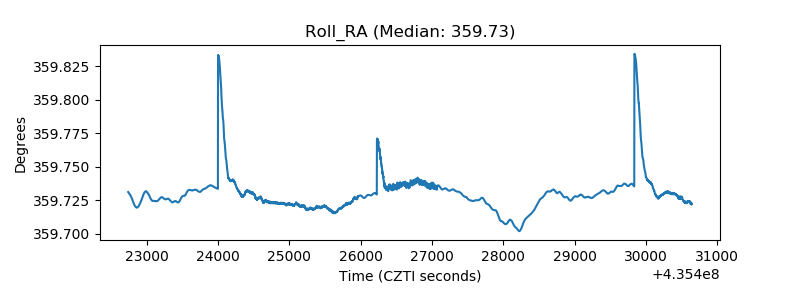 |
| Veto Counter | 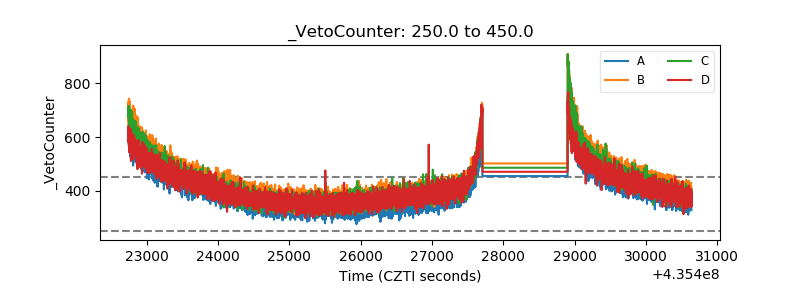 |