| Param | Original file | Final file |
|---|---|---|
| Filename | modeM0/AS1A05_174T01_9000005880_43576cztM0_level2.fits | modeM0/AS1A05_174T01_9000005880_43576cztM0_level2_quad_clean.evt |
| Size (bytes) | 353,678,400 | 29,367,360 |
| Size | 337.3 MB | 28.0 MB |
| Events in quadrant A | 1,486,182 | 264,736 |
| Events in quadrant B | 1,428,061 | 272,593 |
| Events in quadrant C | 5,666,152 | 143,717 |
| Events in quadrant D | 4,337,410 | 46,383 |
| Mode M0 | |||
|---|---|---|---|
| Quadrant | BADHDUFLAG | Total packets | Discarded packets |
| A | 0 | 5946 | 0 |
| B | 0 | 5705 | 0 |
| C | 0 | 18281 | 0 |
| D | 0 | 14407 | 0 |
| Mode SS | |||
|---|---|---|---|
| Quadrant | BADHDUFLAG | Total packets | Discarded packets |
| A | 0 | 44 | 0 |
| B | 0 | 44 | 0 |
| C | 0 | 44 | 0 |
| D | 0 | 44 | 0 |
| Quadrant | Total seconds | Saturated seconds | Saturation percentage |
|---|---|---|---|
| A | 2216 | 5 | 0.225632% |
| B | 2216 | 23 | 1.037906% |
| C | 2216 | 1963 | 88.583032% |
| D | 2216 | 2216 | 100.000000% |
Noise dominated data is calculated using 1-second bins in cleaned event files. If a bin has >2000 counts, and if more than 50% of those come from <1% of pixels, then it is considered to be noise-dominated and hence unusable.
| Quadrant | # 1 sec bins | Bins with >0 counts | Bins with >2000 counts | High rate bins dominated by noise | Noise dominated (total time) | Noise dominated (detector-on time) | Marked lightcurve |
|---|---|---|---|---|---|---|---|
| A | 2216 | 2216 | 5 | 5 | 0.23% | 0.23% | 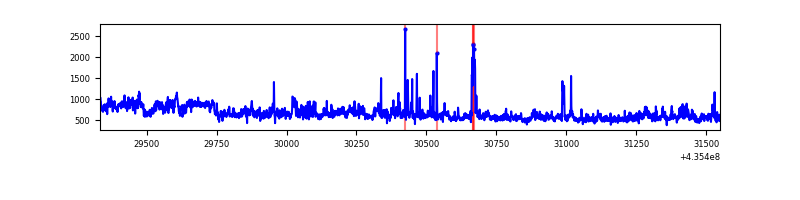 |
| B | 2216 | 2216 | 16 | 16 | 0.72% | 0.72% | 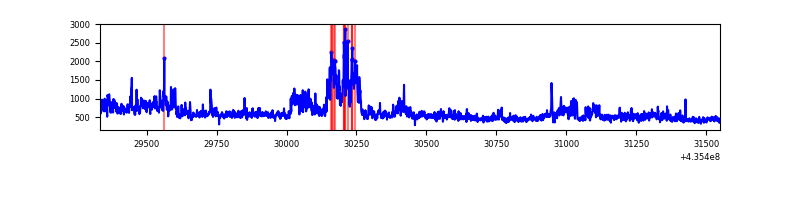 |
| C | 2215 | 2215 | 1965 | 1965 | 88.71% | 88.71% | 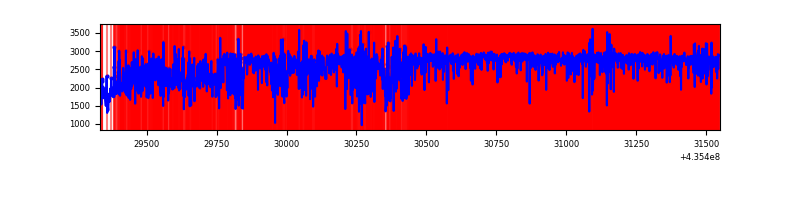 |
| D | 2215 | 2215 | 1024 | 1024 | 46.23% | 46.23% | 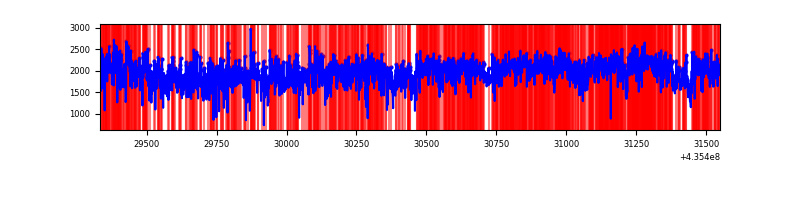 |
Top three noisy pixels from each quadrant. If the there are fewer than three noisy pixels in the level2.evt file, extra rows are filled as -1
| Pixel properties | Quadrant properties | ||||||
|---|---|---|---|---|---|---|---|
| Quadrant | DetID | PixID | Counts | Sigma | Mean | Median | Sigma |
| A | 10 | 83 | 223691 | 4241.89 | 248 | 244 | 52.7 |
| A | 15 | 222 | 142043 | 2691.89 | 248 | 244 | 52.7 |
| A | 14 | 63 | 33466 | 630.68 | 248 | 244 | 52.7 |
| B | 4 | 206 | 389643 | 7886.33 | 247 | 242 | 49.4 |
| B | 0 | 200 | 21295 | 426.38 | 247 | 242 | 49.4 |
| B | 0 | 230 | 17546 | 350.45 | 247 | 242 | 49.4 |
| C | 15 | 174 | 2192114 | 66810.17 | 133 | 134 | 32.8 |
| C | 15 | 142 | 1813471 | 55269.37 | 133 | 134 | 32.8 |
| C | 15 | 126 | 882418 | 26891.46 | 133 | 134 | 32.8 |
| D | 4 | 212 | 2429522 | 149449.36 | 51 | 48 | 16.3 |
| D | 4 | 216 | 369830 | 22747.18 | 51 | 48 | 16.3 |
| D | 13 | 187 | 355120 | 21842.29 | 51 | 48 | 16.3 |
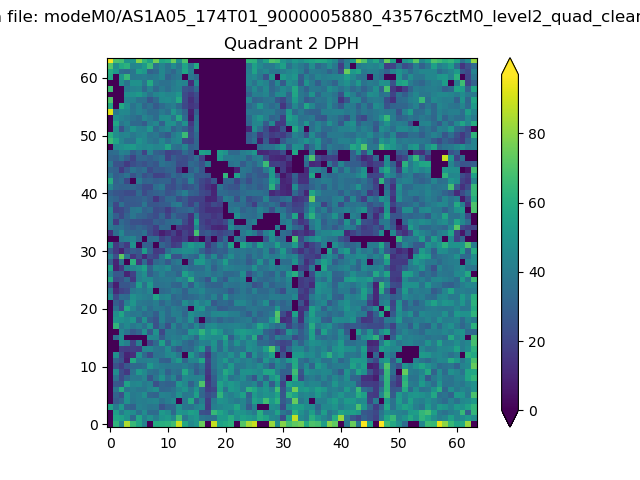
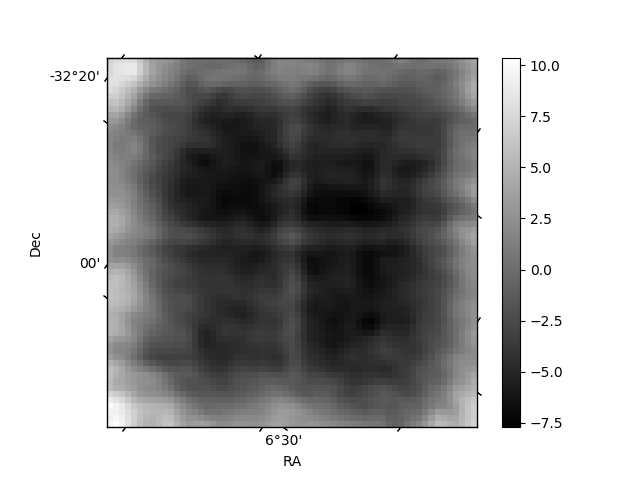
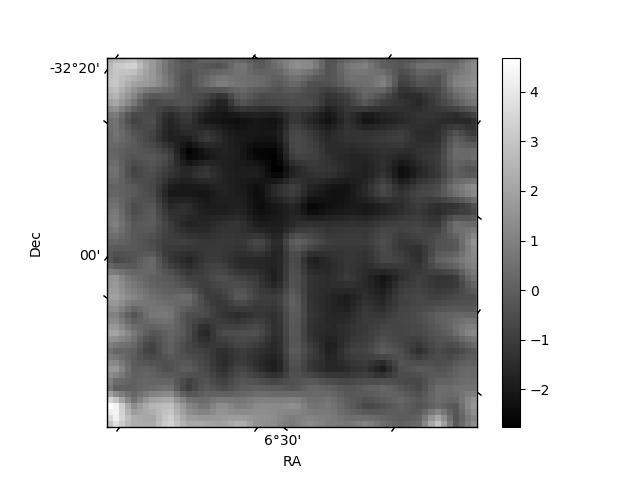
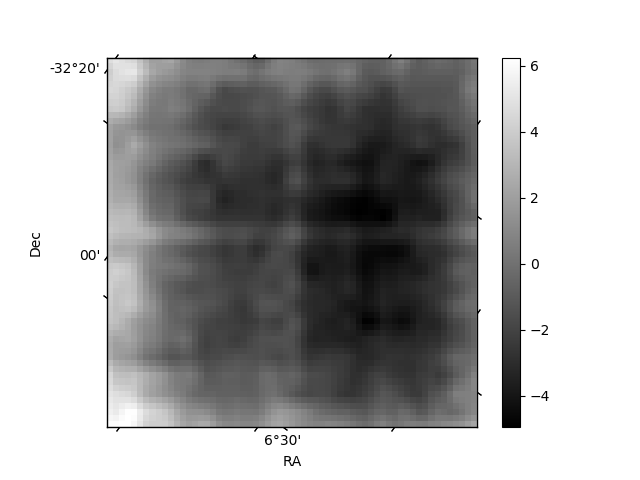
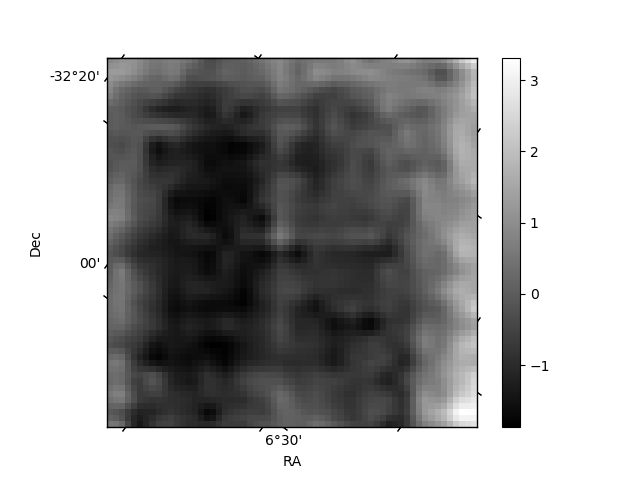
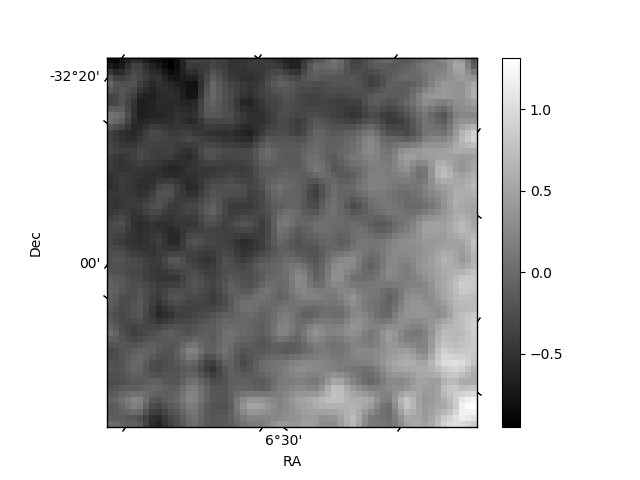
Histogram calculated using DETX and DETY for each event in the final _common_clean file
| Quadrant A | 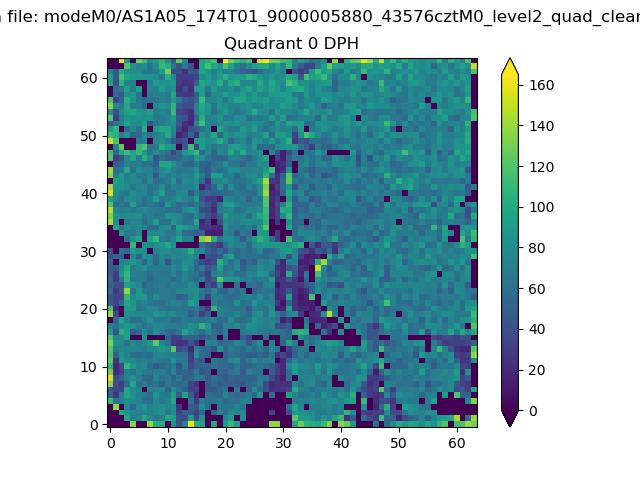 |
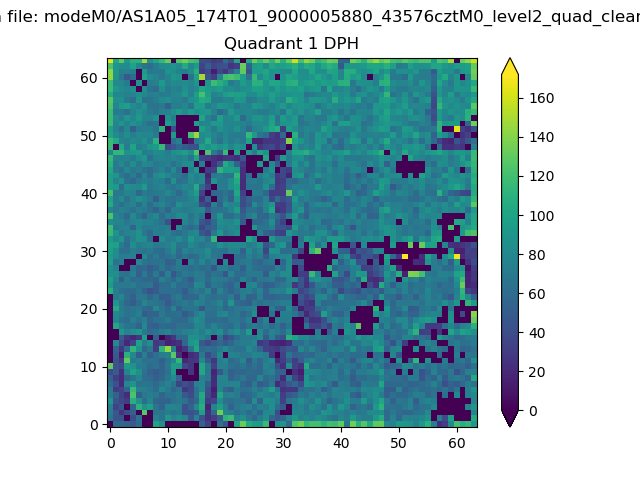 |
Quadrant B |
|---|---|---|---|
| Quadrant D | 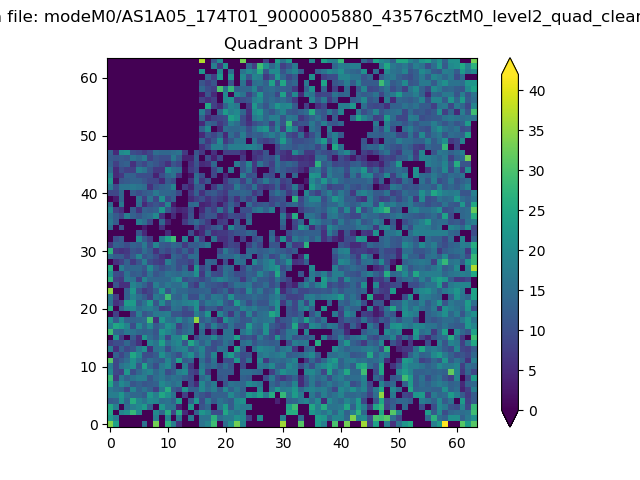 |
 |
Quadrant C |
| Plot type | Count rate plots | Images |
|---|---|---|
| Comparison with Poisson distribution Blue bars denote a histogram of data divided into 1 sec bins. Red curve is a Poisson curve with rate = median count rate of data. |
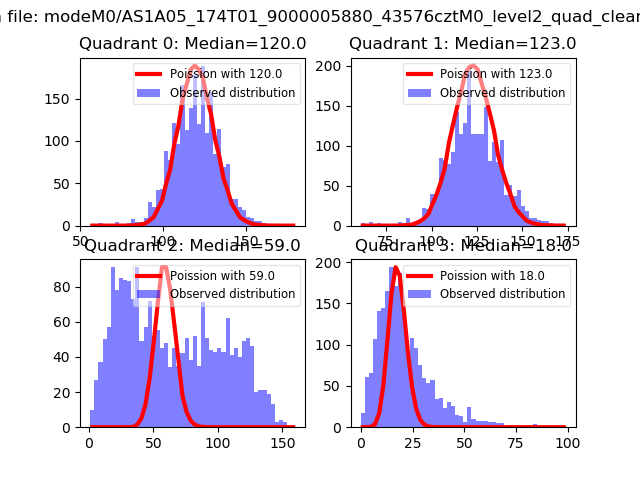 |
 |
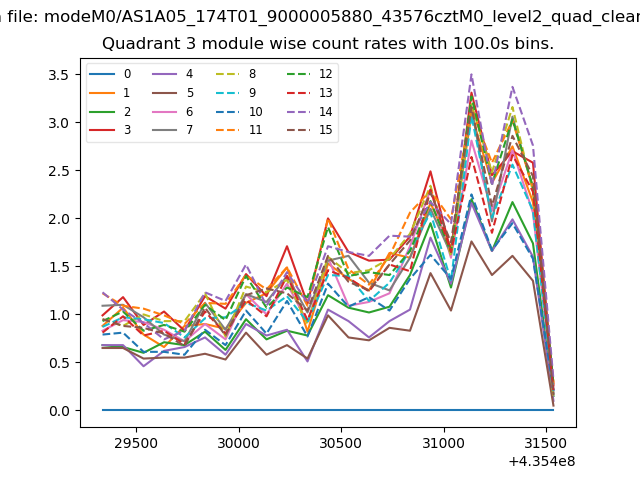
| Quadrant-wise count rates Data is divided into 100 sec bins |
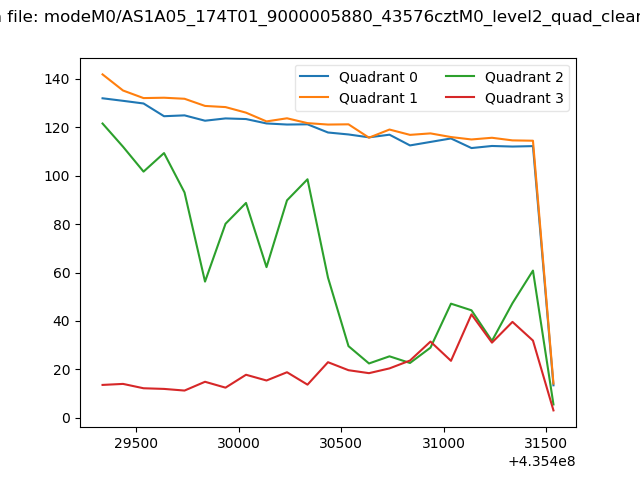 |
|
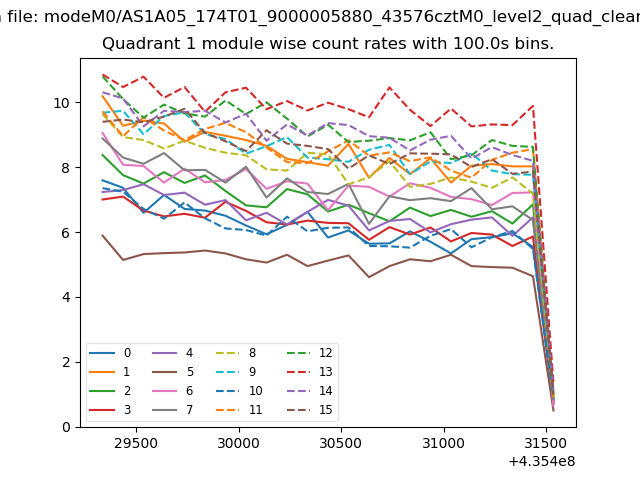
| Module-wise count rates for Quadrant A Data is divided into 100 sec bins |
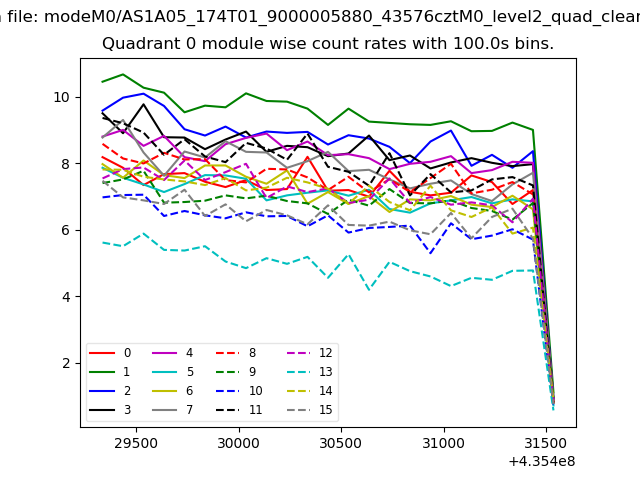 |
 |
| Module-wise count rates for Quadrant B Data is divided into 100 sec bins |
 |
 |
| Module-wise count rates for Quadrant C Data is divided into 100 sec bins |
 |
 |
| Module-wise count rates for Quadrant D Data is divided into 100 sec bins |
 |
 |
| Parameter | Plot |
|---|---|
| CZT HV Monitor | 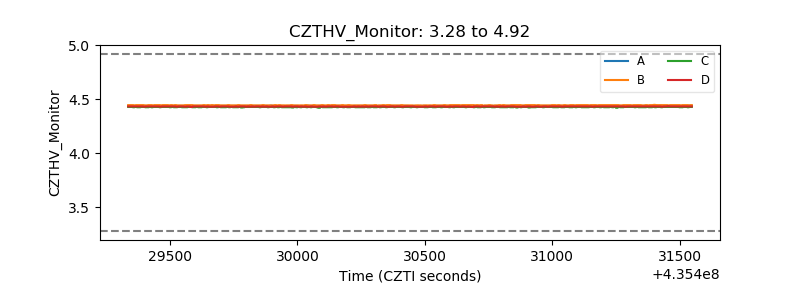 |
| D_VDD | 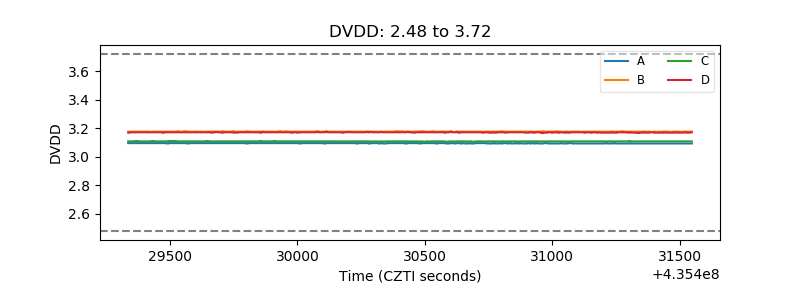 |
| Temperature 1 | 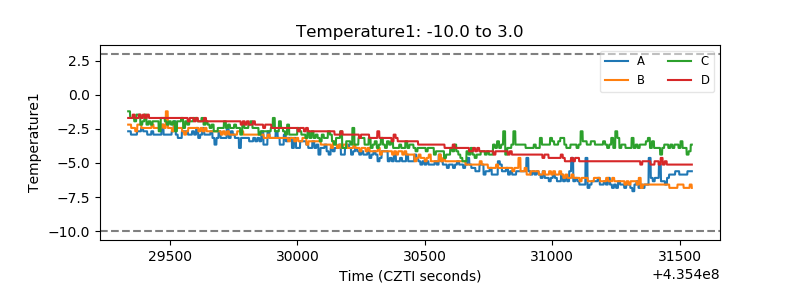 |
| Veto HV Monitor | 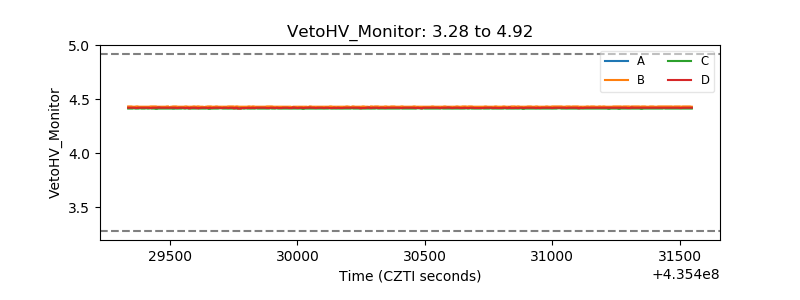 |
| Veto LLD | 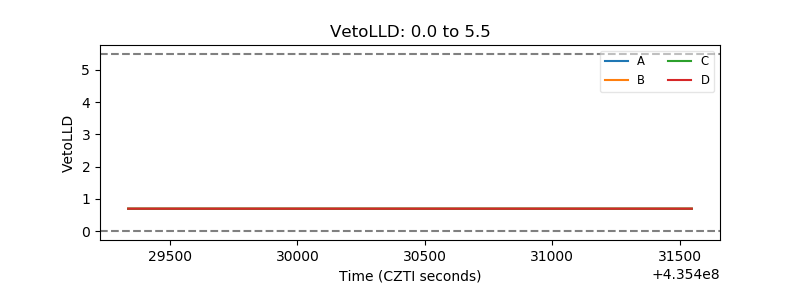 |
| Alpha Counter | 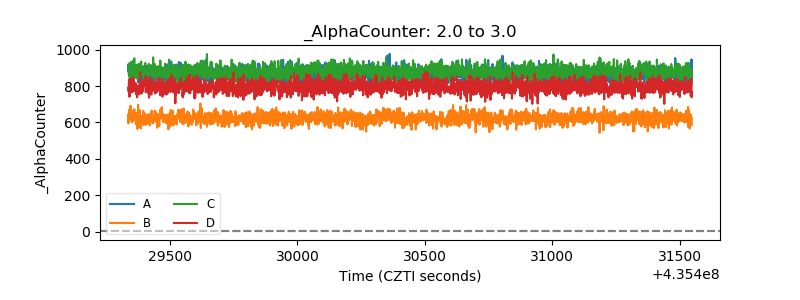 |
| _CPM_Rate | 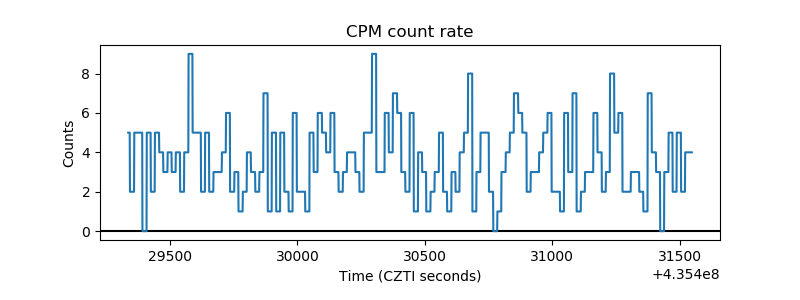 |
| CZT Counter | 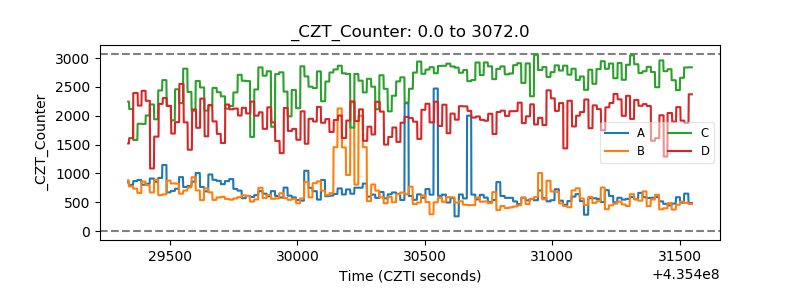 |
| +2.5 Volts monitor | 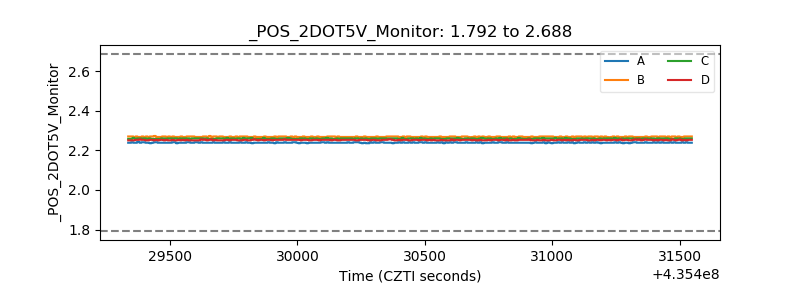 |
| +5 Volts monitor | 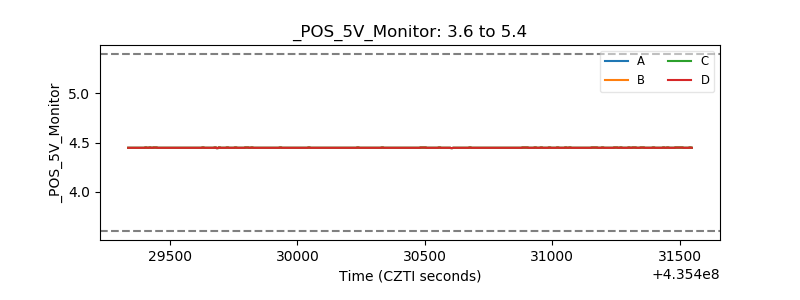 |
| _ROLL_ROT | 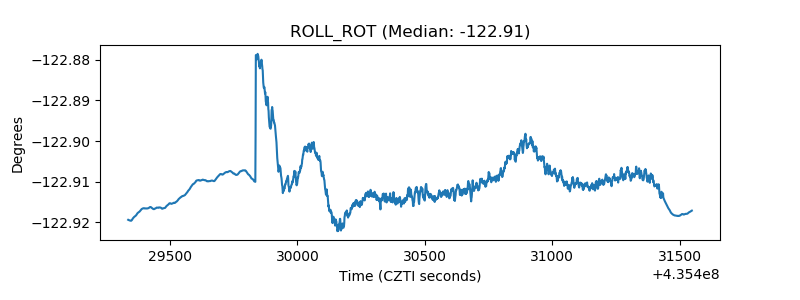 |
| _Roll_DEC | 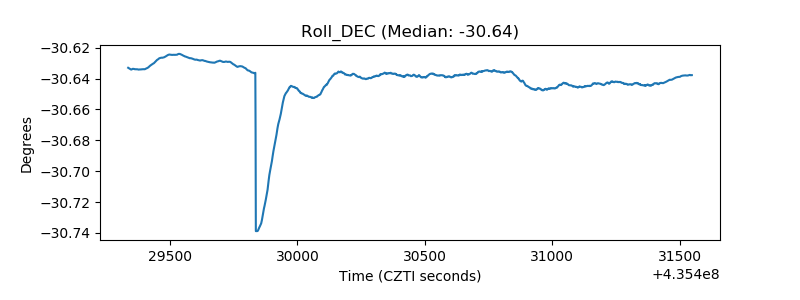 |
| _Roll_RA | 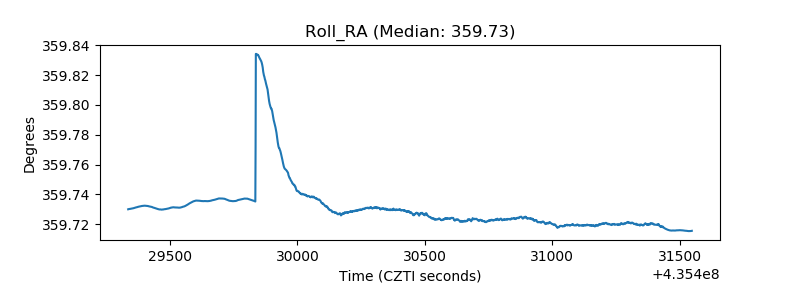 |
| Veto Counter | 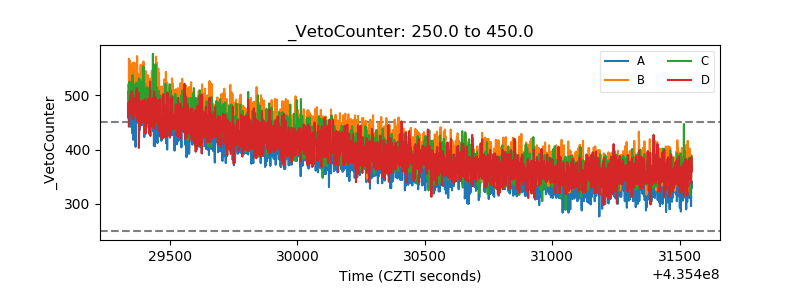 |