| Param | Original file | Final file |
|---|---|---|
| Filename | modeM0/AS1A10_094T26_9000005882_43577cztM0_level2.fits | modeM0/AS1A10_094T26_9000005882_43577cztM0_level2_quad_clean.evt |
| Size (bytes) | 1,084,763,520 | 71,784,000 |
| Size | 1.0 GB | 68.5 MB |
| Events in quadrant A | 5,781,030 | 678,507 |
| Events in quadrant B | 7,088,716 | 692,616 |
| Events in quadrant C | 15,547,674 | 200,363 |
| Events in quadrant D | 11,269,835 | 173,232 |
| Mode SS | |||
|---|---|---|---|
| Quadrant | BADHDUFLAG | Total packets | Discarded packets |
| A | 0 | 124 | 0 |
| B | 0 | 124 | 0 |
| C | 0 | 124 | 0 |
| D | 0 | 124 | 0 |
| Mode M0 | |||
|---|---|---|---|
| Quadrant | BADHDUFLAG | Total packets | Discarded packets |
| A | 0 | 21435 | 1 |
| B | 0 | 25282 | 1 |
| C | 0 | 50314 | 1 |
| D | 0 | 37703 | 1 |
| Mode M9 | |||
|---|---|---|---|
| Quadrant | BADHDUFLAG | Total packets | Discarded packets |
| A | 0 | 10 | 0 |
| B | 0 | 10 | 0 |
| C | 0 | 10 | 0 |
| D | 0 | 10 | 0 |
| Quadrant | Total seconds | Saturated seconds | Saturation percentage |
|---|---|---|---|
| A | 6047 | 458 | 7.574004% |
| B | 6048 | 809 | 13.376323% |
| C | 6048 | 5989 | 99.024471% |
| D | 6048 | 6023 | 99.586640% |
Noise dominated data is calculated using 1-second bins in cleaned event files. If a bin has >2000 counts, and if more than 50% of those come from <1% of pixels, then it is considered to be noise-dominated and hence unusable.
| Quadrant | # 1 sec bins | Bins with >0 counts | Bins with >2000 counts | High rate bins dominated by noise | Noise dominated (total time) | Noise dominated (detector-on time) | Marked lightcurve |
|---|---|---|---|---|---|---|---|
| A | 7112 | 6048 | 299 | 299 | 4.20% | 4.94% | 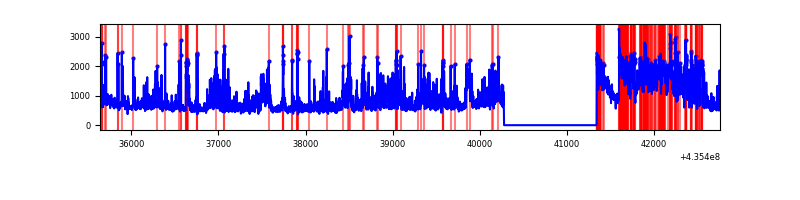 |
| B | 7113 | 6049 | 516 | 516 | 7.25% | 8.53% | 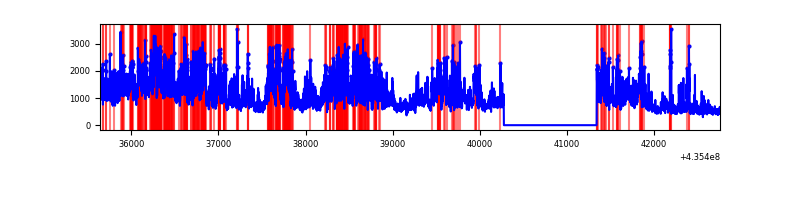 |
| C | 7112 | 6047 | 5833 | 5833 | 82.02% | 96.46% | 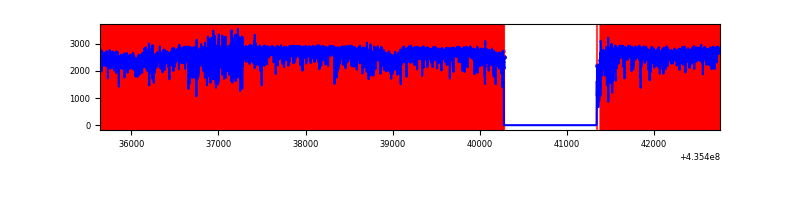 |
| D | 7112 | 6047 | 2418 | 2418 | 34.00% | 39.99% | 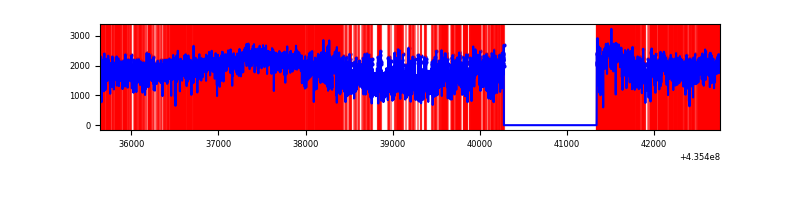 |
Top three noisy pixels from each quadrant. If the there are fewer than three noisy pixels in the level2.evt file, extra rows are filled as -1
| Pixel properties | Quadrant properties | ||||||
|---|---|---|---|---|---|---|---|
| Quadrant | DetID | PixID | Counts | Sigma | Mean | Median | Sigma |
| A | 15 | 222 | 1231396 | 8954.41 | 661 | 648 | 137.4 |
| A | 10 | 83 | 718286 | 5221.23 | 661 | 648 | 137.4 |
| A | 10 | 99 | 658561 | 4786.7 | 661 | 648 | 137.4 |
| B | 4 | 206 | 3739877 | 29568.4 | 662 | 643 | 126.5 |
| B | 0 | 230 | 167424 | 1318.84 | 662 | 643 | 126.5 |
| B | 0 | 219 | 129526 | 1019.16 | 662 | 643 | 126.5 |
| C | 15 | 174 | 8555317 | 173446.3 | 204 | 206 | 49.3 |
| C | 15 | 142 | 4394520 | 89090.31 | 204 | 206 | 49.3 |
| C | 15 | 158 | 1039044 | 21061.4 | 204 | 206 | 49.3 |
| D | 4 | 212 | 4440760 | 69635.07 | 202 | 195 | 63.8 |
| D | 4 | 216 | 2062250 | 32336.28 | 202 | 195 | 63.8 |
| D | 14 | 210 | 525076 | 8230.96 | 202 | 195 | 63.8 |
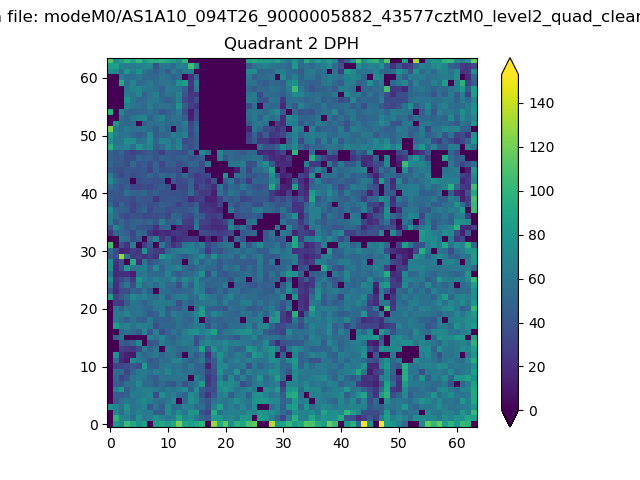
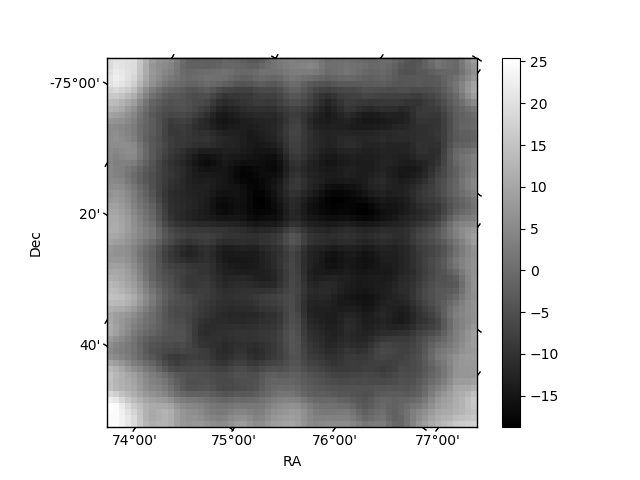
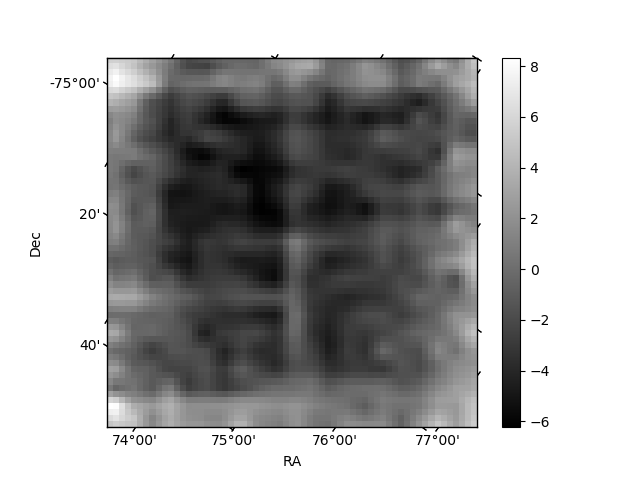
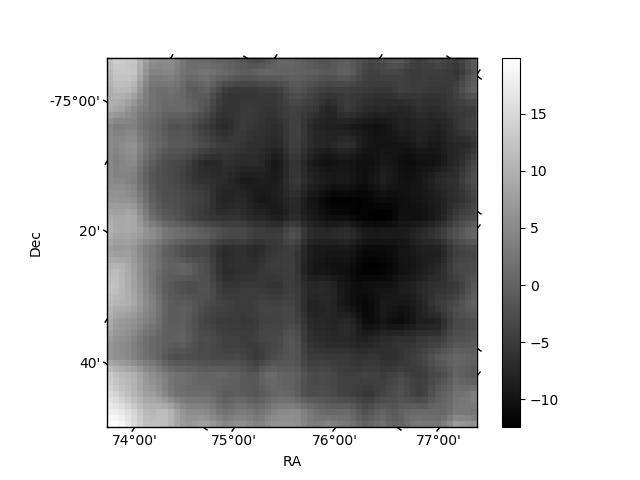
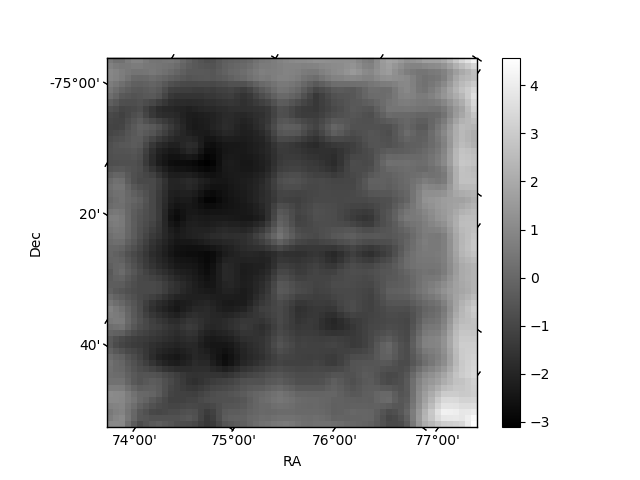
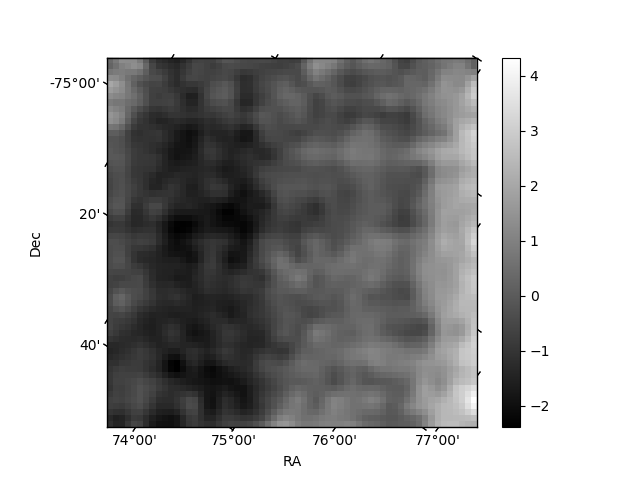
Histogram calculated using DETX and DETY for each event in the final _common_clean file
| Quadrant A | 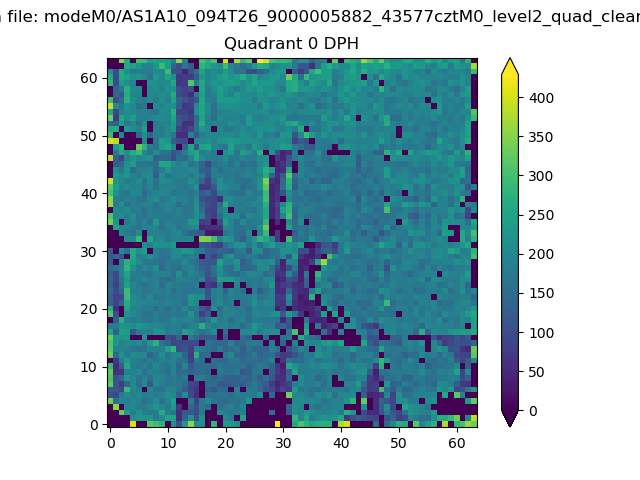 |
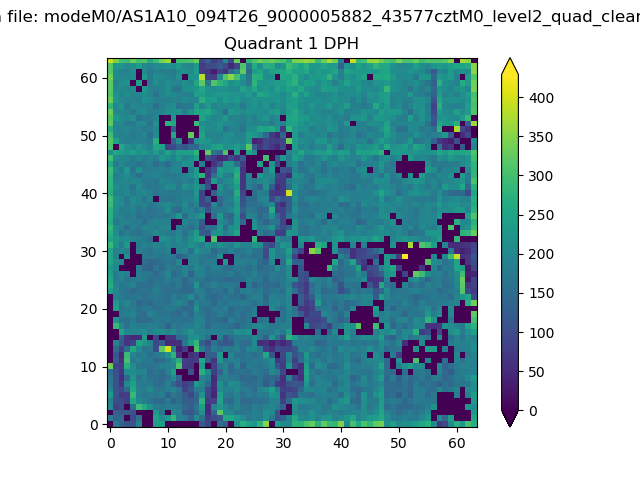 |
Quadrant B |
|---|---|---|---|
| Quadrant D | 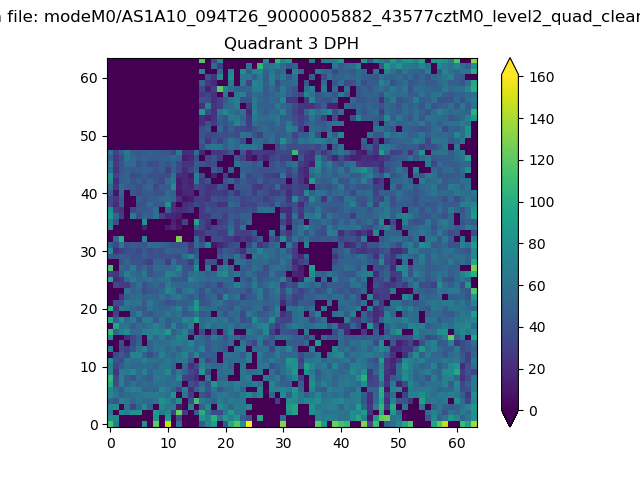 |
 |
Quadrant C |
| Plot type | Count rate plots | Images |
|---|---|---|
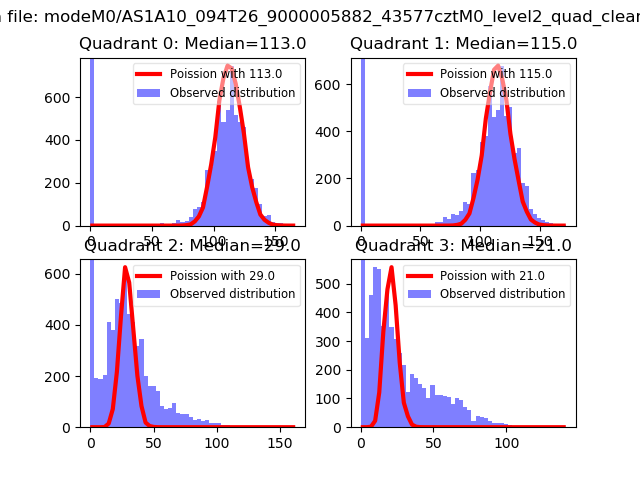
| Comparison with Poisson distribution Blue bars denote a histogram of data divided into 1 sec bins. Red curve is a Poisson curve with rate = median count rate of data. |
 |
 |
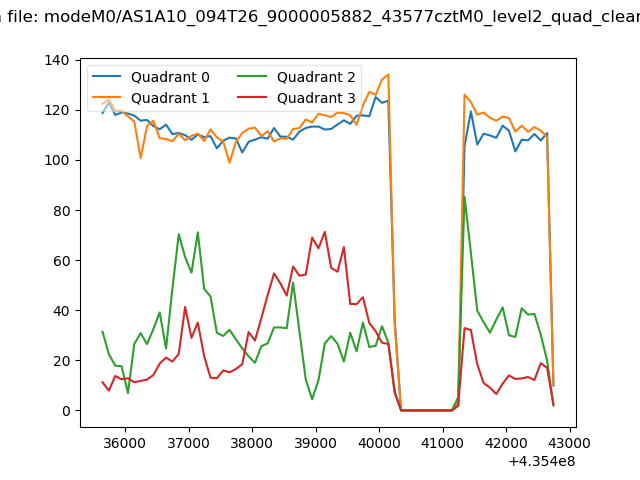
| Quadrant-wise count rates Data is divided into 100 sec bins |
 |
|
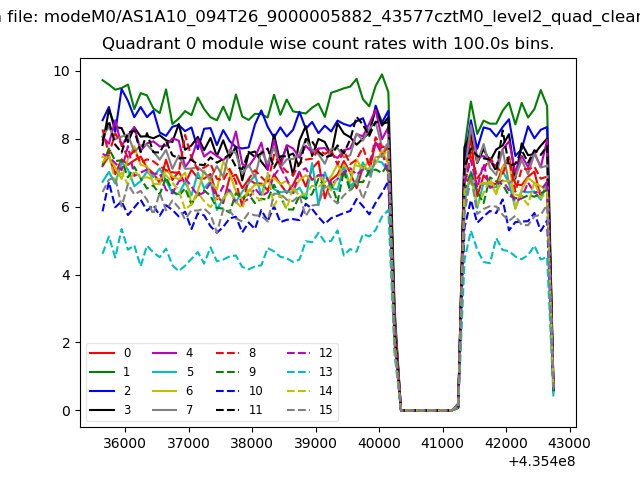
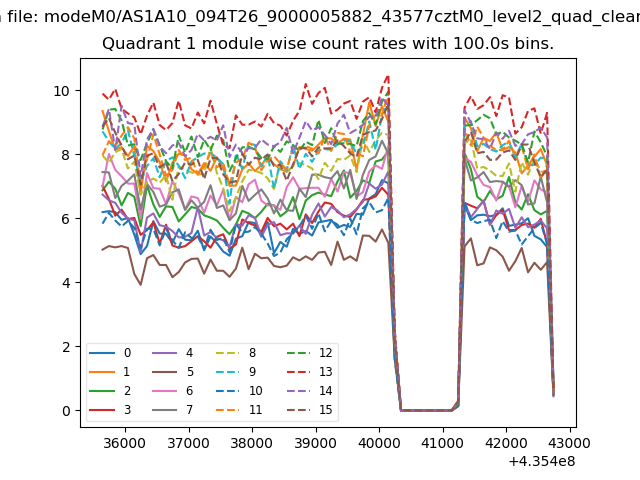
| Module-wise count rates for Quadrant A Data is divided into 100 sec bins |
 |
 |
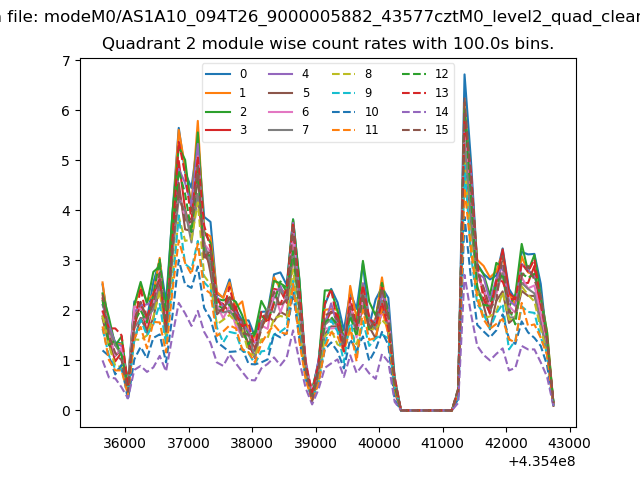
| Module-wise count rates for Quadrant B Data is divided into 100 sec bins |
 |
 |
| Module-wise count rates for Quadrant C Data is divided into 100 sec bins |
 |
 |
| Module-wise count rates for Quadrant D Data is divided into 100 sec bins |
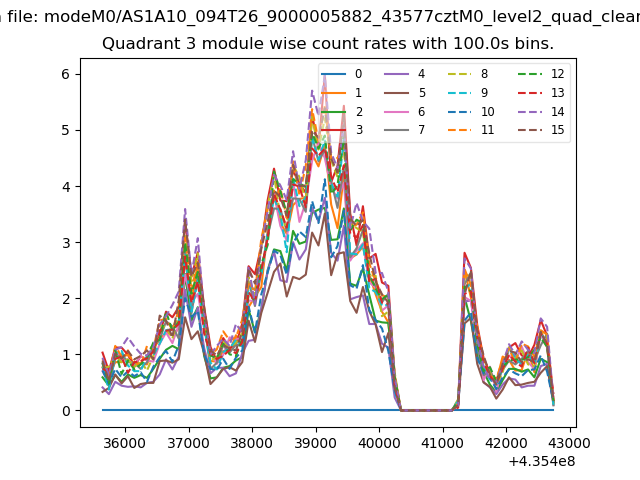 |
 |
| Parameter | Plot |
|---|---|
| CZT HV Monitor | 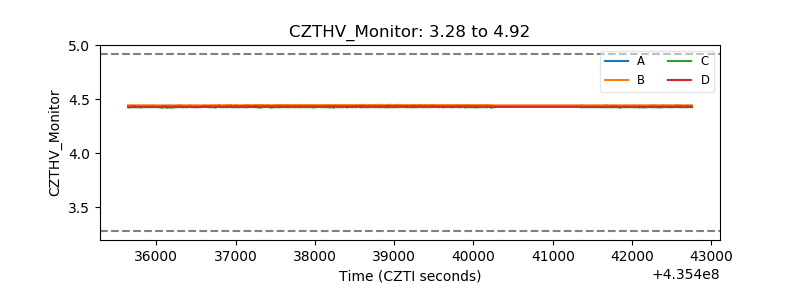 |
| D_VDD | 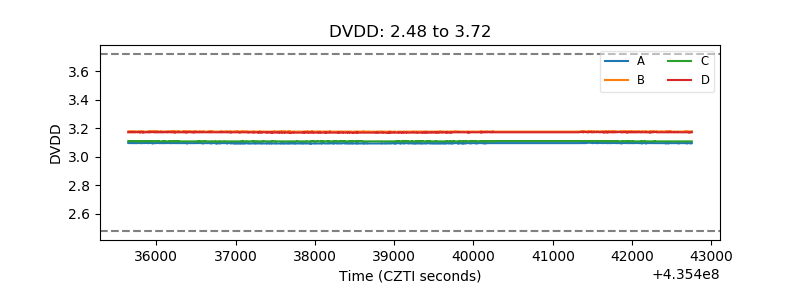 |
| Temperature 1 | 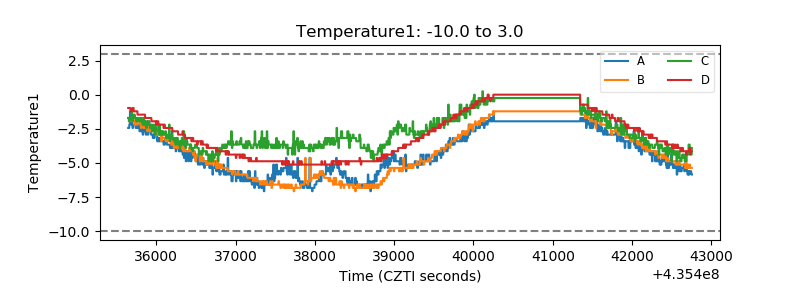 |
| Veto HV Monitor | 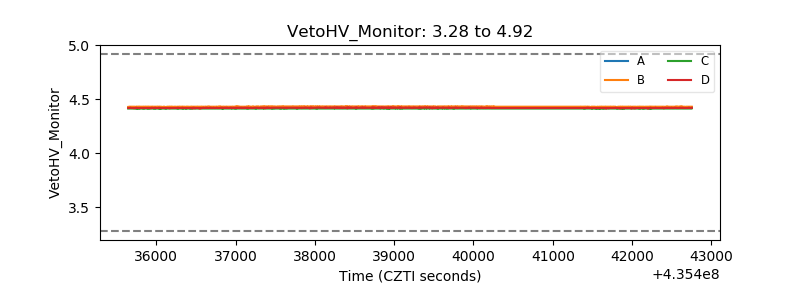 |
| Veto LLD | 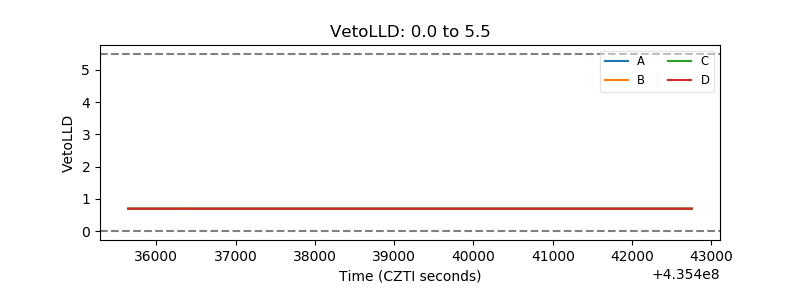 |
| Alpha Counter | 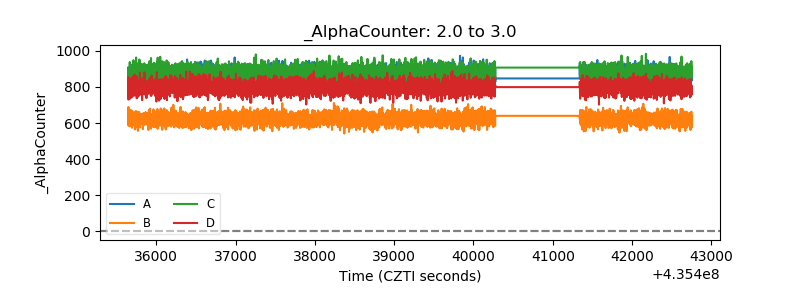 |
| _CPM_Rate | 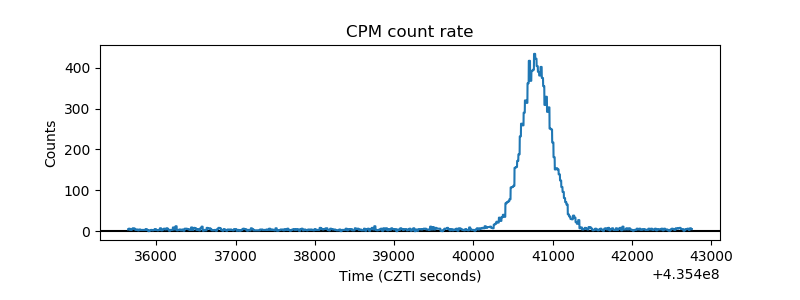 |
| CZT Counter | 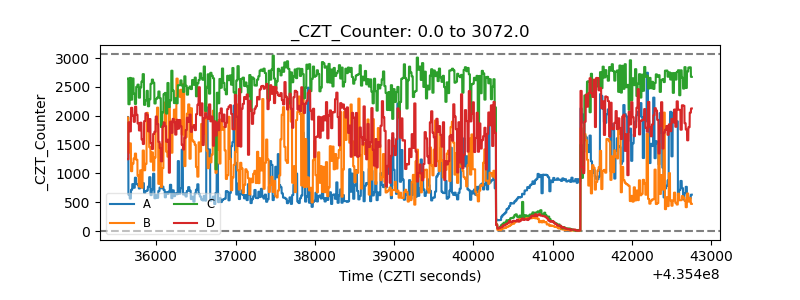 |
| +2.5 Volts monitor | 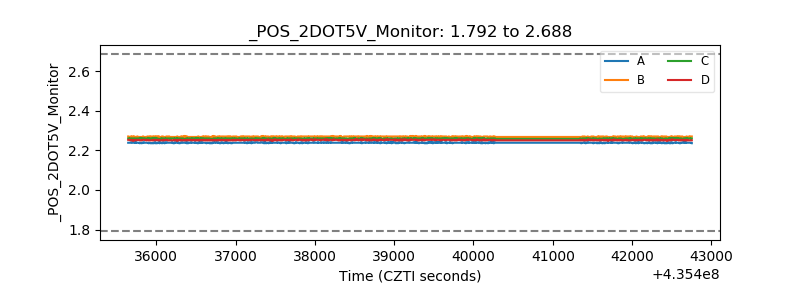 |
| +5 Volts monitor | 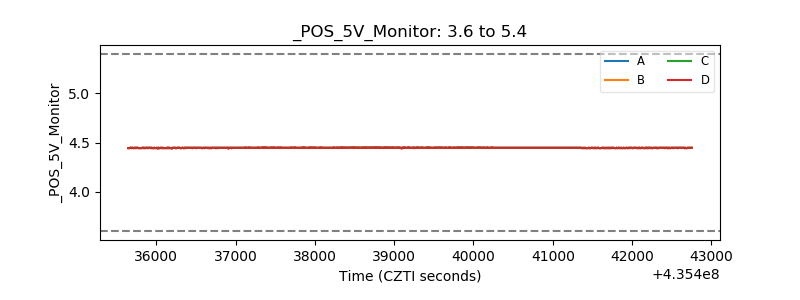 |
| _ROLL_ROT | 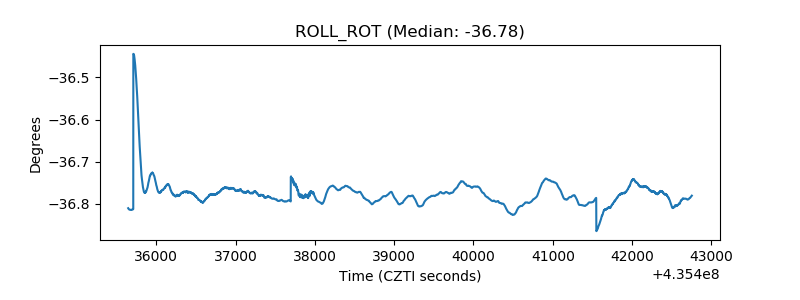 |
| _Roll_DEC | 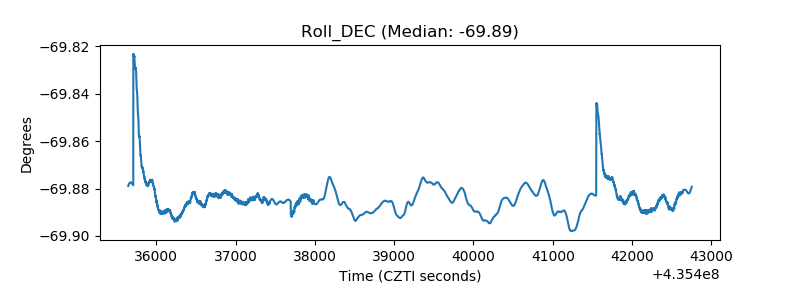 |
| _Roll_RA | 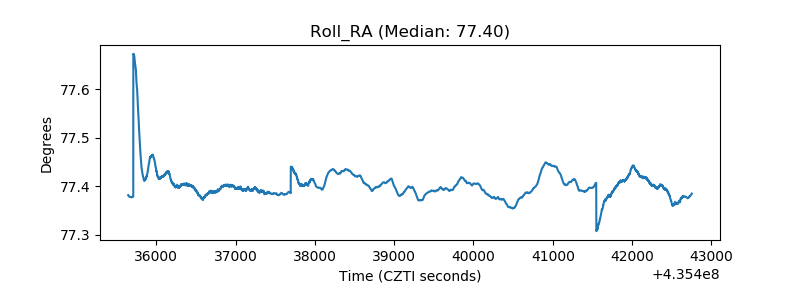 |
| Veto Counter | 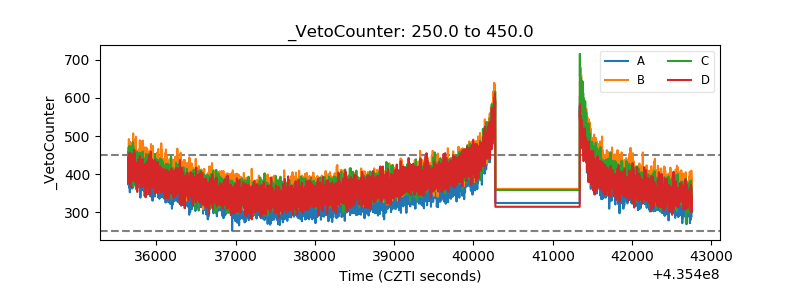 |