| Param | Original file | Final file |
|---|---|---|
| Filename | modeM0/AS1A10_094T26_9000005882_43578cztM0_level2.fits | modeM0/AS1A10_094T26_9000005882_43578cztM0_level2_quad_clean.evt |
| Size (bytes) | 187,608,960 | 11,384,640 |
| Size | 178.9 MB | 10.9 MB |
| Events in quadrant A | 1,503,449 | 112,125 |
| Events in quadrant B | 762,672 | 116,934 |
| Events in quadrant C | 2,676,644 | 32,429 |
| Events in quadrant D | 1,919,998 | 4,048 |
| Mode SS | |||
|---|---|---|---|
| Quadrant | BADHDUFLAG | Total packets | Discarded packets |
| A | 0 | 20 | 0 |
| B | 0 | 20 | 0 |
| C | 0 | 20 | 0 |
| D | 0 | 20 | 0 |
| Mode M0 | |||
|---|---|---|---|
| Quadrant | BADHDUFLAG | Total packets | Discarded packets |
| A | 0 | 5189 | 0 |
| B | 0 | 2969 | 0 |
| C | 0 | 8659 | 0 |
| D | 0 | 6415 | 0 |
| Quadrant | Total seconds | Saturated seconds | Saturation percentage |
|---|---|---|---|
| A | 1023 | 153 | 14.956012% |
| B | 1023 | 33 | 3.225806% |
| C | 1023 | 1023 | 100.000000% |
| D | 1023 | 1023 | 100.000000% |
Noise dominated data is calculated using 1-second bins in cleaned event files. If a bin has >2000 counts, and if more than 50% of those come from <1% of pixels, then it is considered to be noise-dominated and hence unusable.
| Quadrant | # 1 sec bins | Bins with >0 counts | Bins with >2000 counts | High rate bins dominated by noise | Noise dominated (total time) | Noise dominated (detector-on time) | Marked lightcurve |
|---|---|---|---|---|---|---|---|
| A | 1023 | 1023 | 142 | 142 | 13.88% | 13.88% | 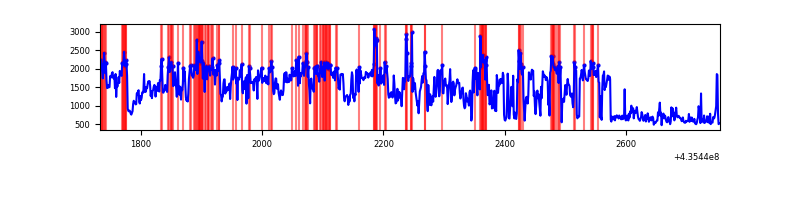 |
| B | 1023 | 1023 | 17 | 17 | 1.66% | 1.66% | 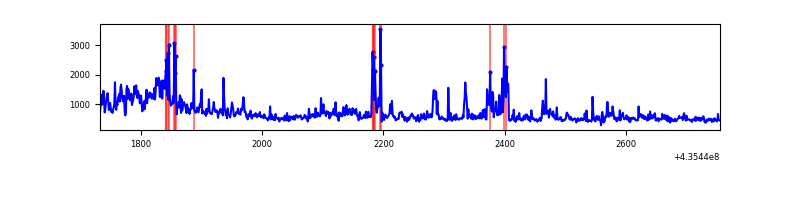 |
| C | 1022 | 1022 | 1012 | 1012 | 99.02% | 99.02% | 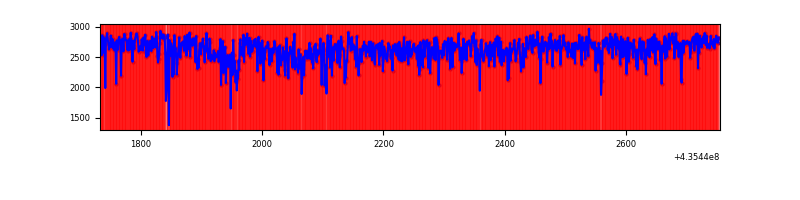 |
| D | 1022 | 1022 | 379 | 379 | 37.08% | 37.08% | 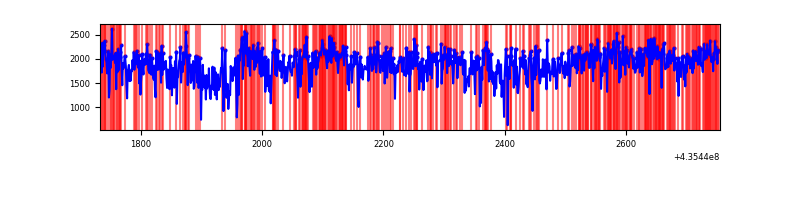 |
Top three noisy pixels from each quadrant. If the there are fewer than three noisy pixels in the level2.evt file, extra rows are filled as -1
| Pixel properties | Quadrant properties | ||||||
|---|---|---|---|---|---|---|---|
| Quadrant | DetID | PixID | Counts | Sigma | Mean | Median | Sigma |
| A | 15 | 222 | 788828 | 31736.06 | 108 | 106 | 24.9 |
| A | 10 | 83 | 130526 | 5247.75 | 108 | 106 | 24.9 |
| A | 15 | 223 | 62652 | 2516.68 | 108 | 106 | 24.9 |
| B | 4 | 206 | 156245 | 6527.29 | 112 | 109 | 23.9 |
| B | 0 | 199 | 38519 | 1605.74 | 112 | 109 | 23.9 |
| B | 0 | 230 | 36960 | 1540.56 | 112 | 109 | 23.9 |
| C | 15 | 174 | 1344068 | 133014.51 | 34 | 33 | 10.1 |
| C | 15 | 142 | 804803 | 79645.31 | 34 | 33 | 10.1 |
| C | 15 | 158 | 202282 | 20015.89 | 34 | 33 | 10.1 |
| D | 4 | 212 | 919008 | 144798.65 | 15 | 14 | 6.3 |
| D | 4 | 216 | 313503 | 49393.99 | 15 | 14 | 6.3 |
| D | 14 | 210 | 73249 | 11539.06 | 15 | 14 | 6.3 |
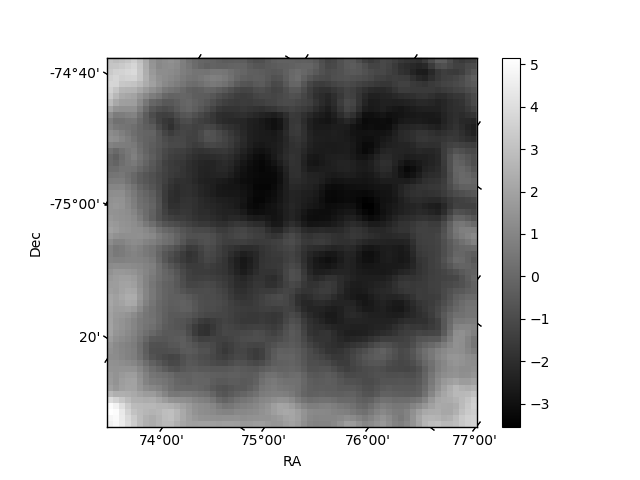
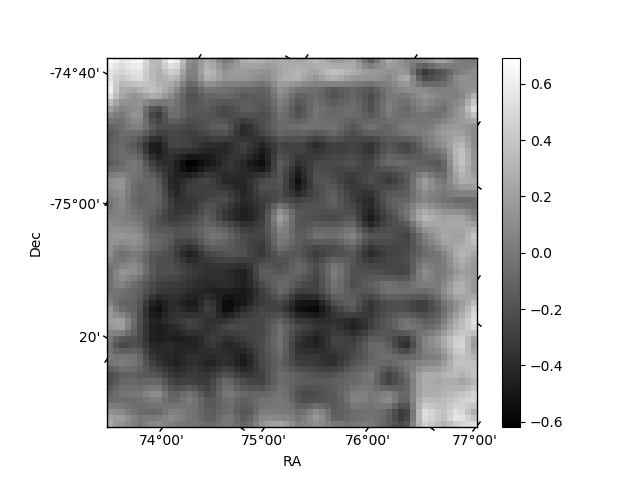
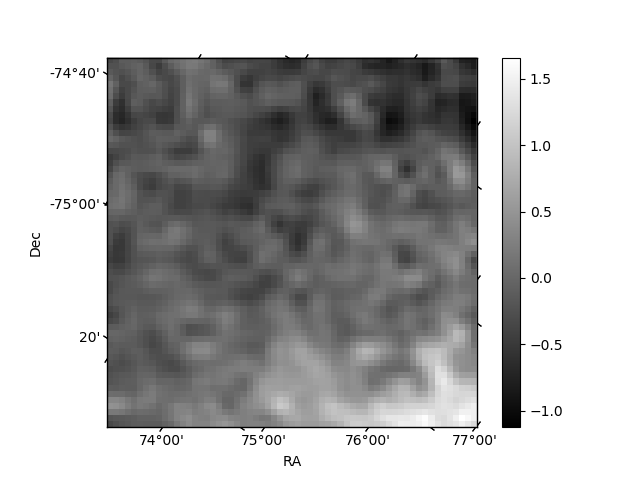
Histogram calculated using DETX and DETY for each event in the final _common_clean file
| Quadrant A | 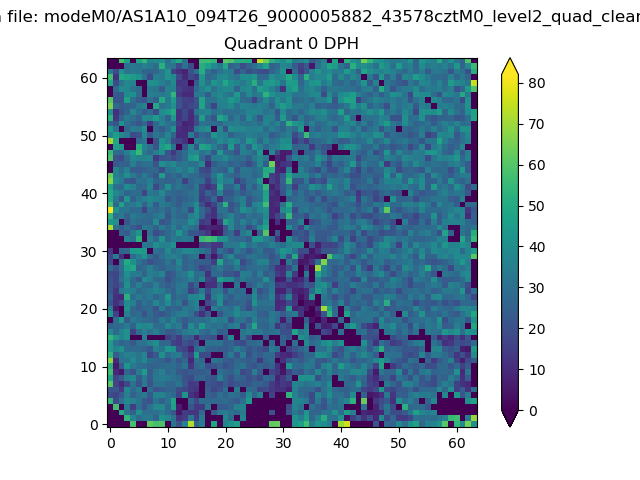 |
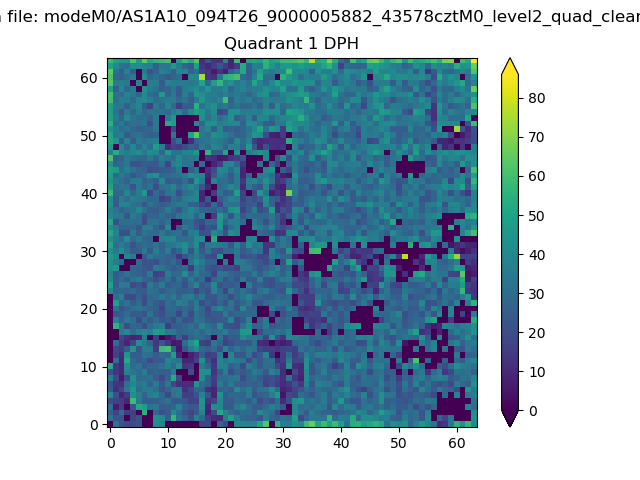 |
Quadrant B |
|---|---|---|---|
| Quadrant D | 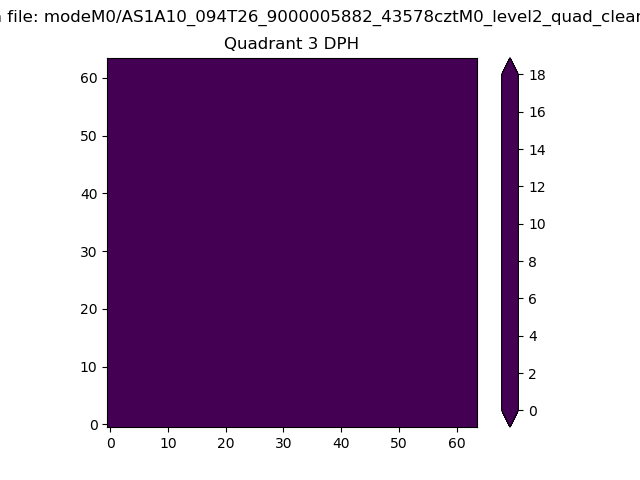 |
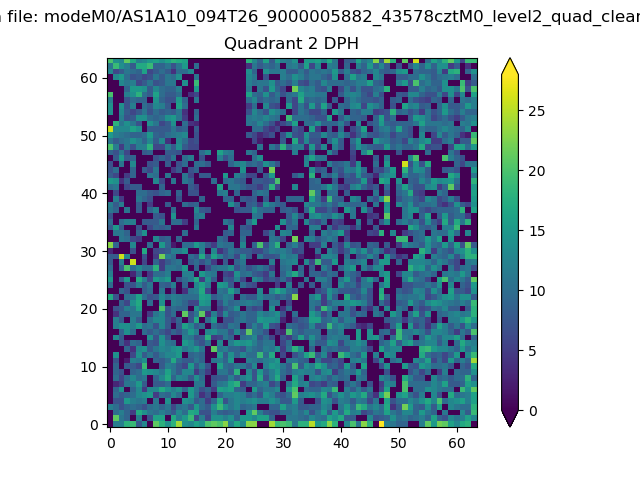 |
Quadrant C |
| Plot type | Count rate plots | Images |
|---|---|---|
| Comparison with Poisson distribution Blue bars denote a histogram of data divided into 1 sec bins. Red curve is a Poisson curve with rate = median count rate of data. |
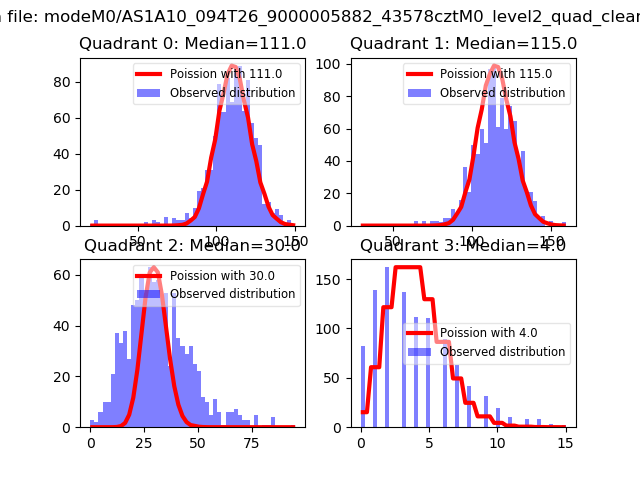 |
 |
| Quadrant-wise count rates Data is divided into 100 sec bins |
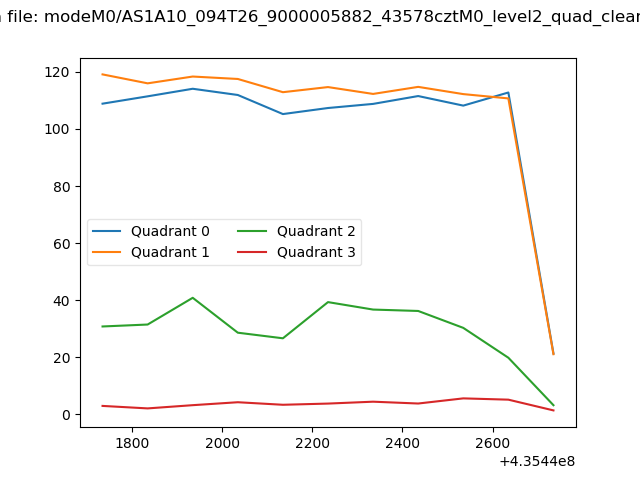 |
|
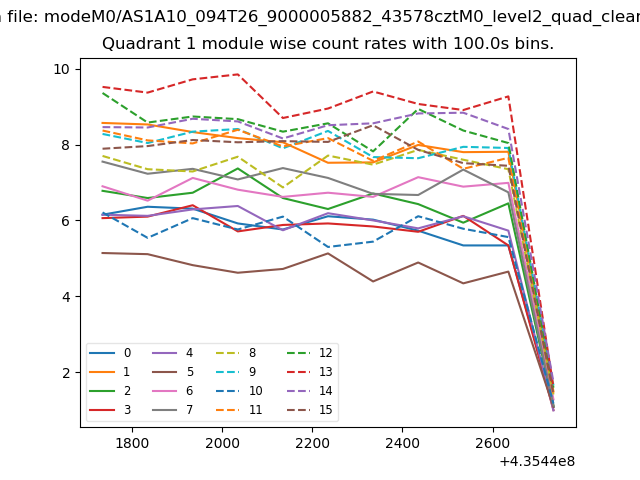
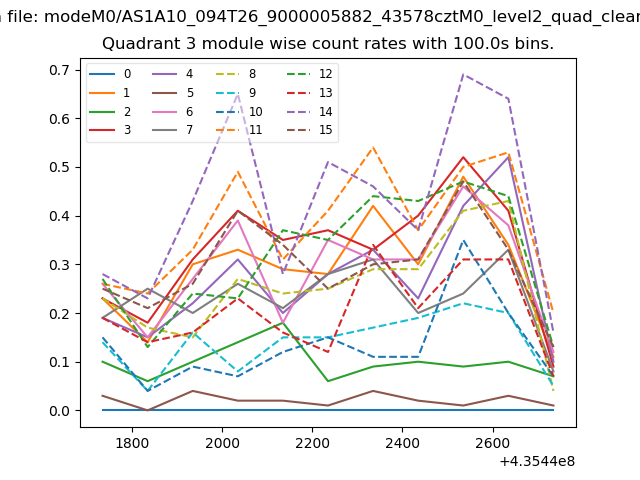
| Module-wise count rates for Quadrant A Data is divided into 100 sec bins |
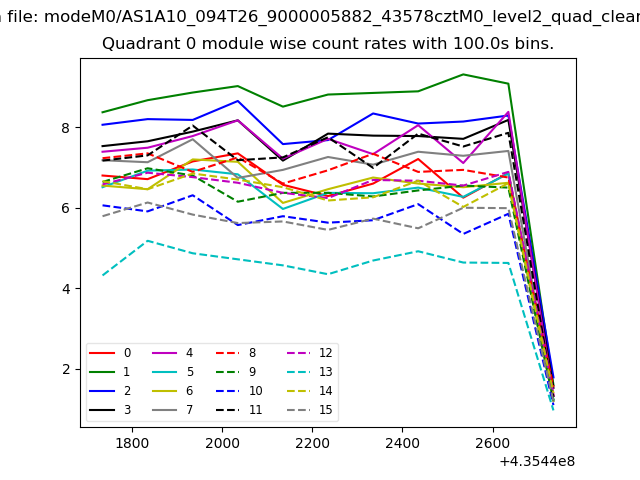 |
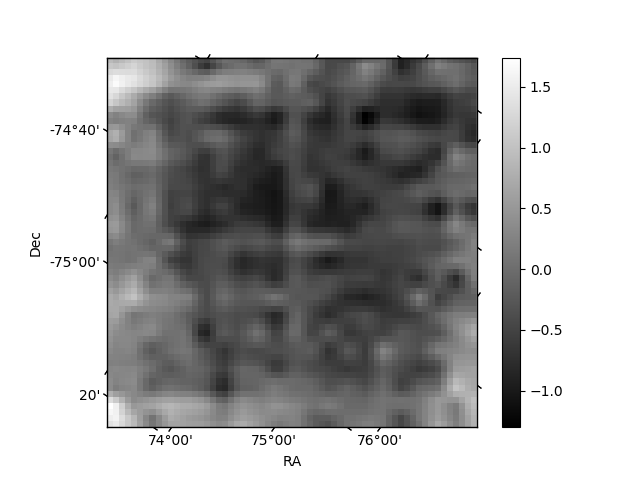 |
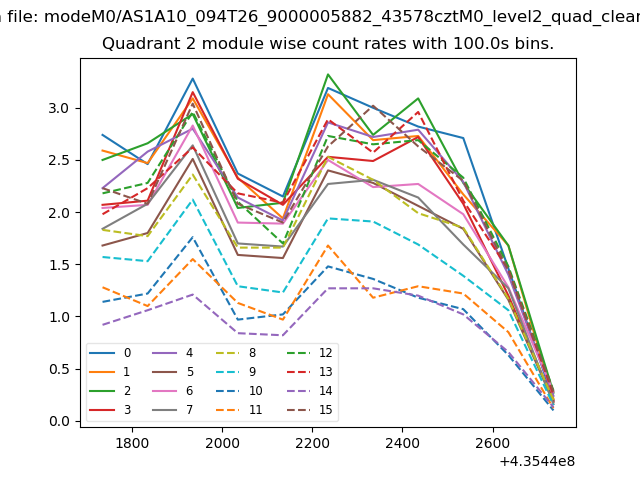
| Module-wise count rates for Quadrant B Data is divided into 100 sec bins |
 |
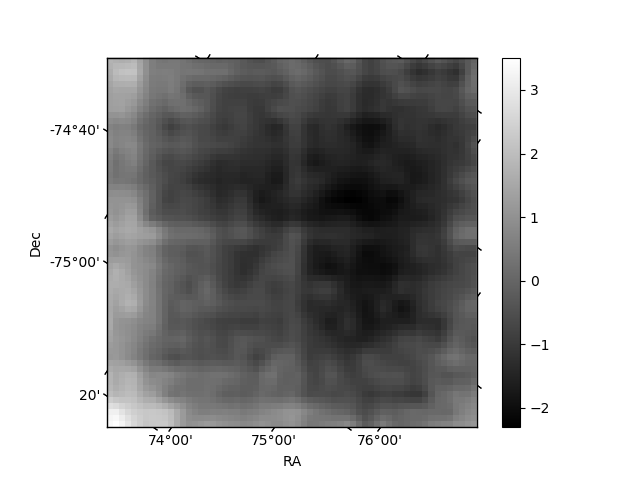 |
| Module-wise count rates for Quadrant C Data is divided into 100 sec bins |
 |
 |
| Module-wise count rates for Quadrant D Data is divided into 100 sec bins |
 |
 |
| Parameter | Plot |
|---|---|
| CZT HV Monitor | 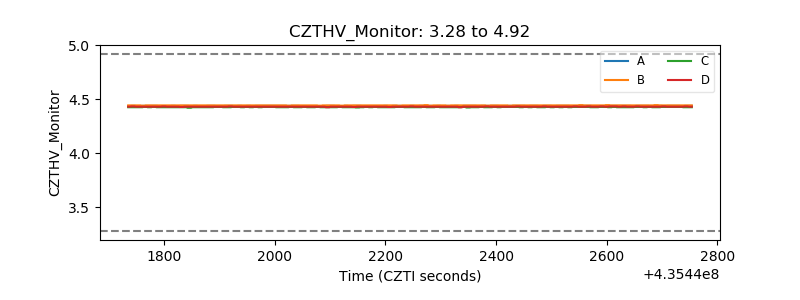 |
| D_VDD | 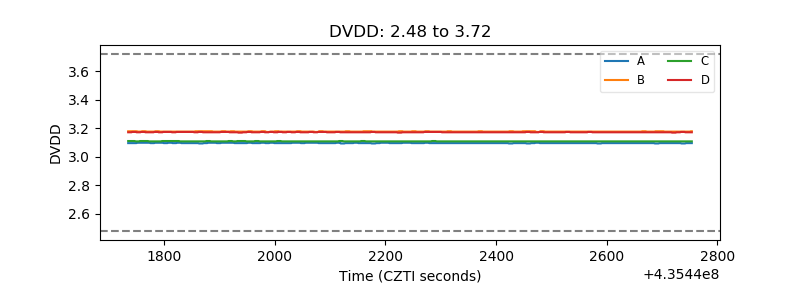 |
| Temperature 1 | 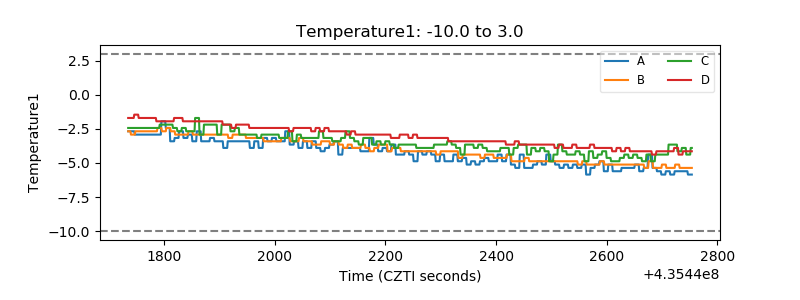 |
| Veto HV Monitor |  |
| Veto LLD | 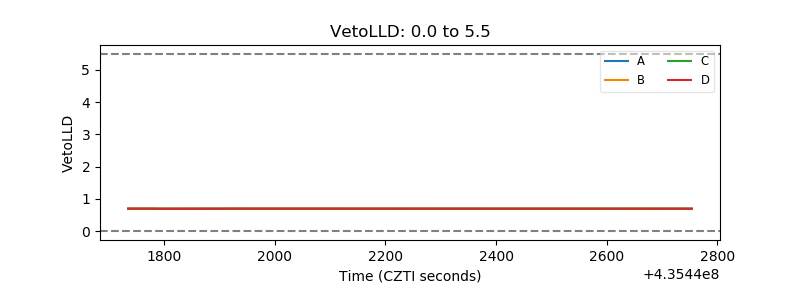 |
| Alpha Counter | 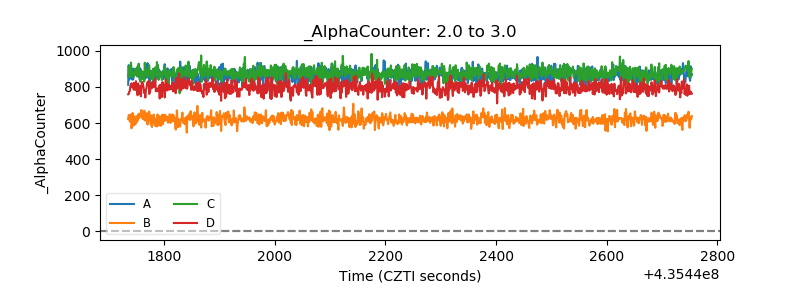 |
| _CPM_Rate | 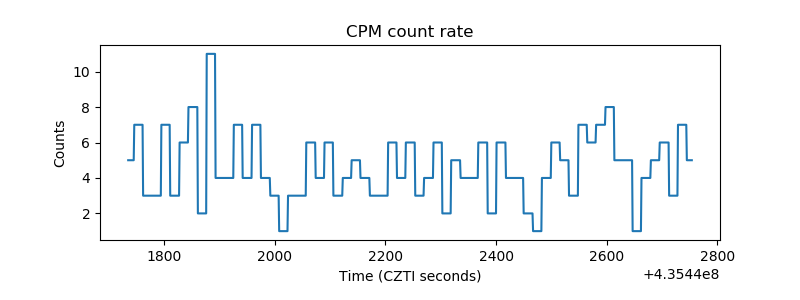 |
| CZT Counter | 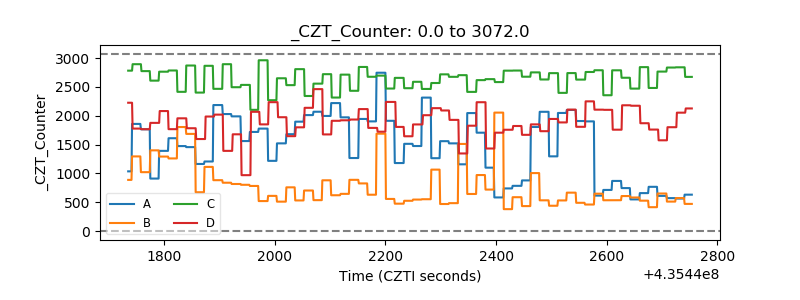 |
| +2.5 Volts monitor | 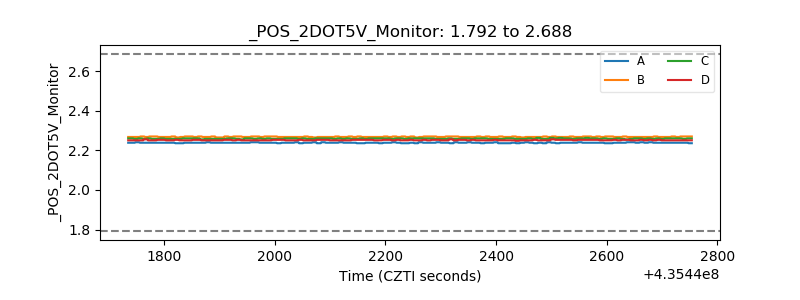 |
| +5 Volts monitor | 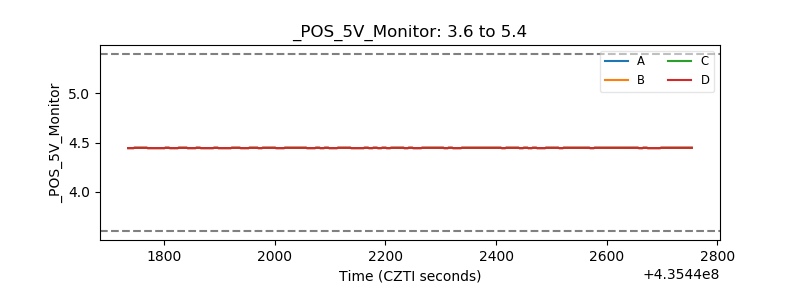 |
| _ROLL_ROT | 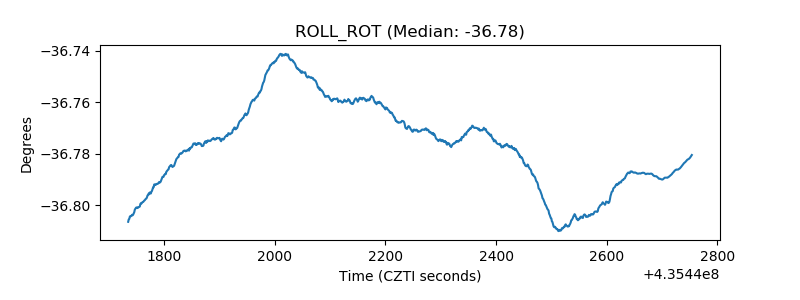 |
| _Roll_DEC | 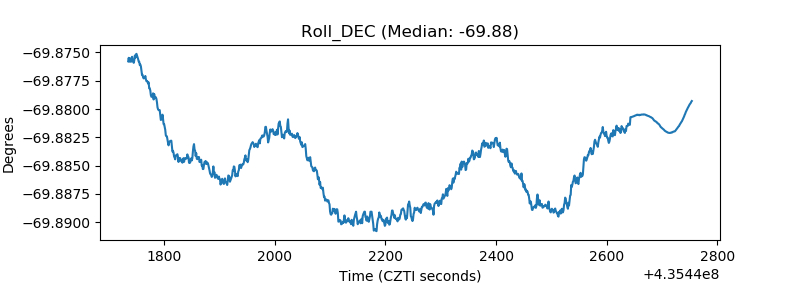 |
| _Roll_RA | 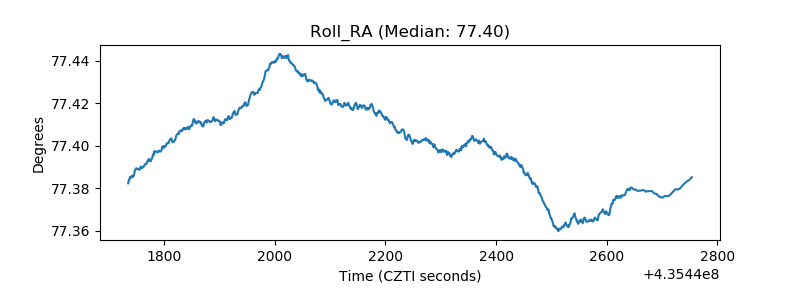 |
| Veto Counter | 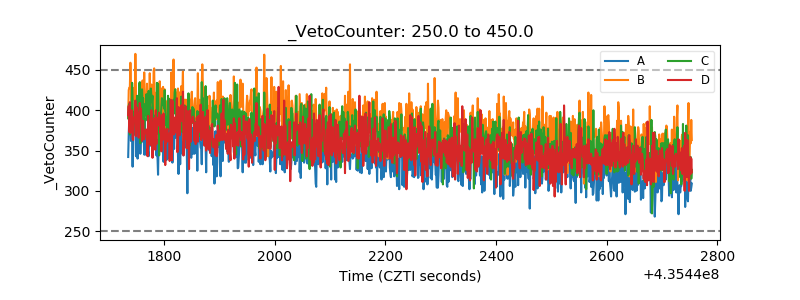 |