| Param | Original file | Final file |
|---|---|---|
| Filename | modeM0/AS1A10_094T37_9000005884_43579cztM0_level2.fits | modeM0/AS1A10_094T37_9000005884_43579cztM0_level2_quad_clean.evt |
| Size (bytes) | 1,265,405,760 | 83,891,520 |
| Size | 1.2 GB | 80.0 MB |
| Events in quadrant A | 6,969,515 | 792,090 |
| Events in quadrant B | 4,792,323 | 820,658 |
| Events in quadrant C | 19,714,749 | 264,538 |
| Events in quadrant D | 14,786,063 | 134,283 |
| Mode M9 | |||
|---|---|---|---|
| Quadrant | BADHDUFLAG | Total packets | Discarded packets |
| A | 0 | 3 | 0 |
| B | 0 | 3 | 0 |
| C | 0 | 3 | 0 |
| D | 0 | 3 | 0 |
| Mode M0 | |||
|---|---|---|---|
| Quadrant | BADHDUFLAG | Total packets | Discarded packets |
| A | 0 | 26097 | 1 |
| B | 0 | 19381 | 2 |
| C | 0 | 63758 | 1 |
| D | 0 | 49071 | 1 |
| Mode SS | |||
|---|---|---|---|
| Quadrant | BADHDUFLAG | Total packets | Discarded packets |
| A | 0 | 152 | 0 |
| B | 0 | 152 | 0 |
| C | 0 | 152 | 0 |
| D | 0 | 152 | 0 |
| Quadrant | Total seconds | Saturated seconds | Saturation percentage |
|---|---|---|---|
| A | 7484 | 638 | 8.524853% |
| B | 7484 | 403 | 5.384821% |
| C | 7484 | 7427 | 99.238375% |
| D | 7484 | 7483 | 99.986638% |
Noise dominated data is calculated using 1-second bins in cleaned event files. If a bin has >2000 counts, and if more than 50% of those come from <1% of pixels, then it is considered to be noise-dominated and hence unusable.
| Quadrant | # 1 sec bins | Bins with >0 counts | Bins with >2000 counts | High rate bins dominated by noise | Noise dominated (total time) | Noise dominated (detector-on time) | Marked lightcurve |
|---|---|---|---|---|---|---|---|
| A | 7784 | 7485 | 370 | 370 | 4.75% | 4.94% | 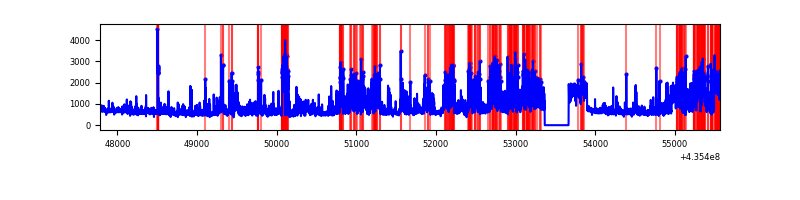 |
| B | 7784 | 7485 | 104 | 104 | 1.34% | 1.39% | 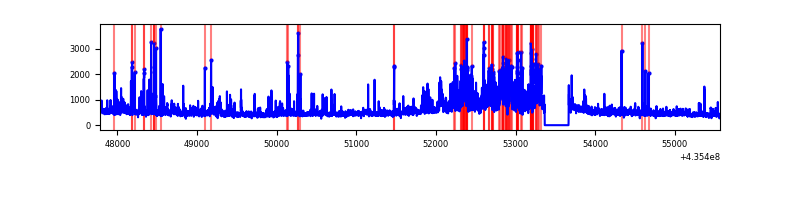 |
| C | 7783 | 7483 | 7288 | 7288 | 93.64% | 97.39% | 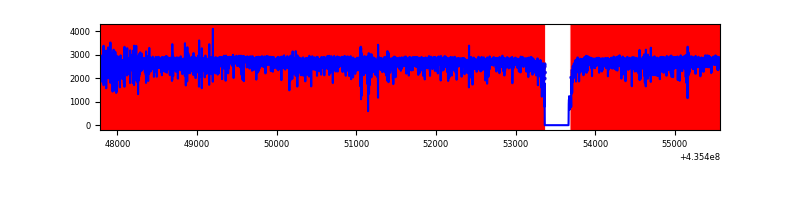 |
| D | 7783 | 7483 | 3784 | 3784 | 48.62% | 50.57% | 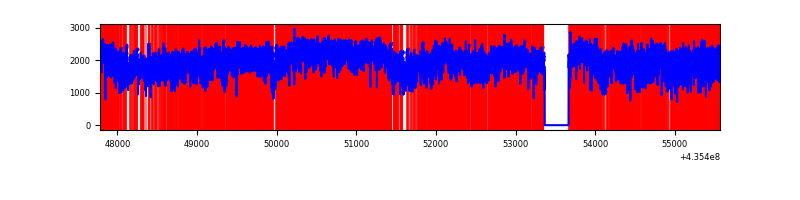 |
Top three noisy pixels from each quadrant. If the there are fewer than three noisy pixels in the level2.evt file, extra rows are filled as -1
| Pixel properties | Quadrant properties | ||||||
|---|---|---|---|---|---|---|---|
| Quadrant | DetID | PixID | Counts | Sigma | Mean | Median | Sigma |
| A | 10 | 99 | 1536927 | 9272.8 | 795 | 780 | 165.7 |
| A | 10 | 83 | 827194 | 4988.57 | 795 | 780 | 165.7 |
| A | 15 | 222 | 667646 | 4025.47 | 795 | 780 | 165.7 |
| B | 4 | 206 | 486551 | 3128.82 | 809 | 785 | 155.3 |
| B | 0 | 219 | 375881 | 2416.0 | 809 | 785 | 155.3 |
| B | 0 | 199 | 132757 | 850.03 | 809 | 785 | 155.3 |
| C | 15 | 174 | 12791080 | 193057.5 | 277 | 278 | 66.3 |
| C | 15 | 142 | 4368186 | 65926.86 | 277 | 278 | 66.3 |
| C | 15 | 158 | 936009 | 14123.42 | 277 | 278 | 66.3 |
| D | 4 | 212 | 6466229 | 106584.71 | 169 | 159 | 60.7 |
| D | 4 | 216 | 3727586 | 61441.76 | 169 | 159 | 60.7 |
| D | 13 | 187 | 405499 | 6681.5 | 169 | 159 | 60.7 |
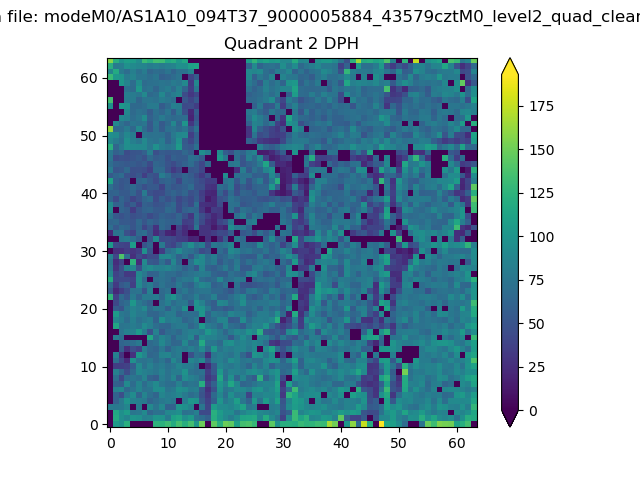
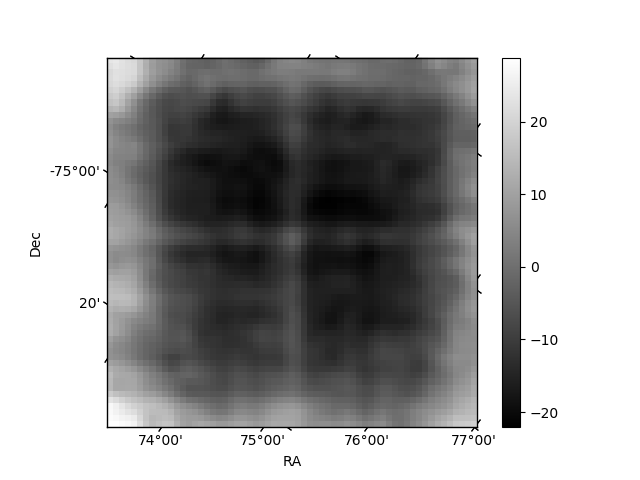
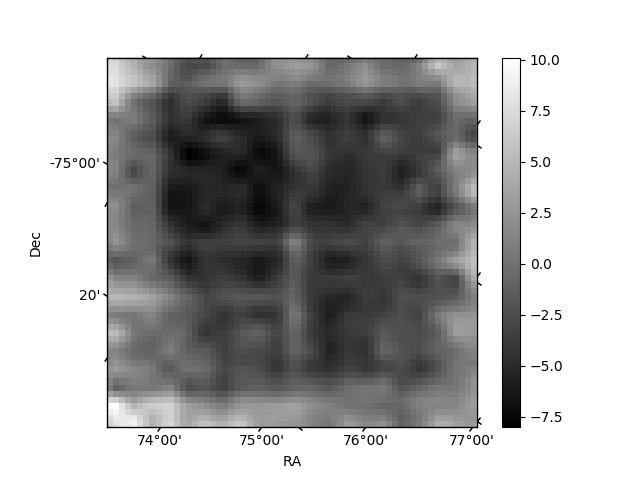
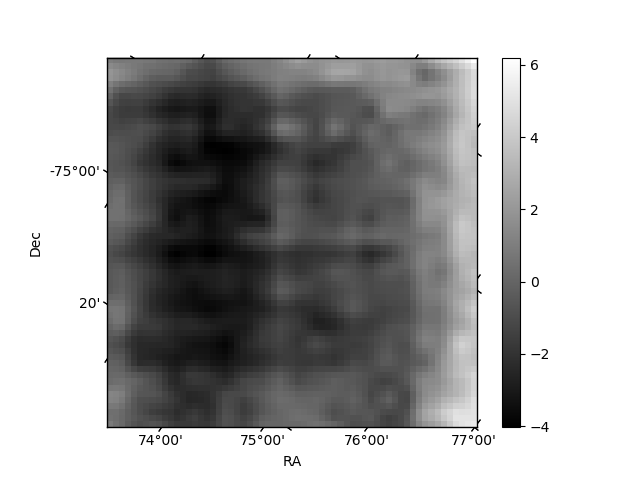
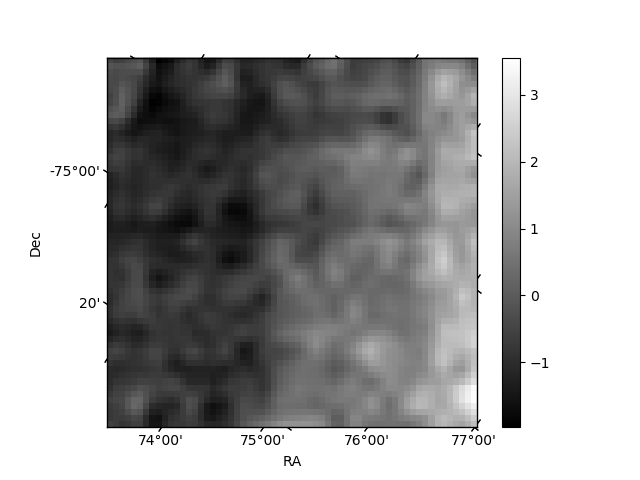
Histogram calculated using DETX and DETY for each event in the final _common_clean file
| Quadrant A | 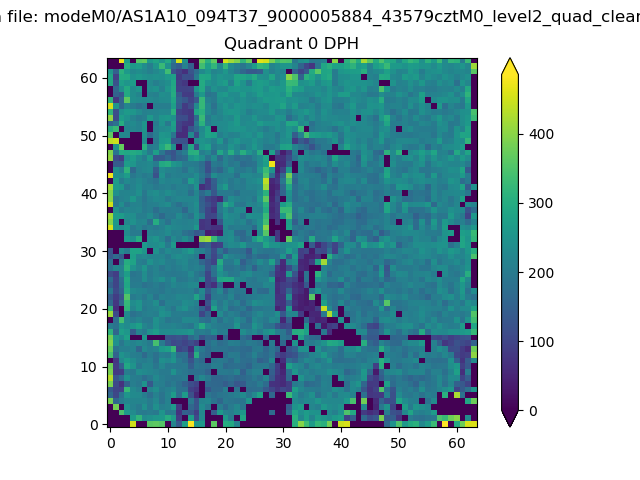 |
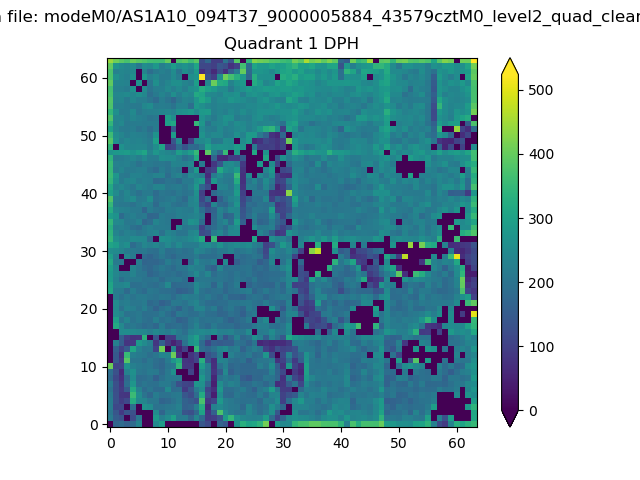 |
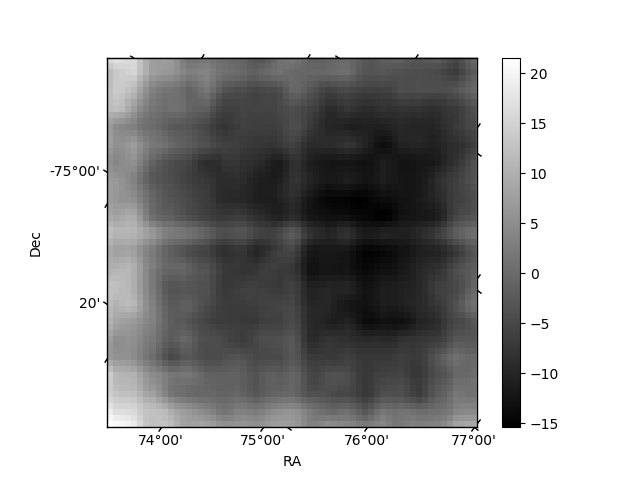
Quadrant B |
|---|---|---|---|
| Quadrant D | 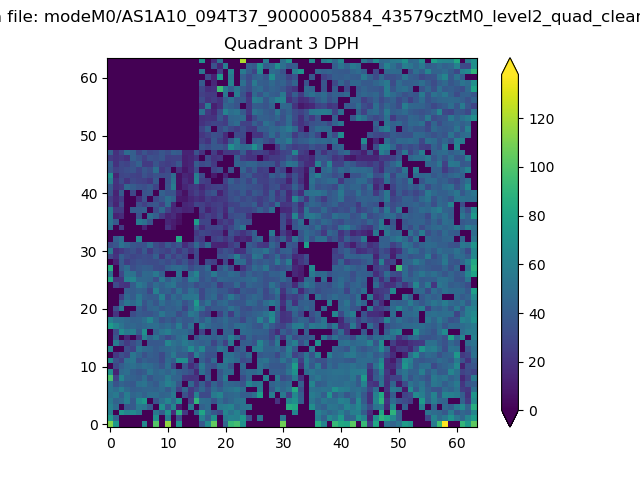 |
 |
Quadrant C |
| Plot type | Count rate plots | Images |
|---|---|---|
| Comparison with Poisson distribution Blue bars denote a histogram of data divided into 1 sec bins. Red curve is a Poisson curve with rate = median count rate of data. |
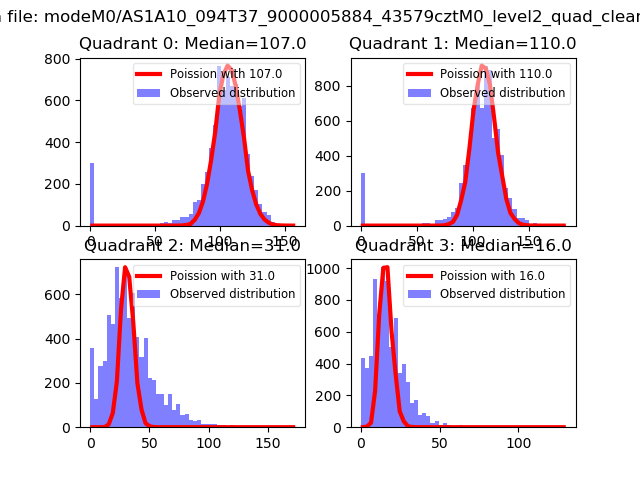 |
 |
| Quadrant-wise count rates Data is divided into 100 sec bins |
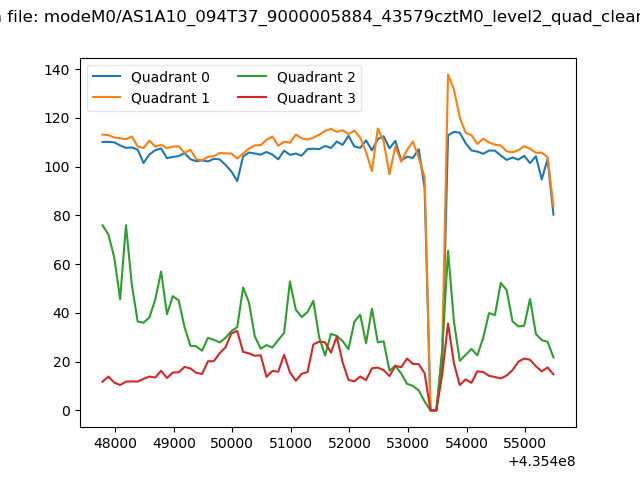 |
|
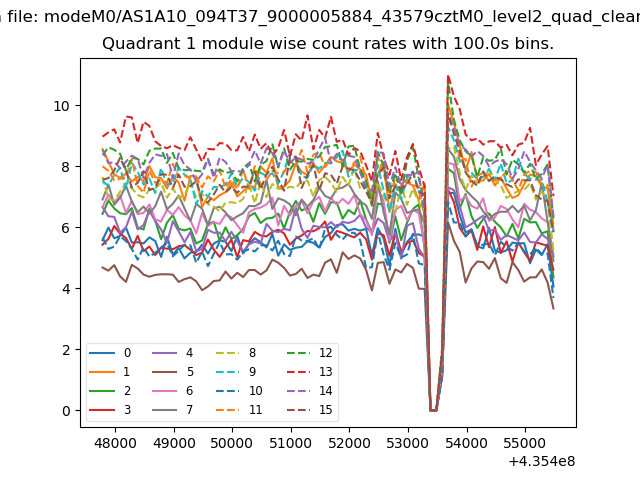
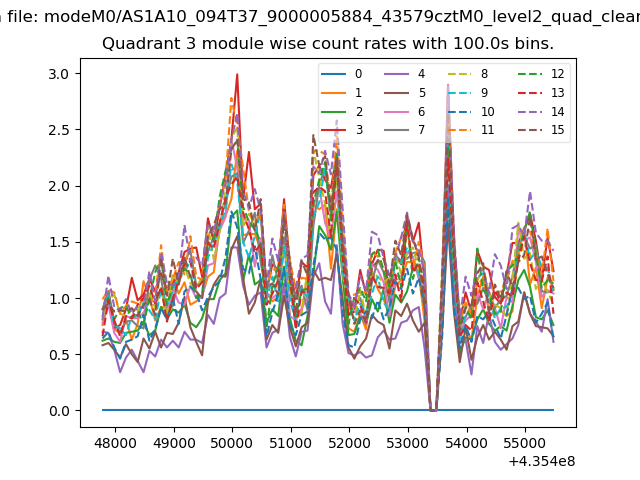
| Module-wise count rates for Quadrant A Data is divided into 100 sec bins |
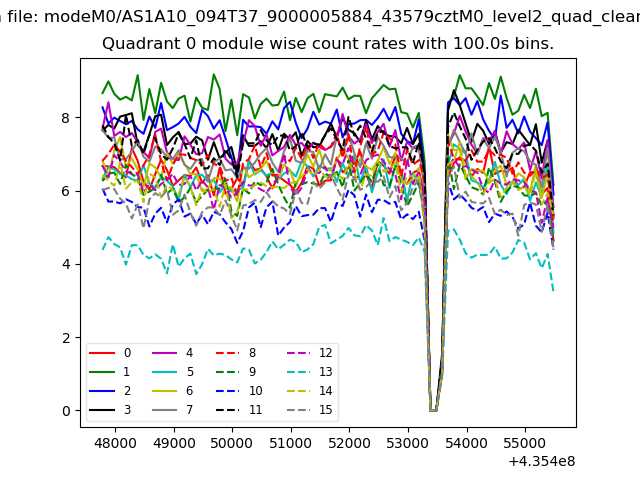 |
 |
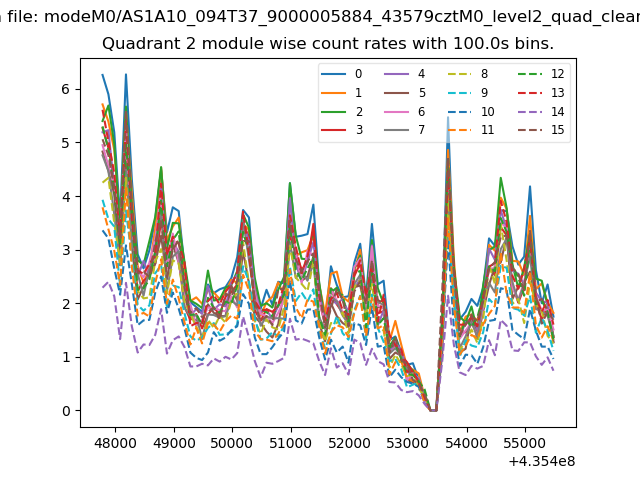
| Module-wise count rates for Quadrant B Data is divided into 100 sec bins |
 |
 |
| Module-wise count rates for Quadrant C Data is divided into 100 sec bins |
 |
 |
| Module-wise count rates for Quadrant D Data is divided into 100 sec bins |
 |
 |
| Parameter | Plot |
|---|---|
| CZT HV Monitor | 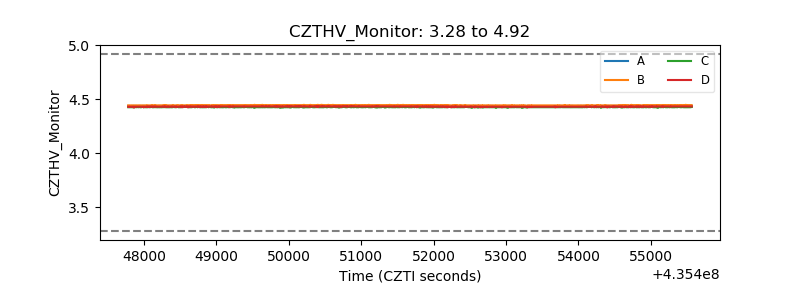 |
| D_VDD | 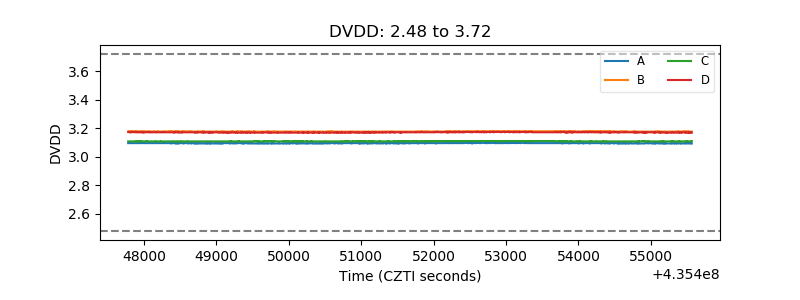 |
| Temperature 1 | 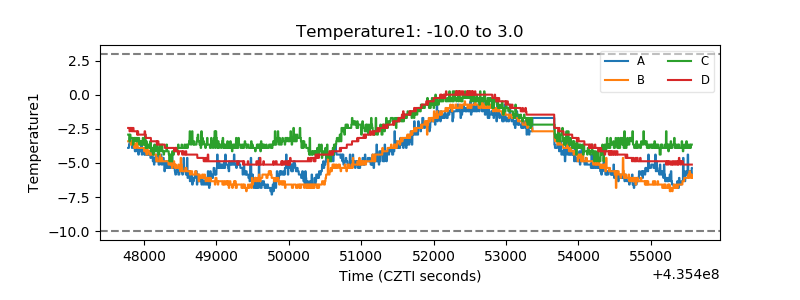 |
| Veto HV Monitor | 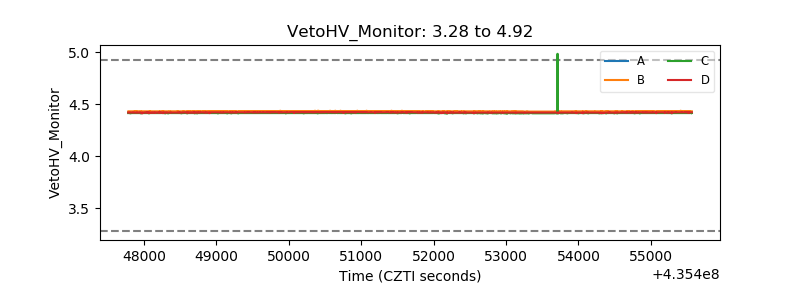 |
| Veto LLD | 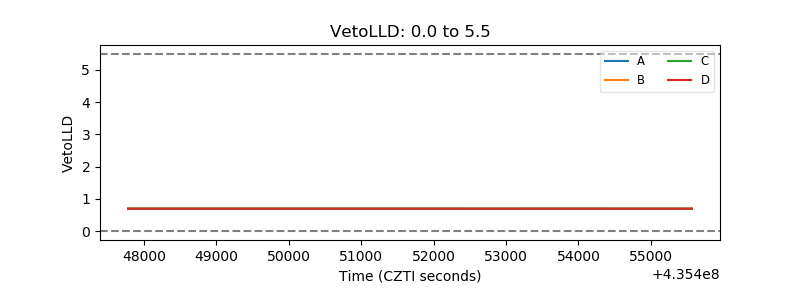 |
| Alpha Counter | 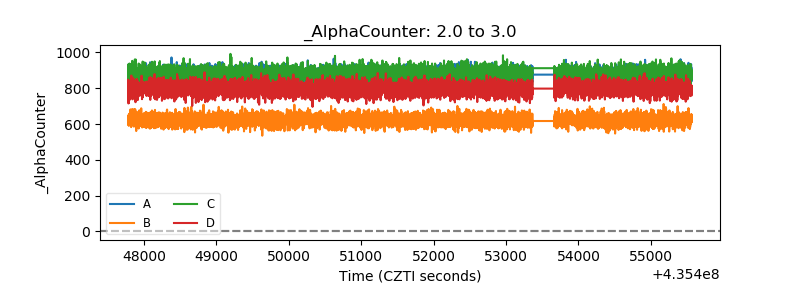 |
| _CPM_Rate | 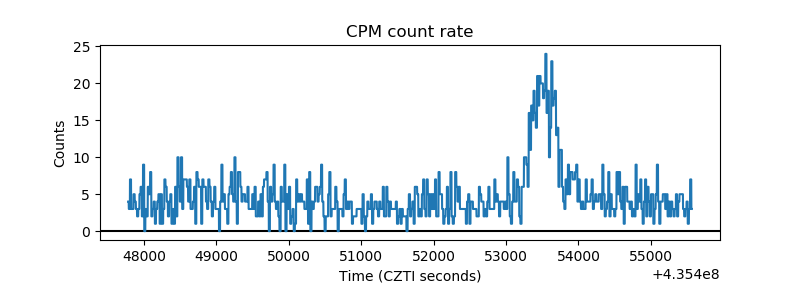 |
| CZT Counter | 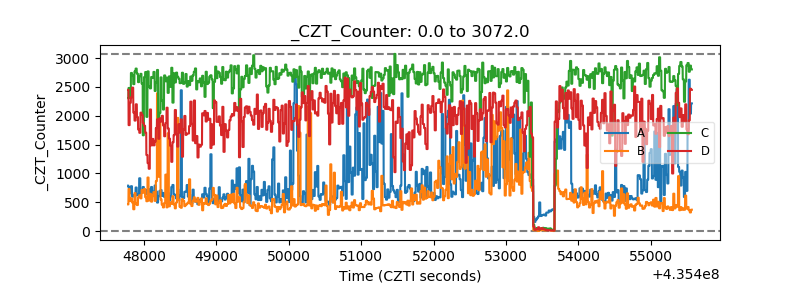 |
| +2.5 Volts monitor | 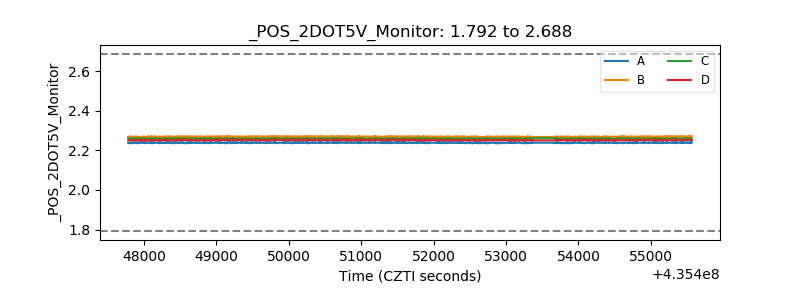 |
| +5 Volts monitor | 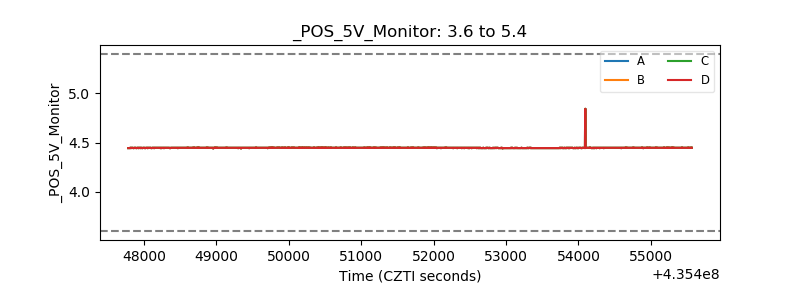 |
| _ROLL_ROT | 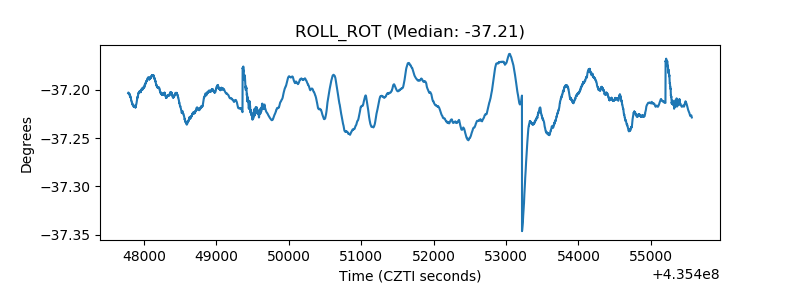 |
| _Roll_DEC | 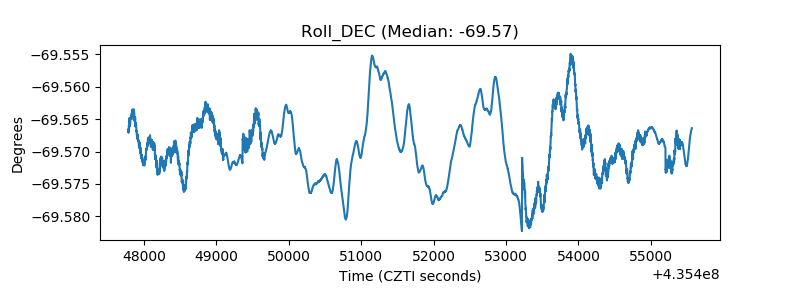 |
| _Roll_RA | 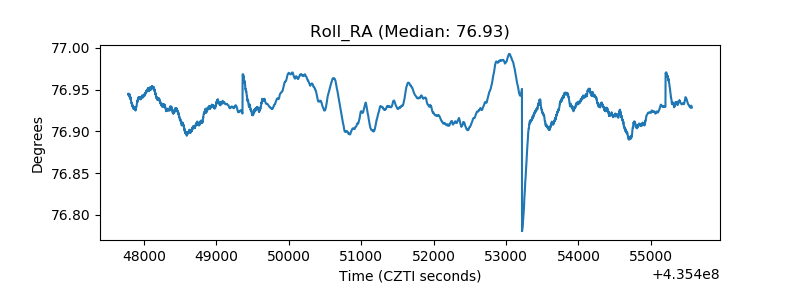 |
| Veto Counter | 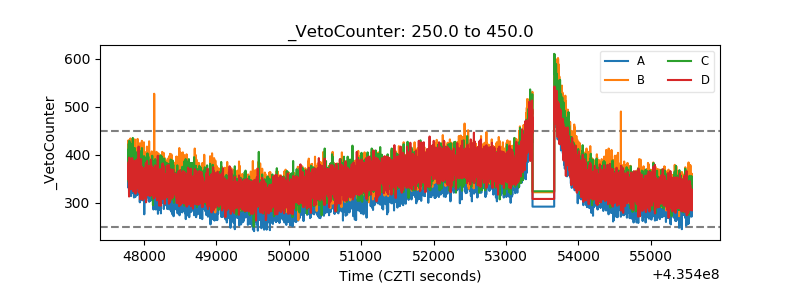 |