| Param | Original file | Final file |
|---|---|---|
| Filename | modeM0/AS1A10_094T27_9000005886_43584cztM0_level2.fits | modeM0/AS1A10_094T27_9000005886_43584cztM0_level2_quad_clean.evt |
| Size (bytes) | 36,334,080 | 1,912,320 |
| Size | 34.7 MB | 1.8 MB |
| Events in quadrant A | 171,809 | 16,861 |
| Events in quadrant B | 182,354 | 16,120 |
| Events in quadrant C | 493,802 | 725 |
| Events in quadrant D | 477,082 | 1,226 |
| Mode M9 | |||
|---|---|---|---|
| Quadrant | BADHDUFLAG | Total packets | Discarded packets |
| A | 1 | 140513674655784 | 140509855088686 |
| B | 1 | -1 | -1 |
| C | 1 | -1 | -1 |
| D | 1 | -1 | -1 |
| Mode M0 | |||
|---|---|---|---|
| Quadrant | BADHDUFLAG | Total packets | Discarded packets |
| A | 0 | 926 | 266 |
| B | 0 | 1034 | 356 |
| C | 0 | 2495 | 887 |
| D | 0 | 2426 | 872 |
| Mode SS | |||
|---|---|---|---|
| Quadrant | BADHDUFLAG | Total packets | Discarded packets |
| A | 0 | 5 | 1 |
| B | 0 | 6 | 2 |
| C | 0 | 4 | 0 |
| D | 0 | 5 | 1 |
| Quadrant | Total seconds | Saturated seconds | Saturation percentage |
|---|---|---|---|
| A | 220 | 1 | 0.454545% |
| B | 217 | 30 | 13.824885% |
| C | 204 | 190 | 93.137255% |
| D | 199 | 192 | 96.482412% |
Noise dominated data is calculated using 1-second bins in cleaned event files. If a bin has >2000 counts, and if more than 50% of those come from <1% of pixels, then it is considered to be noise-dominated and hence unusable.
| Quadrant | # 1 sec bins | Bins with >0 counts | Bins with >2000 counts | High rate bins dominated by noise | Noise dominated (total time) | Noise dominated (detector-on time) | Marked lightcurve |
|---|---|---|---|---|---|---|---|
| A | 3078 | 237 | 1 | 1 | 0.03% | 0.42% | 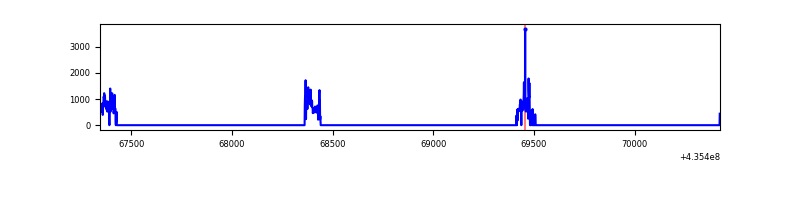 |
| B | 3068 | 230 | 17 | 17 | 0.55% | 7.39% | 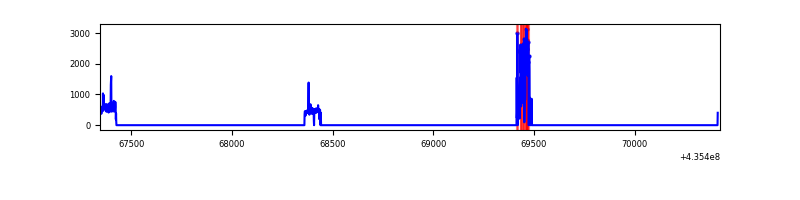 |
| C | 2139 | 208 | 177 | 177 | 8.27% | 85.10% | 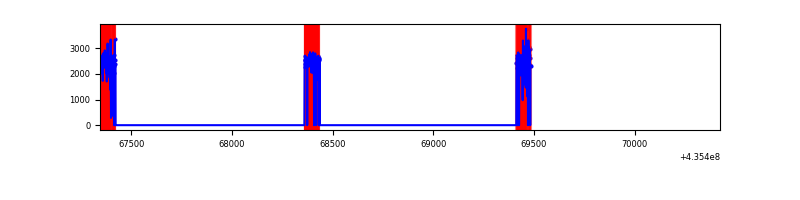 |
| D | 2138 | 199 | 172 | 172 | 8.04% | 86.43% | 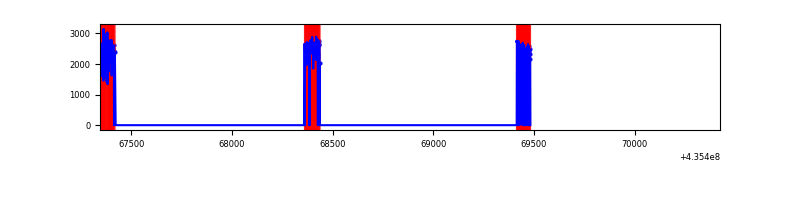 |
Top three noisy pixels from each quadrant. If the there are fewer than three noisy pixels in the level2.evt file, extra rows are filled as -1
| Pixel properties | Quadrant properties | ||||||
|---|---|---|---|---|---|---|---|
| Quadrant | DetID | PixID | Counts | Sigma | Mean | Median | Sigma |
| A | 10 | 99 | 30963 | 4681.81 | 22 | 21 | 6.6 |
| A | 10 | 83 | 21717 | 3282.8 | 22 | 21 | 6.6 |
| A | 0 | 228 | 11344 | 1713.27 | 22 | 21 | 6.6 |
| B | 4 | 206 | 49257 | 8049.18 | 21 | 20 | 6.1 |
| B | 3 | 25 | 30934 | 5053.77 | 21 | 20 | 6.1 |
| B | 0 | 230 | 5236 | 852.7 | 21 | 20 | 6.1 |
| C | 15 | 142 | 224638 | 59279.02 | 9 | 9 | 3.8 |
| C | 15 | 174 | 154284 | 40712.78 | 9 | 9 | 3.8 |
| C | 15 | 126 | 22547 | 5947.72 | 9 | 9 | 3.8 |
| D | 4 | 216 | 241053 | 70435.79 | 7 | 7 | 3.4 |
| D | 4 | 212 | 50756 | 14829.31 | 7 | 7 | 3.4 |
| D | 13 | 187 | 25890 | 7563.24 | 7 | 7 | 3.4 |
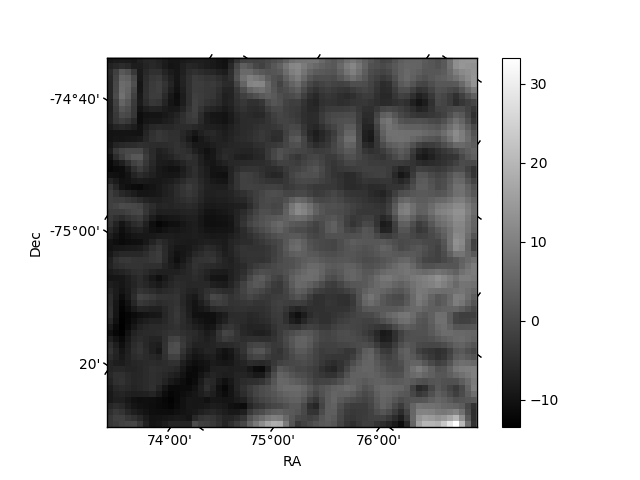
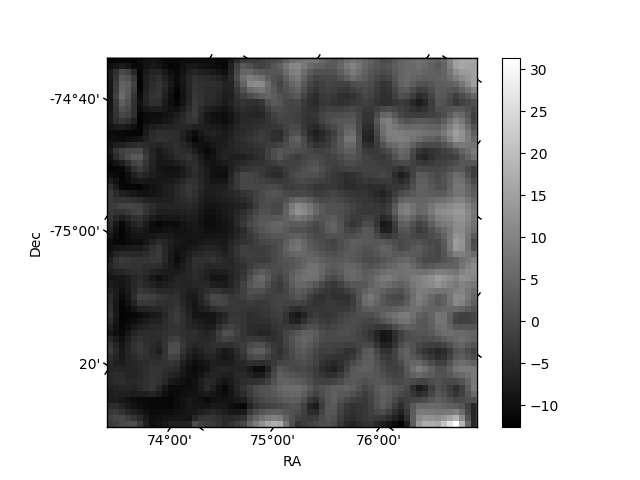
Histogram calculated using DETX and DETY for each event in the final _common_clean file
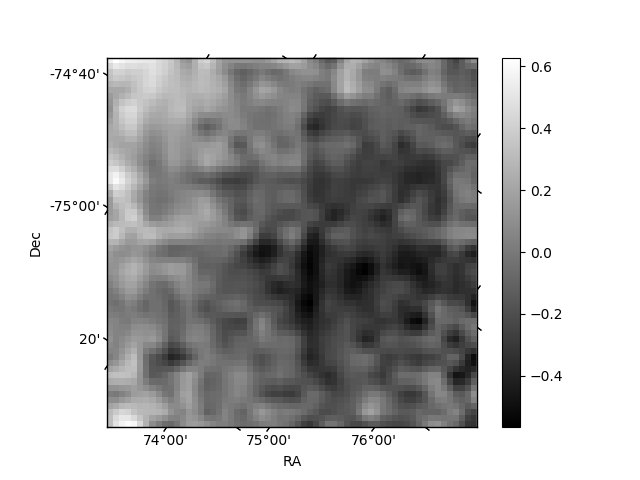
| Quadrant A | 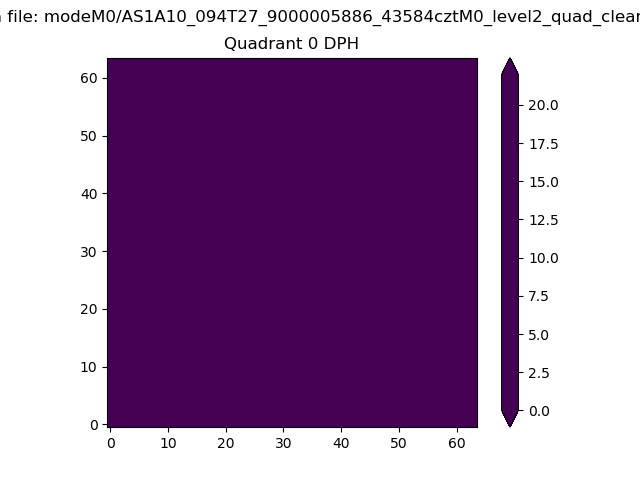 |
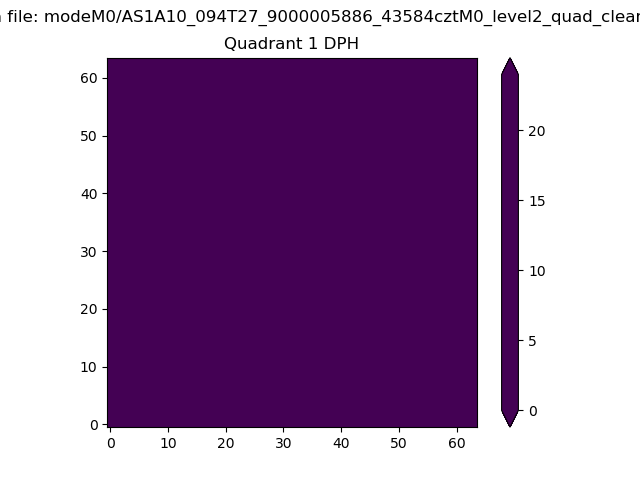 |
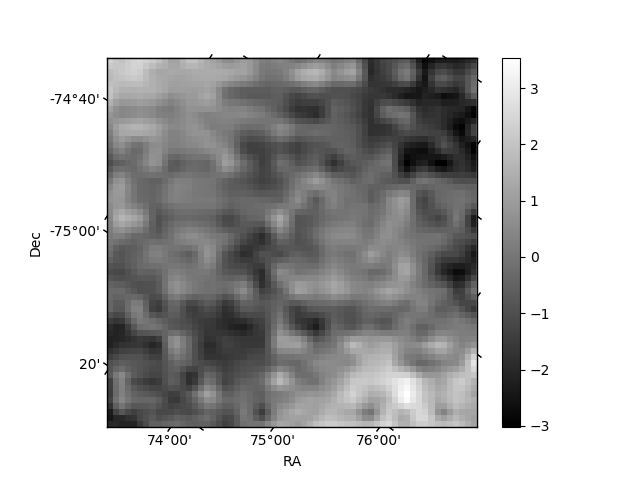
Quadrant B |
|---|---|---|---|
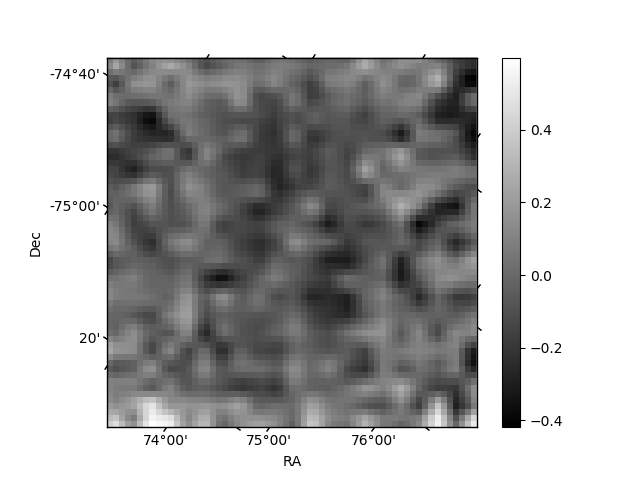
| Quadrant D | 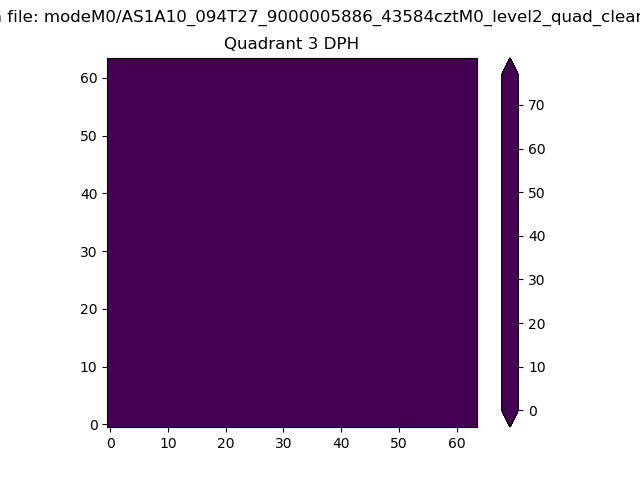 |
 |
Quadrant C |
| Plot type | Count rate plots | Images |
|---|---|---|
| Comparison with Poisson distribution Blue bars denote a histogram of data divided into 1 sec bins. Red curve is a Poisson curve with rate = median count rate of data. |
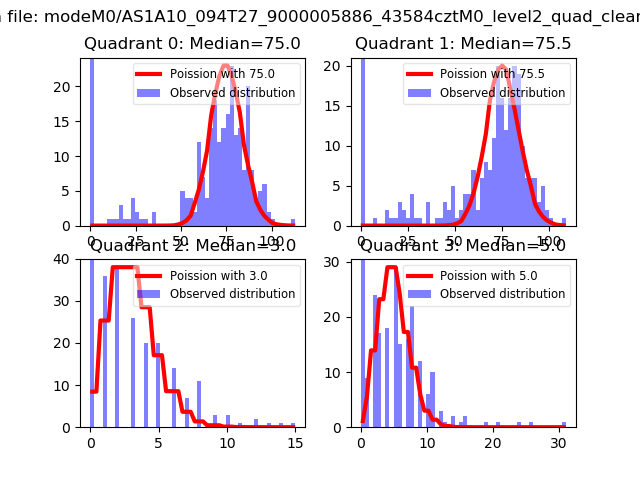 |
 |
| Quadrant-wise count rates Data is divided into 100 sec bins |
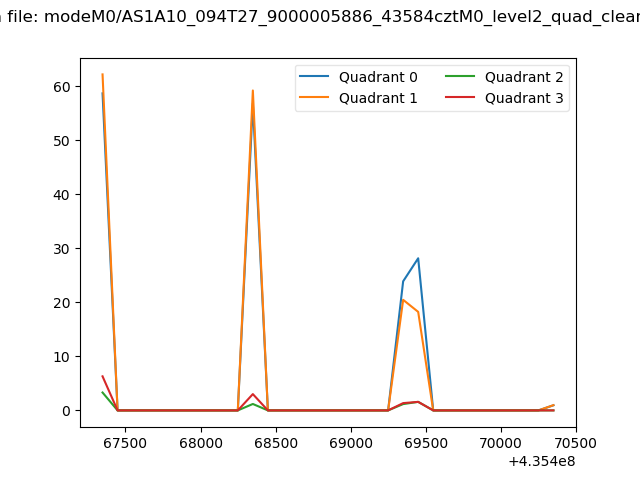 |
|
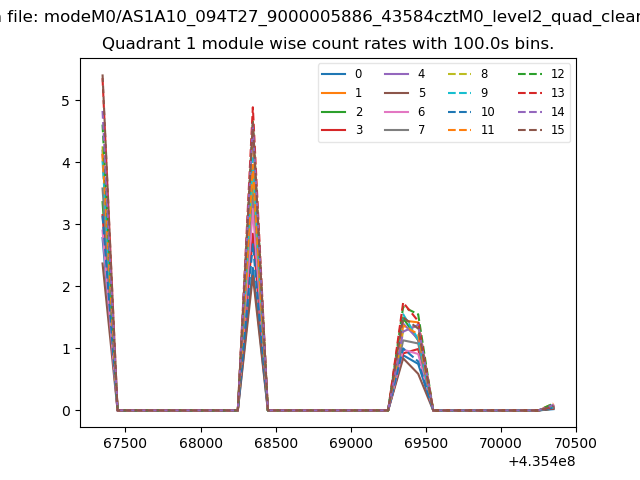
| Module-wise count rates for Quadrant A Data is divided into 100 sec bins |
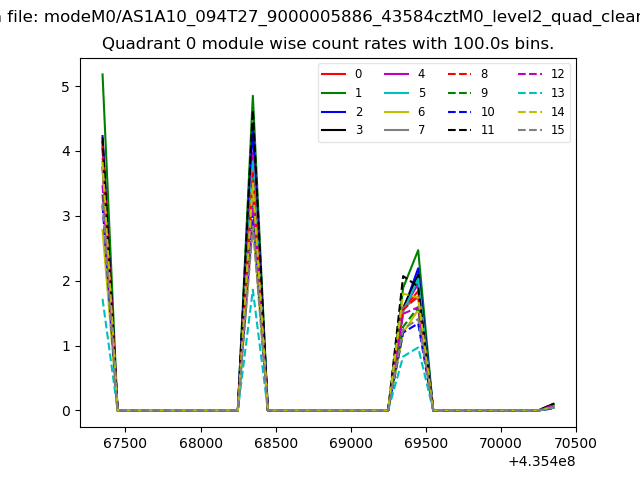 |
 |
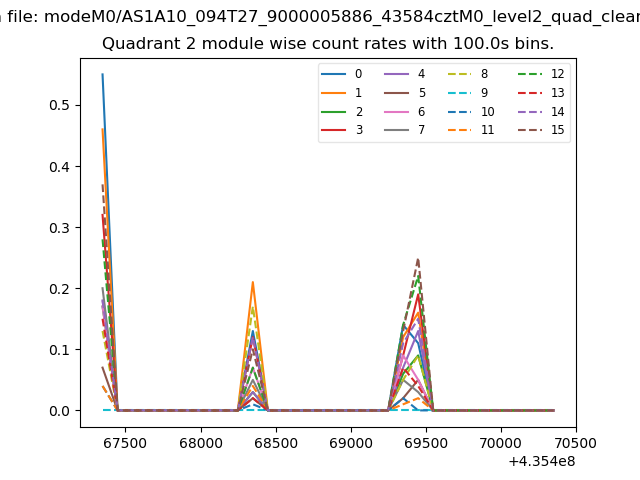
| Module-wise count rates for Quadrant B Data is divided into 100 sec bins |
 |
 |
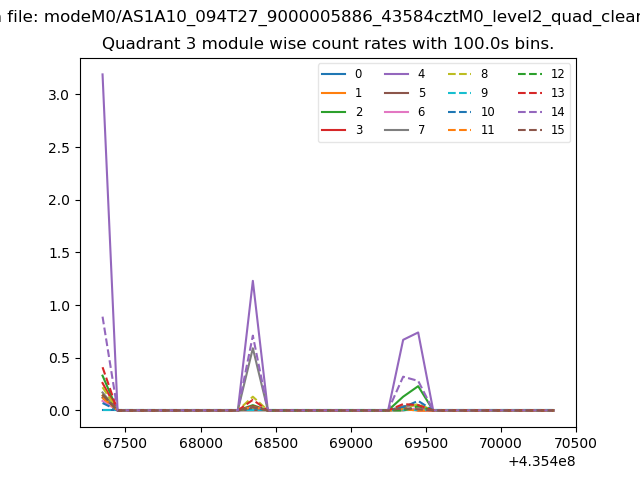
| Module-wise count rates for Quadrant C Data is divided into 100 sec bins |
 |
 |
| Module-wise count rates for Quadrant D Data is divided into 100 sec bins |
 |
 |
| Parameter | Plot |
|---|---|
| CZT HV Monitor | 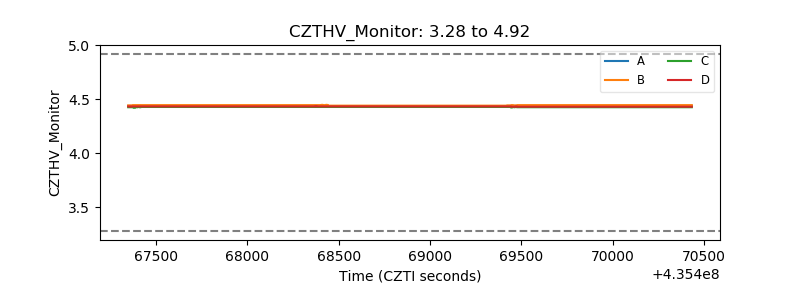 |
| D_VDD | 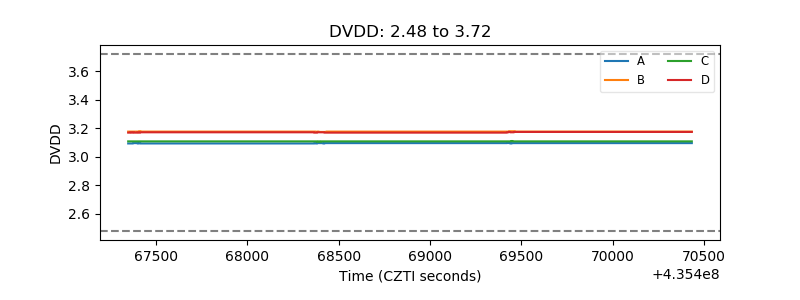 |
| Temperature 1 | 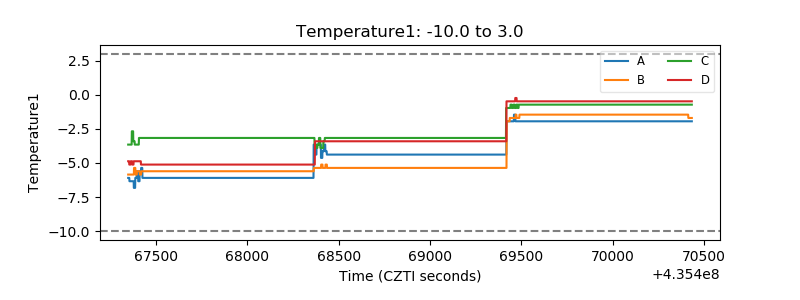 |
| Veto HV Monitor | 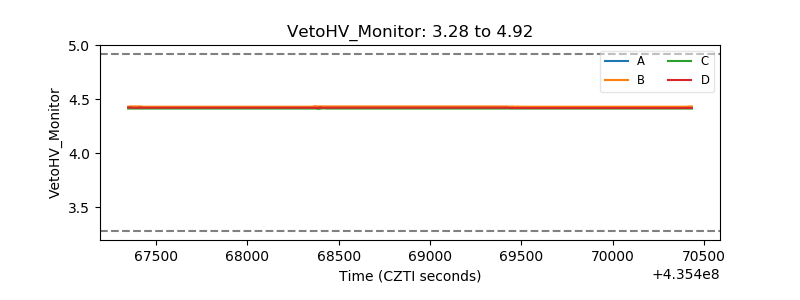 |
| Veto LLD | 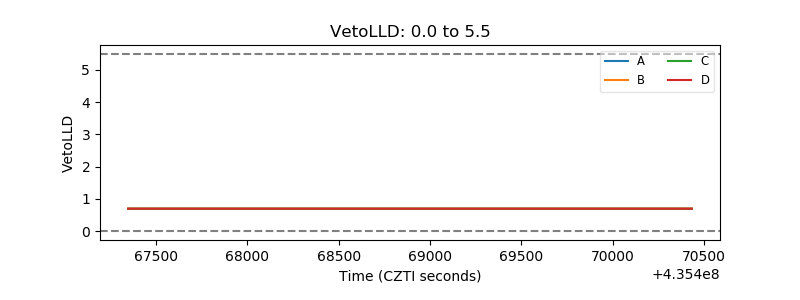 |
| Alpha Counter | 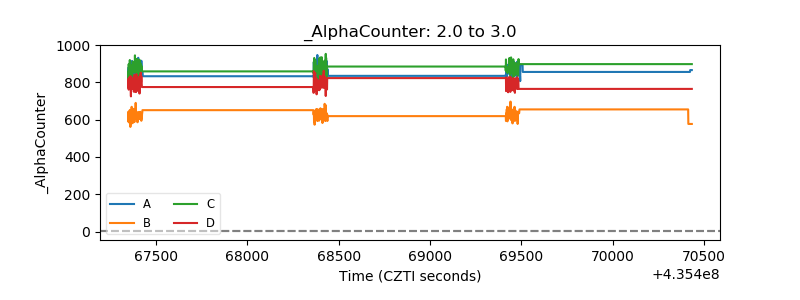 |
| _CPM_Rate | 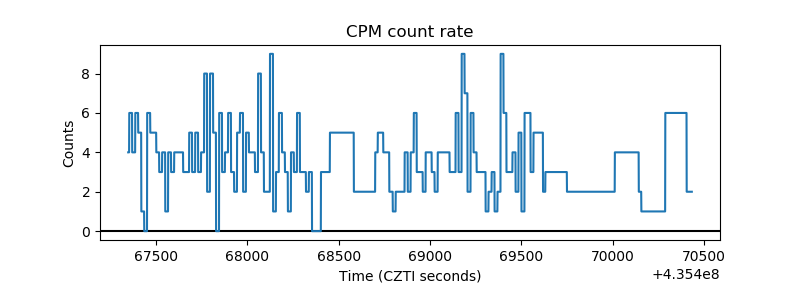 |
| CZT Counter | 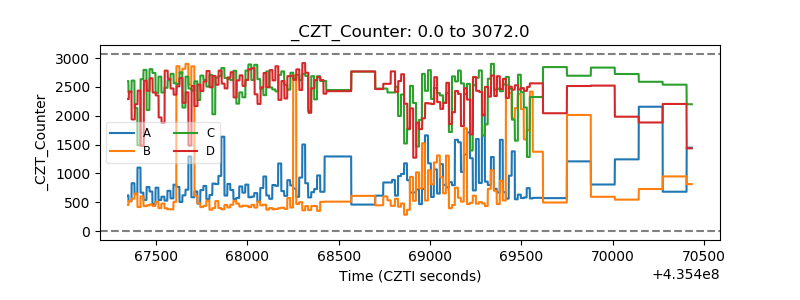 |
| +2.5 Volts monitor | 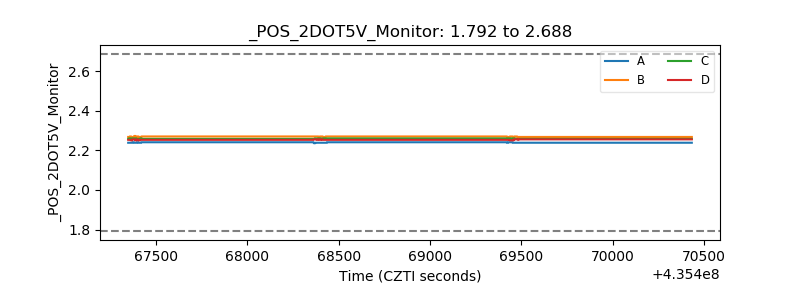 |
| +5 Volts monitor | 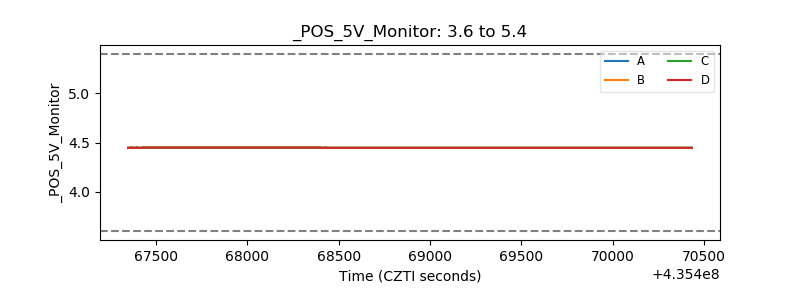 |
| _ROLL_ROT | 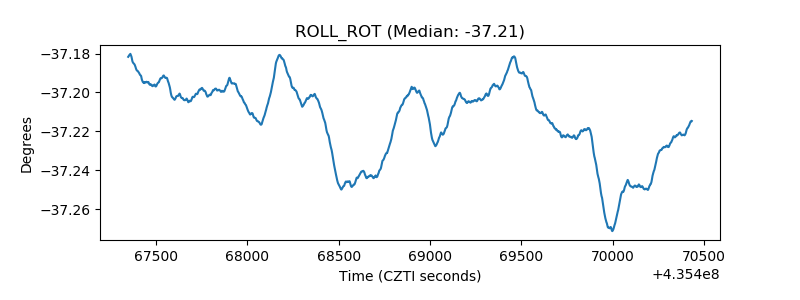 |
| _Roll_DEC | 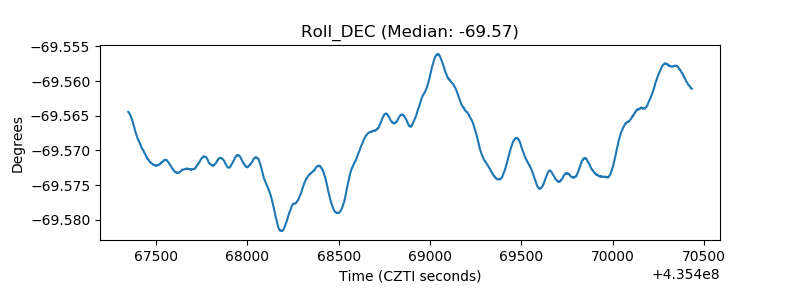 |
| _Roll_RA | 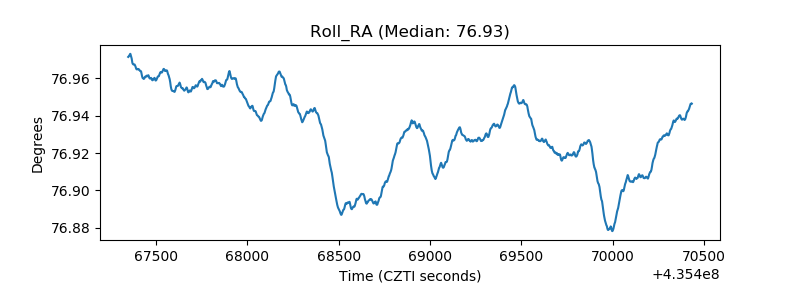 |
| Veto Counter | 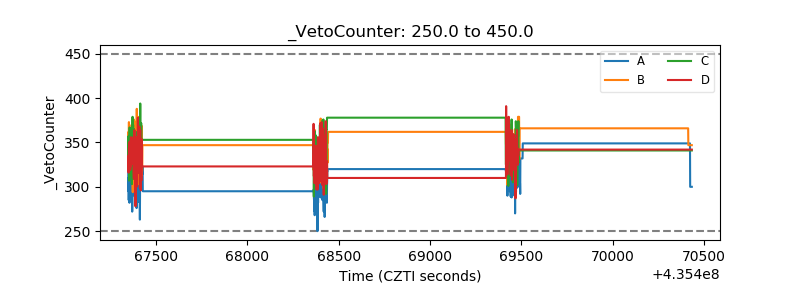 |