| Param | Original file | Final file |
|---|---|---|
| Filename | modeM0/AS1A12_068T04_9000005888_43591cztM0_level2.fits | modeM0/AS1A12_068T04_9000005888_43591cztM0_level2_quad_clean.evt |
| Size (bytes) | 1,003,740,480 | 66,686,400 |
| Size | 957.2 MB | 63.6 MB |
| Events in quadrant A | 4,481,491 | 714,097 |
| Events in quadrant B | 4,282,886 | 719,620 |
| Events in quadrant C | 14,965,551 | 139,407 |
| Events in quadrant D | 12,962,776 | 22,650 |
| Mode M9 | |||
|---|---|---|---|
| Quadrant | BADHDUFLAG | Total packets | Discarded packets |
| A | 0 | 12 | 0 |
| B | 0 | 12 | 0 |
| C | 0 | 12 | 0 |
| D | 0 | 12 | 0 |
| Mode SS | |||
|---|---|---|---|
| Quadrant | BADHDUFLAG | Total packets | Discarded packets |
| A | 0 | 122 | 0 |
| B | 0 | 122 | 0 |
| C | 0 | 122 | 0 |
| D | 0 | 122 | 0 |
| Mode M0 | |||
|---|---|---|---|
| Quadrant | BADHDUFLAG | Total packets | Discarded packets |
| A | 0 | 17673 | 1 |
| B | 0 | 16810 | 2 |
| C | 0 | 48548 | 1 |
| D | 0 | 42571 | 1 |
| Quadrant | Total seconds | Saturated seconds | Saturation percentage |
|---|---|---|---|
| A | 5976 | 164 | 2.744311% |
| B | 5975 | 261 | 4.368201% |
| C | 5975 | 5943 | 99.464435% |
| D | 5975 | 5975 | 100.000000% |
Noise dominated data is calculated using 1-second bins in cleaned event files. If a bin has >2000 counts, and if more than 50% of those come from <1% of pixels, then it is considered to be noise-dominated and hence unusable.
| Quadrant | # 1 sec bins | Bins with >0 counts | Bins with >2000 counts | High rate bins dominated by noise | Noise dominated (total time) | Noise dominated (detector-on time) | Marked lightcurve |
|---|---|---|---|---|---|---|---|
| A | 7141 | 5977 | 33 | 33 | 0.46% | 0.55% | 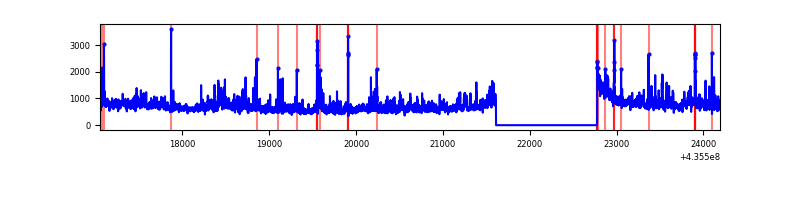 |
| B | 7140 | 5975 | 135 | 135 | 1.89% | 2.26% | 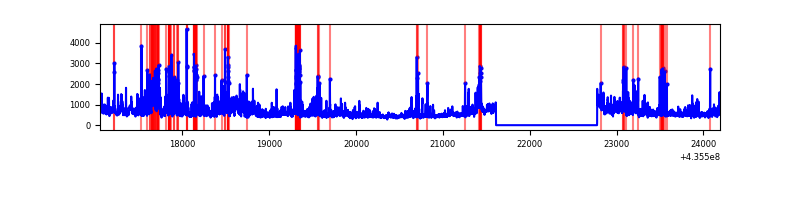 |
| C | 7139 | 5974 | 5366 | 5366 | 75.16% | 89.82% | 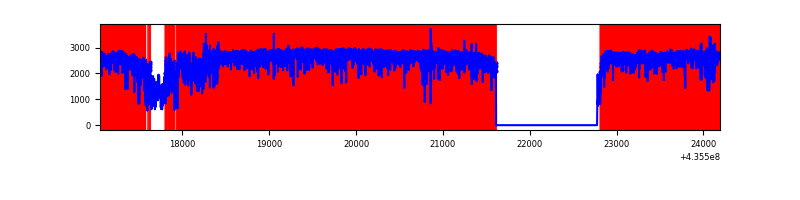 |
| D | 7139 | 5974 | 4172 | 4172 | 58.44% | 69.84% | 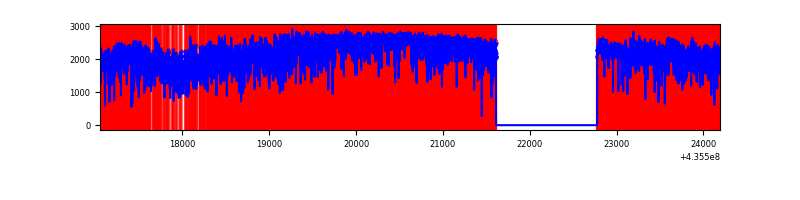 |
Top three noisy pixels from each quadrant. If the there are fewer than three noisy pixels in the level2.evt file, extra rows are filled as -1
| Pixel properties | Quadrant properties | ||||||
|---|---|---|---|---|---|---|---|
| Quadrant | DetID | PixID | Counts | Sigma | Mean | Median | Sigma |
| A | 10 | 83 | 767137 | 5502.34 | 687 | 675 | 139.3 |
| A | 12 | 189 | 338832 | 2427.59 | 687 | 675 | 139.3 |
| A | 15 | 222 | 178840 | 1279.03 | 687 | 675 | 139.3 |
| B | 4 | 206 | 427804 | 3306.54 | 682 | 663 | 129.2 |
| B | 15 | 185 | 283083 | 2186.24 | 682 | 663 | 129.2 |
| B | 5 | 235 | 226944 | 1751.66 | 682 | 663 | 129.2 |
| C | 15 | 142 | 9179979 | 263928.69 | 146 | 147 | 34.8 |
| C | 15 | 174 | 3353525 | 96412.73 | 146 | 147 | 34.8 |
| C | 15 | 158 | 791151 | 22742.1 | 146 | 147 | 34.8 |
| D | 8 | 192 | 9470254 | 621986.58 | 45 | 43 | 15.2 |
| D | 4 | 216 | 1484374 | 97488.21 | 45 | 43 | 15.2 |
| D | 4 | 212 | 846377 | 55585.71 | 45 | 43 | 15.2 |
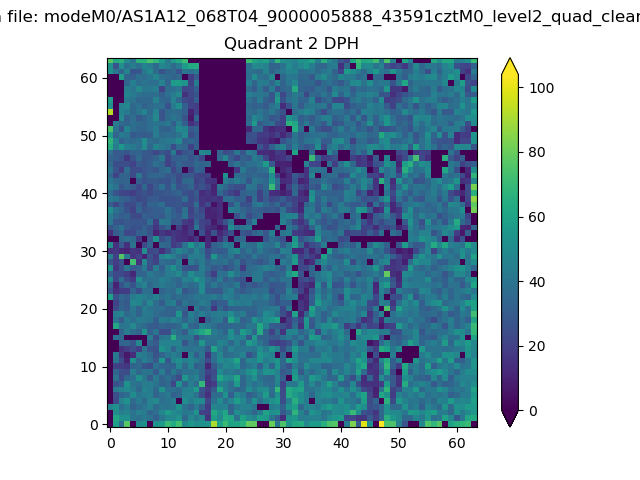
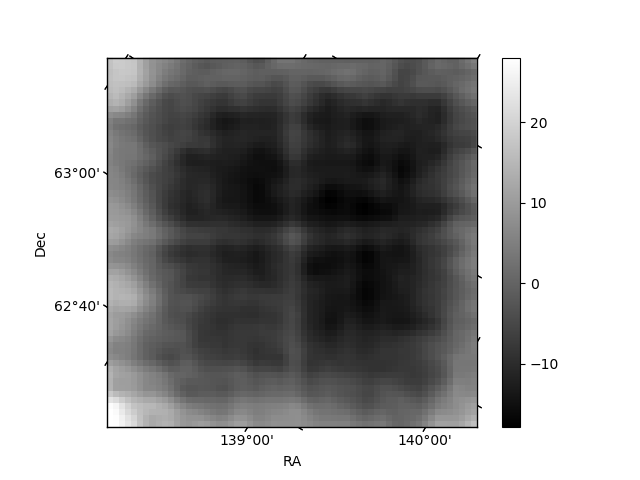
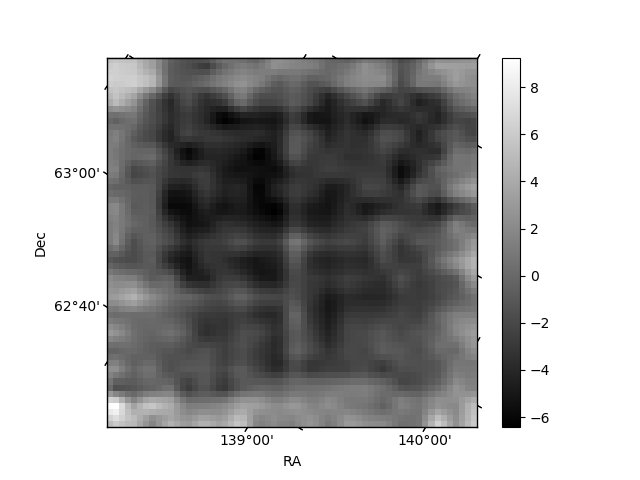
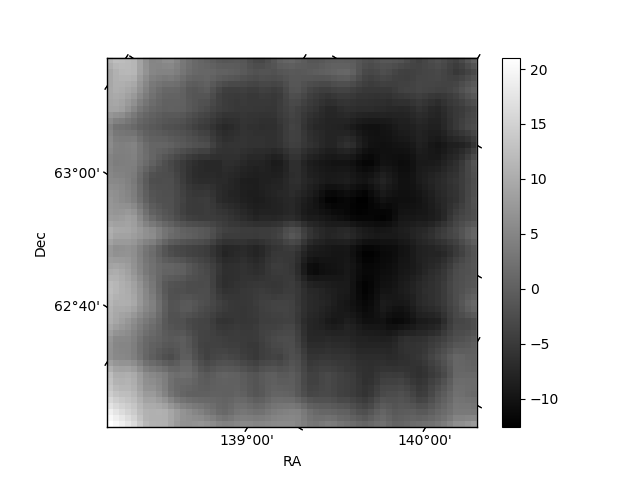
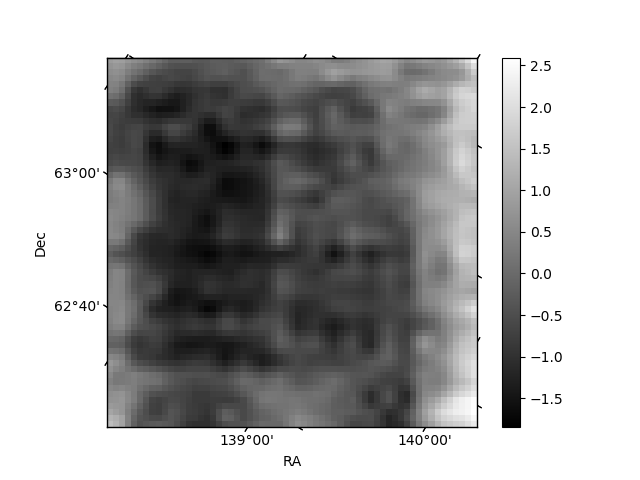
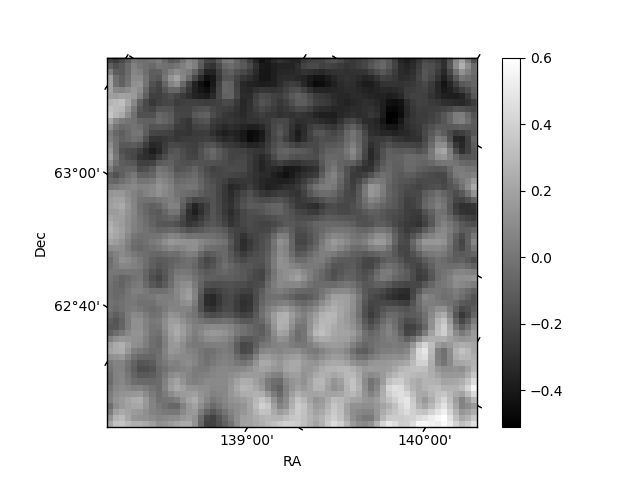
Histogram calculated using DETX and DETY for each event in the final _common_clean file
| Quadrant A | 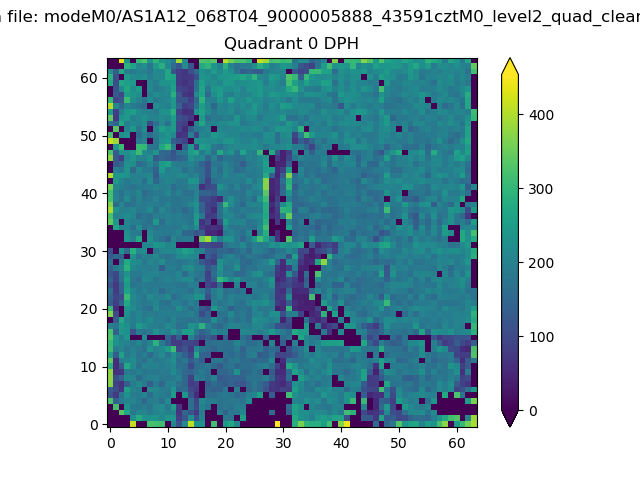 |
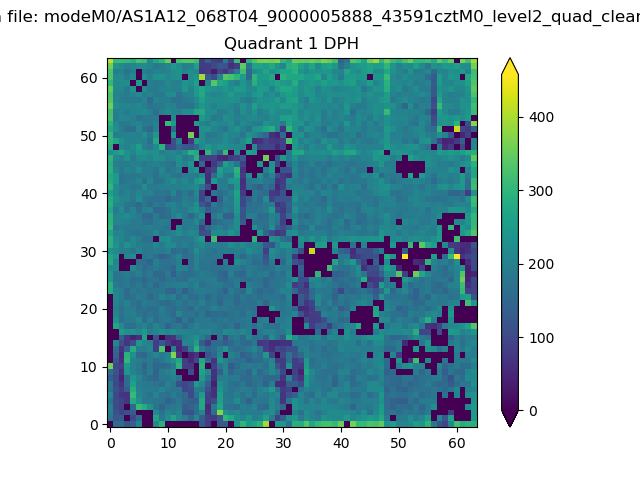 |
Quadrant B |
|---|---|---|---|
| Quadrant D | 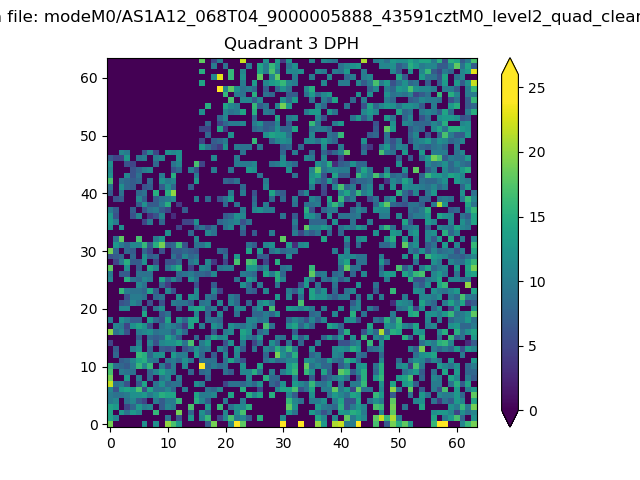 |
 |
Quadrant C |
| Plot type | Count rate plots | Images |
|---|---|---|
| Comparison with Poisson distribution Blue bars denote a histogram of data divided into 1 sec bins. Red curve is a Poisson curve with rate = median count rate of data. |
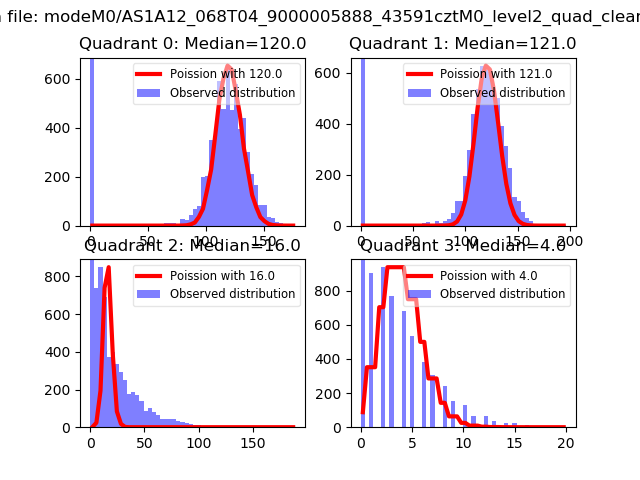 |
 |
| Quadrant-wise count rates Data is divided into 100 sec bins |
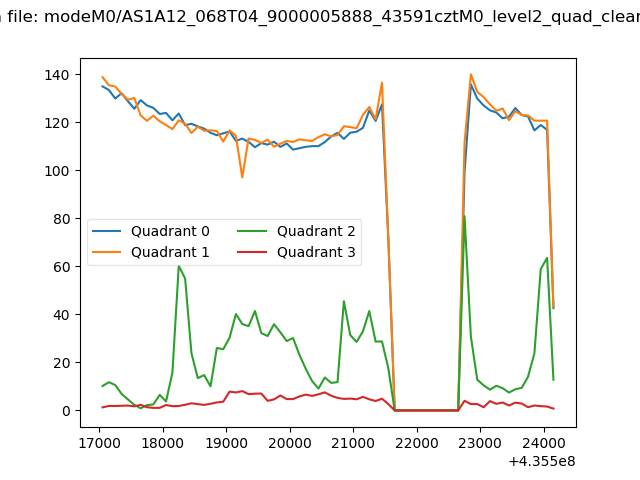 |
|
| Module-wise count rates for Quadrant A Data is divided into 100 sec bins |
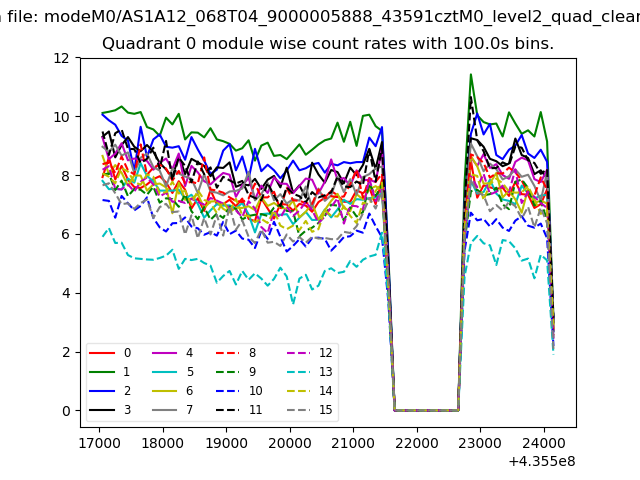 |
 |
| Module-wise count rates for Quadrant B Data is divided into 100 sec bins |
 |
 |
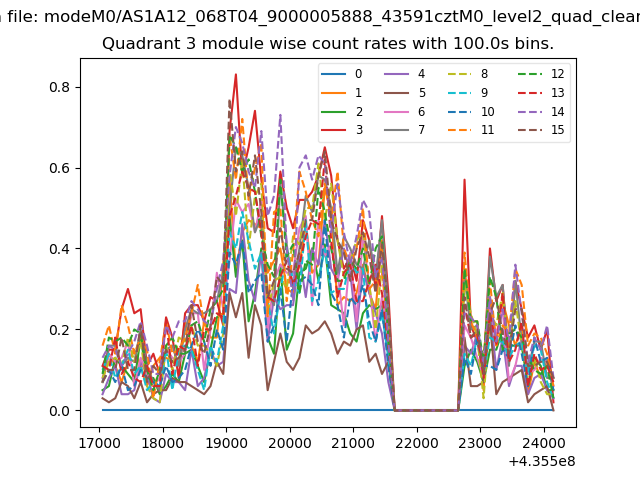
| Module-wise count rates for Quadrant C Data is divided into 100 sec bins |
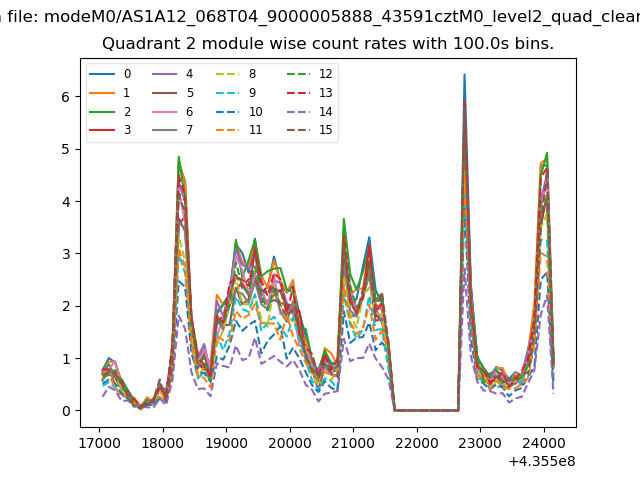 |
 |
| Module-wise count rates for Quadrant D Data is divided into 100 sec bins |
 |
 |
| Parameter | Plot |
|---|---|
| CZT HV Monitor |  |
| D_VDD | 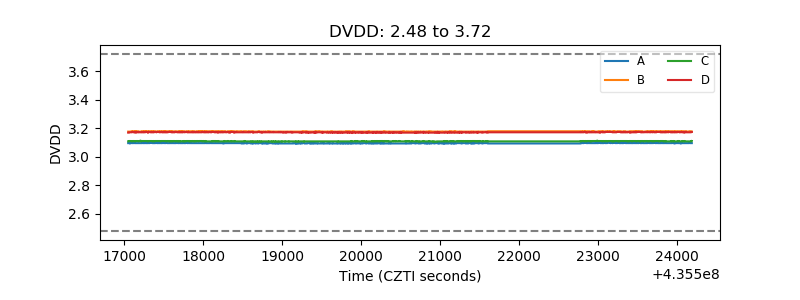 |
| Temperature 1 | 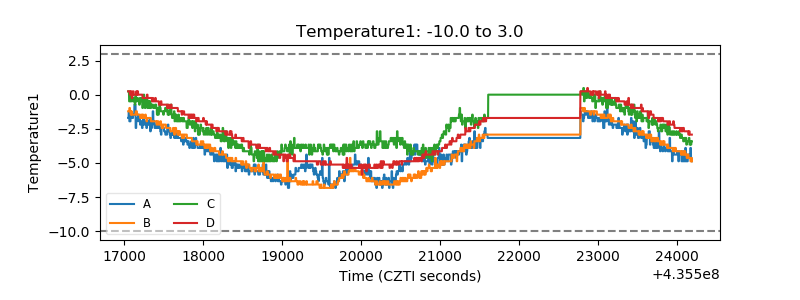 |
| Veto HV Monitor | 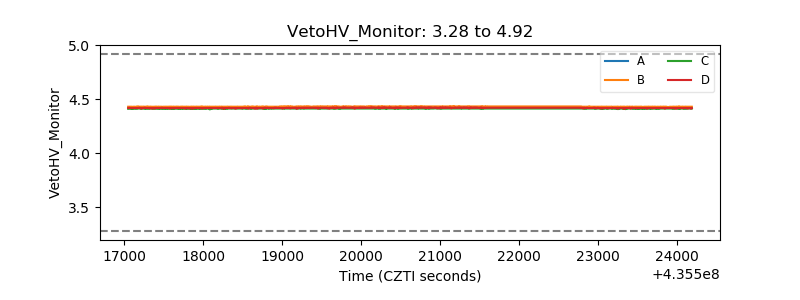 |
| Veto LLD | 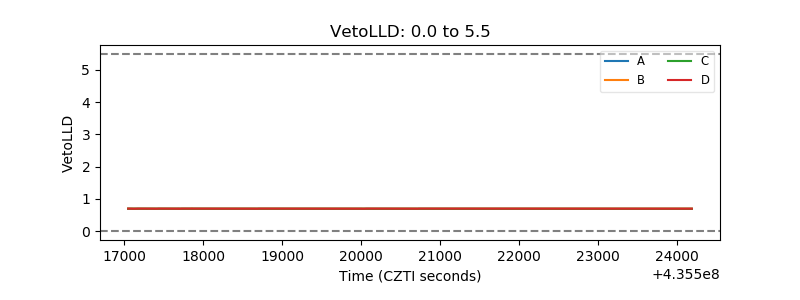 |
| Alpha Counter | 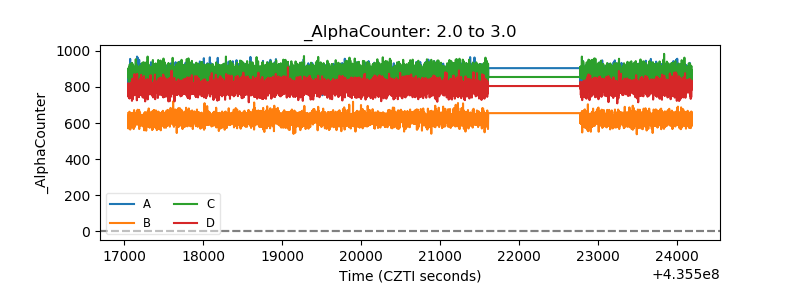 |
| _CPM_Rate | 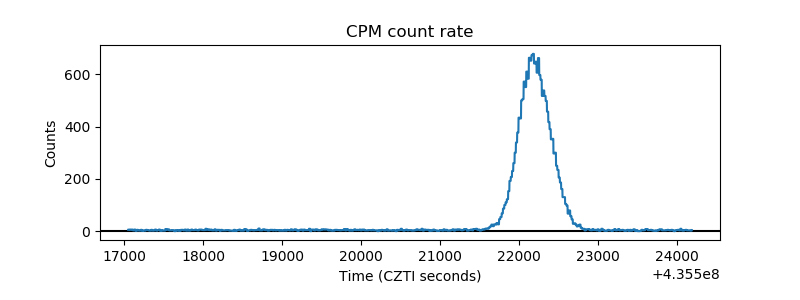 |
| CZT Counter | 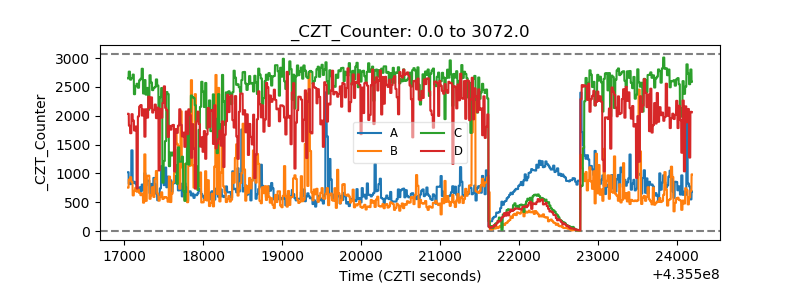 |
| +2.5 Volts monitor | 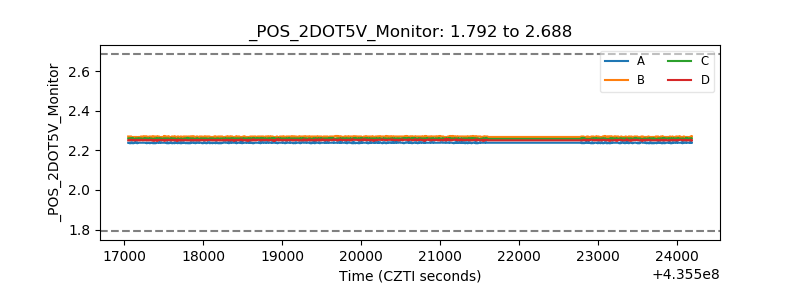 |
| +5 Volts monitor | 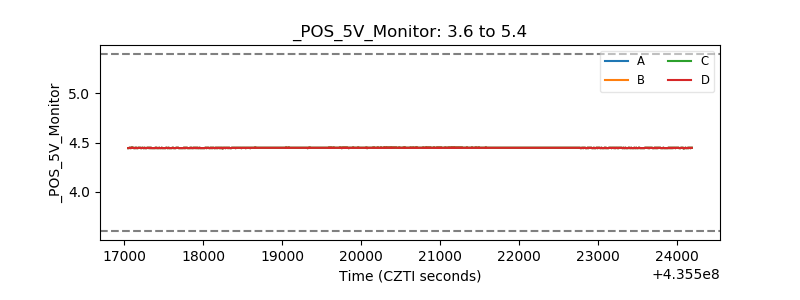 |
| _ROLL_ROT | 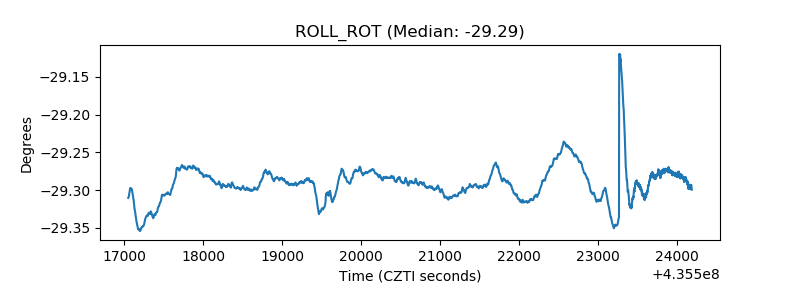 |
| _Roll_DEC | 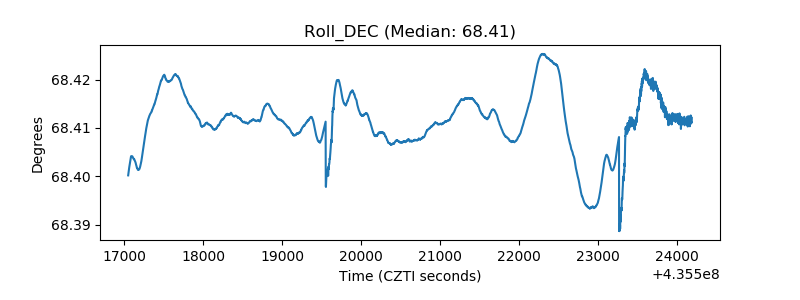 |
| _Roll_RA | 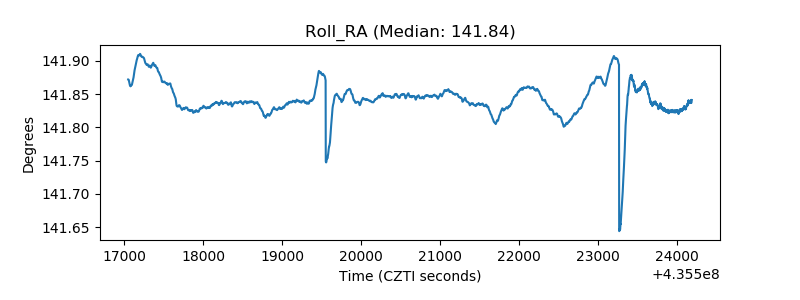 |
| Veto Counter | 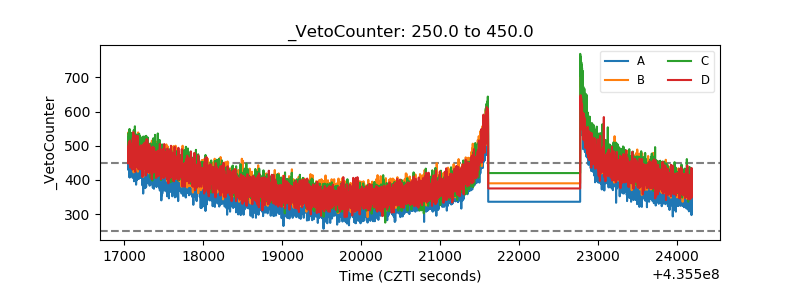 |