| Param | Original file | Final file |
|---|---|---|
| Filename | modeM0/AS1A12_068T04_9000005888_43594cztM0_level2.fits | modeM0/AS1A12_068T04_9000005888_43594cztM0_level2_quad_clean.evt |
| Size (bytes) | 1,060,698,240 | 69,180,480 |
| Size | 1011.6 MB | 66.0 MB |
| Events in quadrant A | 4,135,897 | 677,932 |
| Events in quadrant B | 5,170,674 | 668,179 |
| Events in quadrant C | 15,807,985 | 219,928 |
| Events in quadrant D | 13,680,458 | 98,890 |
| Mode M9 | |||
|---|---|---|---|
| Quadrant | BADHDUFLAG | Total packets | Discarded packets |
| A | 0 | 6 | 0 |
| B | 0 | 6 | 0 |
| C | 0 | 6 | 0 |
| D | 0 | 6 | 0 |
| Mode SS | |||
|---|---|---|---|
| Quadrant | BADHDUFLAG | Total packets | Discarded packets |
| A | 0 | 124 | 0 |
| B | 0 | 124 | 0 |
| C | 0 | 124 | 0 |
| D | 0 | 124 | 0 |
| Mode M0 | |||
|---|---|---|---|
| Quadrant | BADHDUFLAG | Total packets | Discarded packets |
| A | 0 | 16408 | 1 |
| B | 0 | 19634 | 1 |
| C | 0 | 51156 | 1 |
| D | 0 | 44748 | 1 |
| Quadrant | Total seconds | Saturated seconds | Saturation percentage |
|---|---|---|---|
| A | 6064 | 82 | 1.352243% |
| B | 6064 | 644 | 10.620053% |
| C | 6064 | 5928 | 97.757256% |
| D | 6065 | 6065 | 100.000000% |
Noise dominated data is calculated using 1-second bins in cleaned event files. If a bin has >2000 counts, and if more than 50% of those come from <1% of pixels, then it is considered to be noise-dominated and hence unusable.
| Quadrant | # 1 sec bins | Bins with >0 counts | Bins with >2000 counts | High rate bins dominated by noise | Noise dominated (total time) | Noise dominated (detector-on time) | Marked lightcurve |
|---|---|---|---|---|---|---|---|
| A | 6704 | 6065 | 17 | 17 | 0.25% | 0.28% | 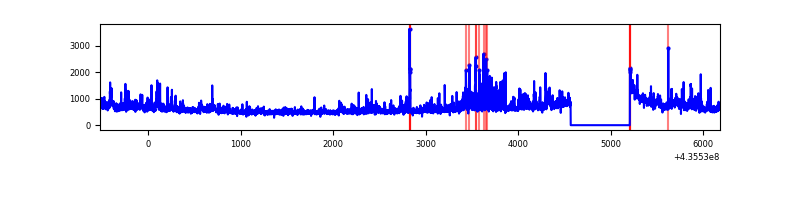 |
| B | 6704 | 6064 | 291 | 291 | 4.34% | 4.80% | 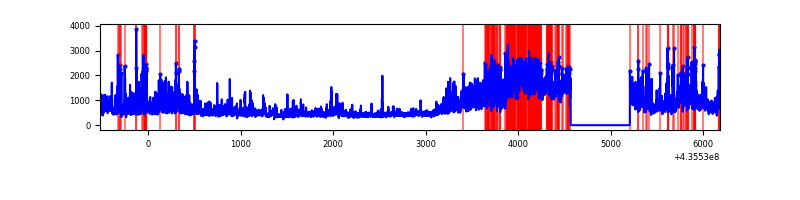 |
| C | 6703 | 6063 | 5761 | 5761 | 85.95% | 95.02% | 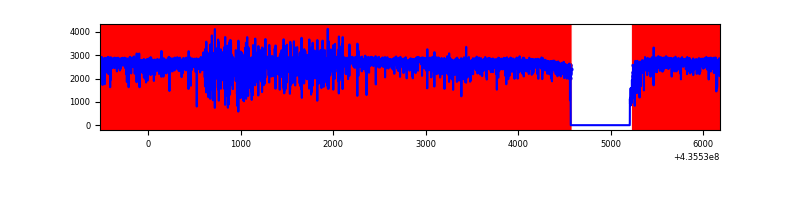 |
| D | 6704 | 6064 | 4662 | 4662 | 69.54% | 76.88% | 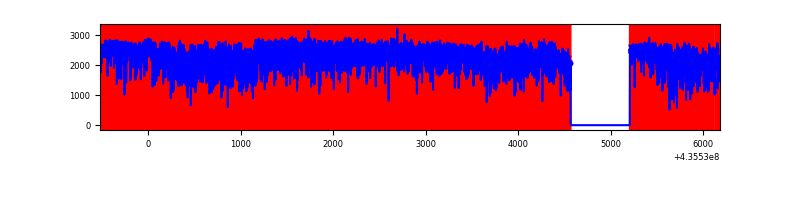 |
Top three noisy pixels from each quadrant. If the there are fewer than three noisy pixels in the level2.evt file, extra rows are filled as -1
| Pixel properties | Quadrant properties | ||||||
|---|---|---|---|---|---|---|---|
| Quadrant | DetID | PixID | Counts | Sigma | Mean | Median | Sigma |
| A | 10 | 83 | 726999 | 5224.43 | 665 | 651 | 139.0 |
| A | 12 | 189 | 354748 | 2546.93 | 665 | 651 | 139.0 |
| A | 14 | 63 | 203496 | 1459.01 | 665 | 651 | 139.0 |
| B | 4 | 206 | 1281697 | 10228.3 | 648 | 628 | 125.2 |
| B | 0 | 219 | 330500 | 2633.76 | 648 | 628 | 125.2 |
| B | 0 | 182 | 285042 | 2270.81 | 648 | 628 | 125.2 |
| C | 15 | 142 | 9405258 | 173706.79 | 224 | 226 | 54.1 |
| C | 15 | 174 | 3531989 | 65230.1 | 224 | 226 | 54.1 |
| C | 3 | 233 | 455644 | 8411.37 | 224 | 226 | 54.1 |
| D | 4 | 212 | 4082882 | 107040.71 | 119 | 115 | 38.1 |
| D | 8 | 192 | 2465575 | 64638.66 | 119 | 115 | 38.1 |
| D | 4 | 216 | 1964552 | 51503.0 | 119 | 115 | 38.1 |
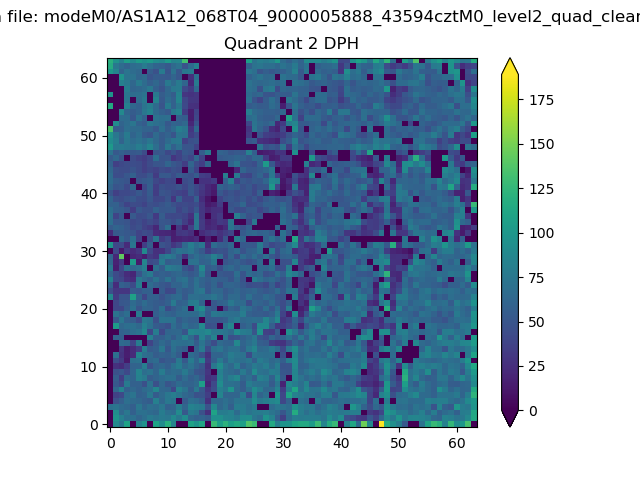
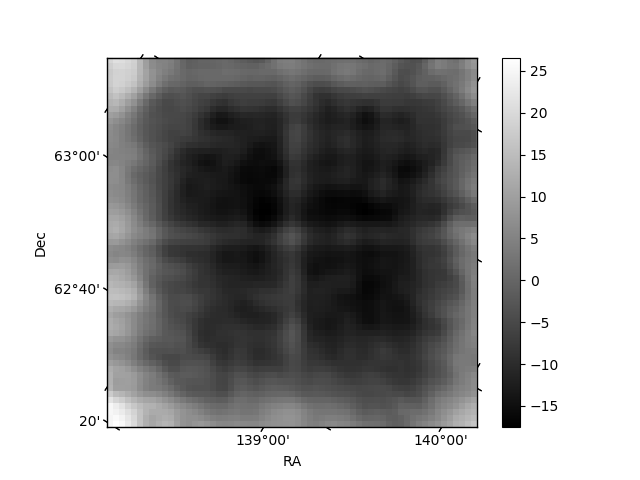
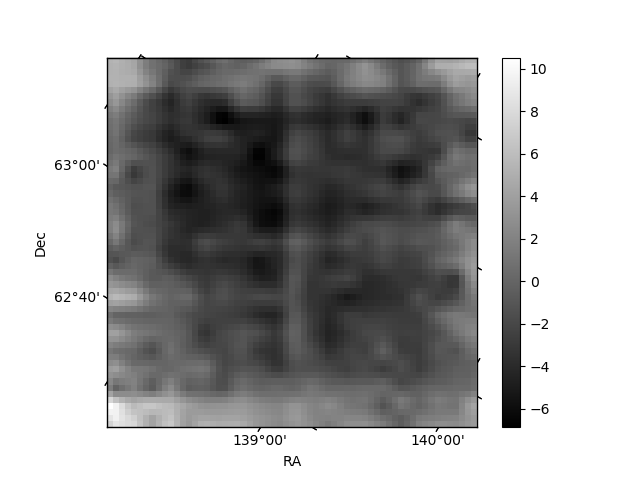
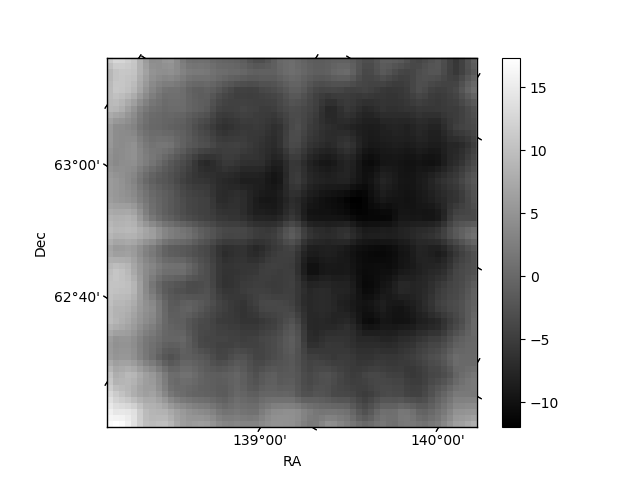
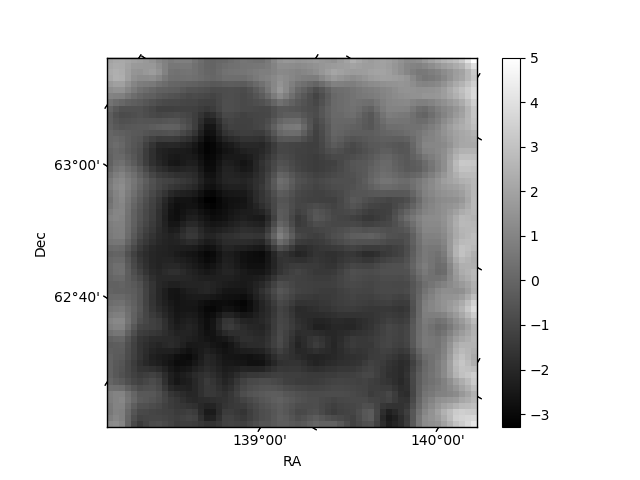
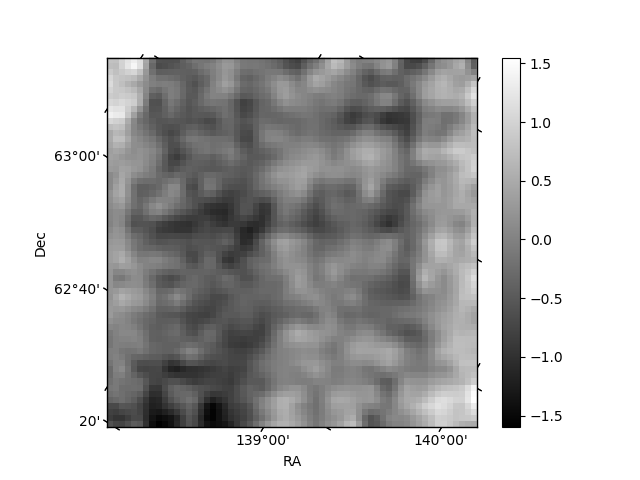
Histogram calculated using DETX and DETY for each event in the final _common_clean file
| Quadrant A | 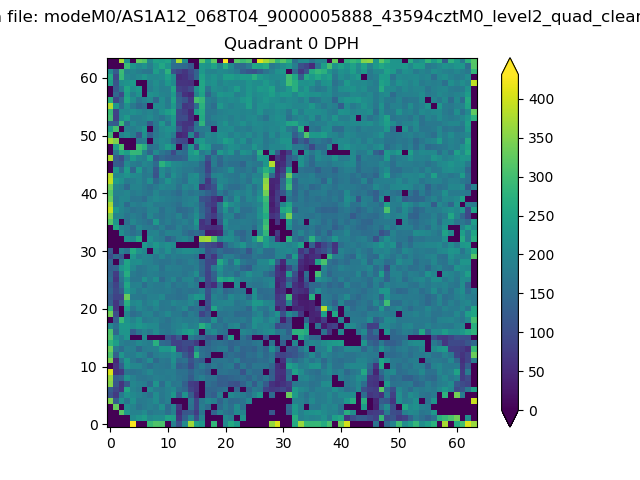 |
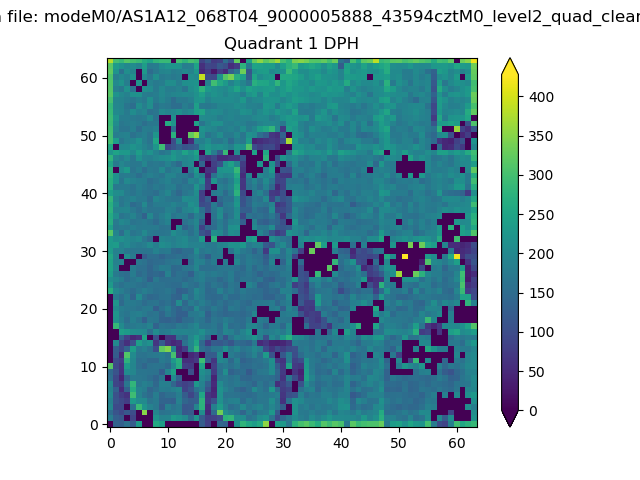 |
Quadrant B |
|---|---|---|---|
| Quadrant D | 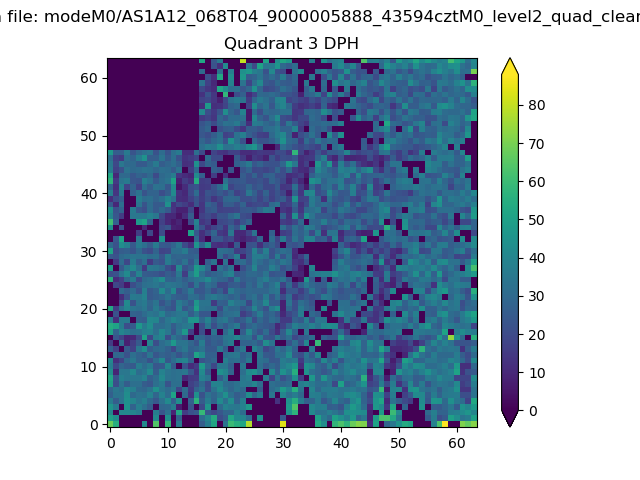 |
 |
Quadrant C |
| Plot type | Count rate plots | Images |
|---|---|---|
| Comparison with Poisson distribution Blue bars denote a histogram of data divided into 1 sec bins. Red curve is a Poisson curve with rate = median count rate of data. |
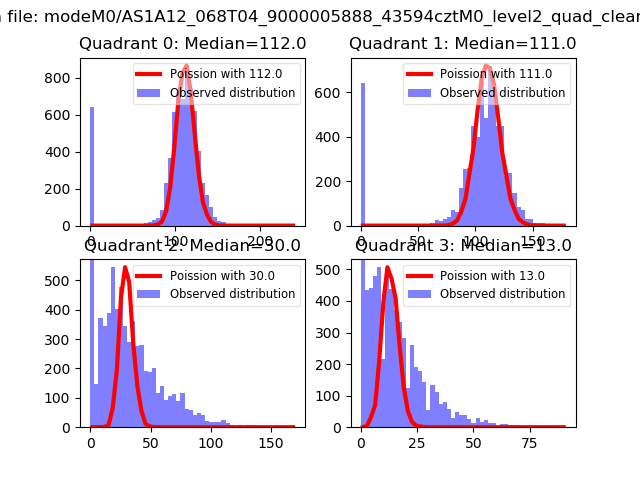 |
 |
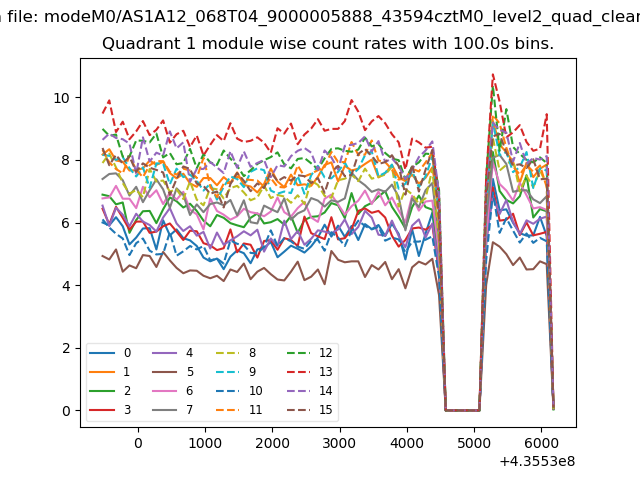
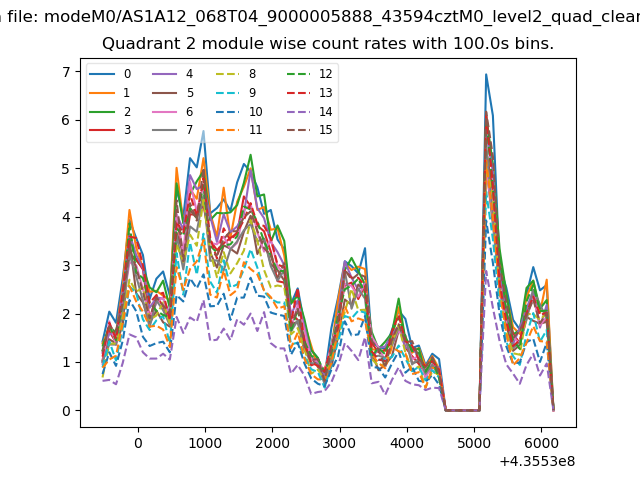
| Quadrant-wise count rates Data is divided into 100 sec bins |
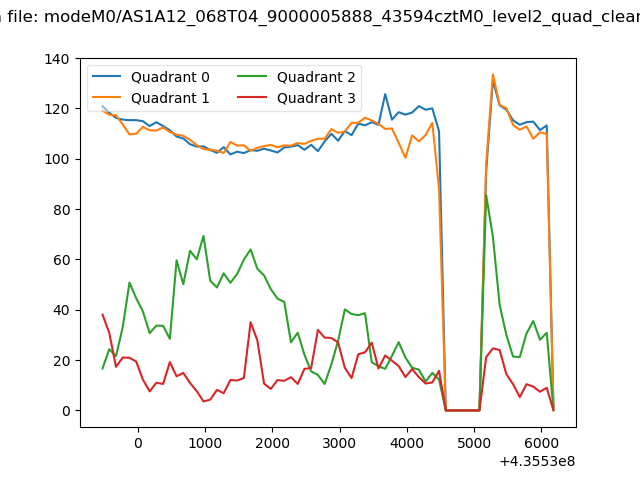 |
|
| Module-wise count rates for Quadrant A Data is divided into 100 sec bins |
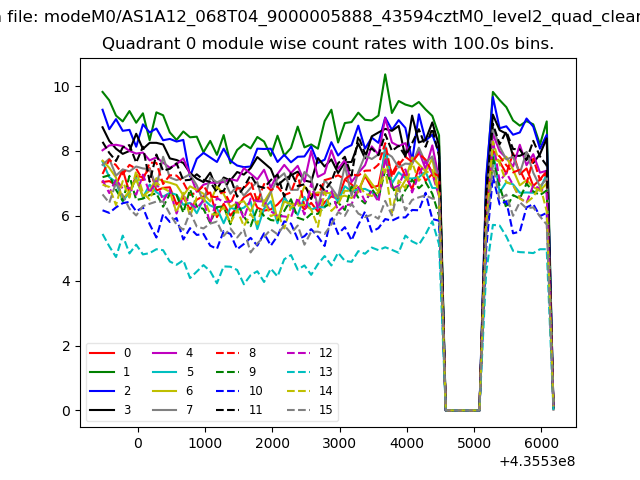 |
 |
| Module-wise count rates for Quadrant B Data is divided into 100 sec bins |
 |
 |
| Module-wise count rates for Quadrant C Data is divided into 100 sec bins |
 |
 |
| Module-wise count rates for Quadrant D Data is divided into 100 sec bins |
 |
 |
| Parameter | Plot |
|---|---|
| CZT HV Monitor | 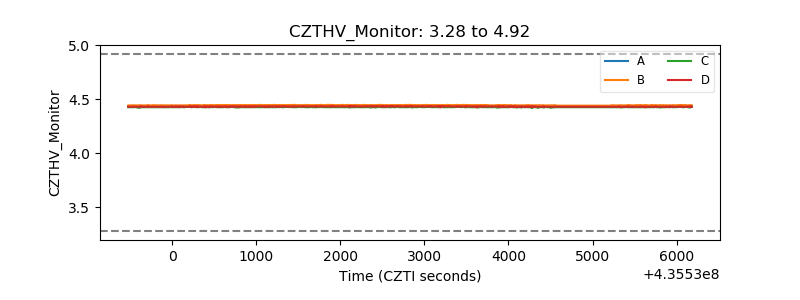 |
| D_VDD | 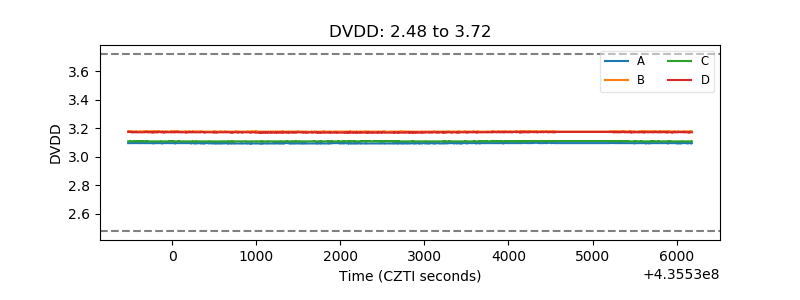 |
| Temperature 1 | 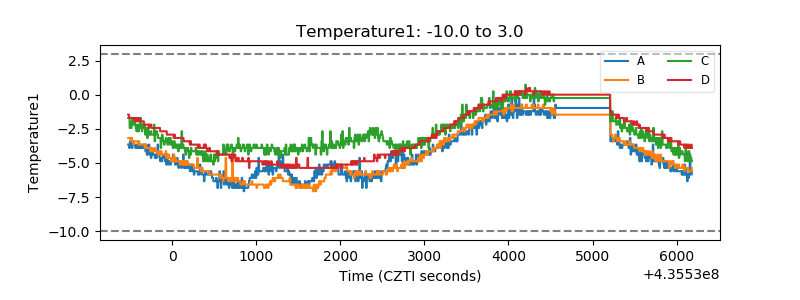 |
| Veto HV Monitor | 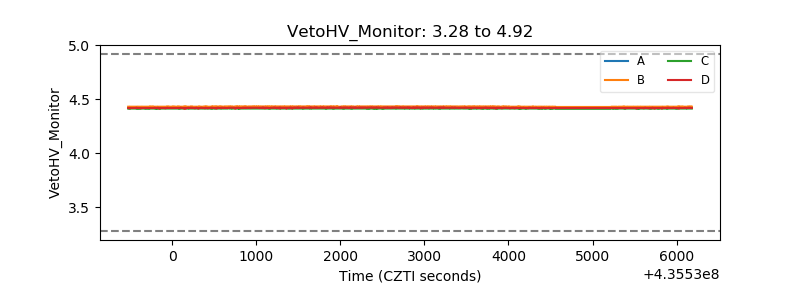 |
| Veto LLD | 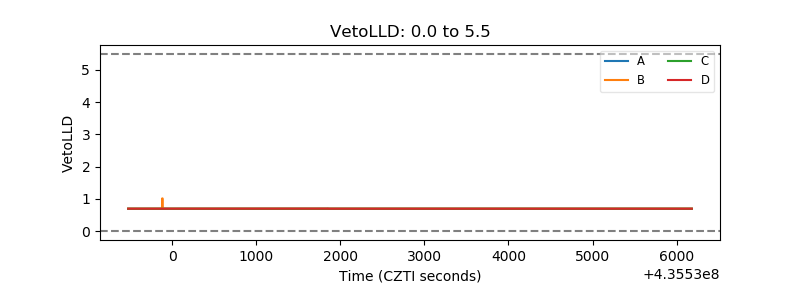 |
| Alpha Counter | 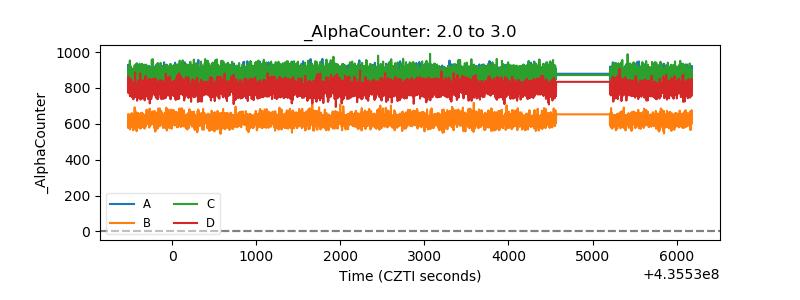 |
| _CPM_Rate | 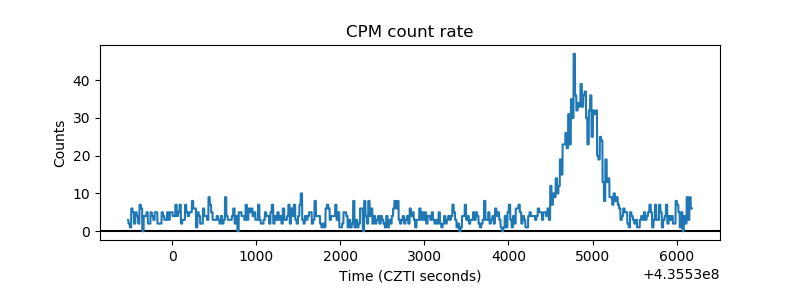 |
| CZT Counter | 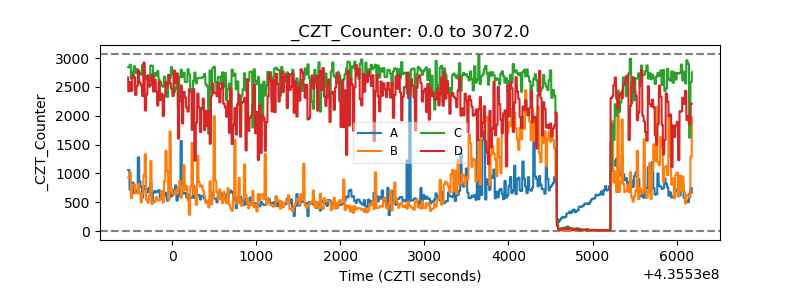 |
| +2.5 Volts monitor | 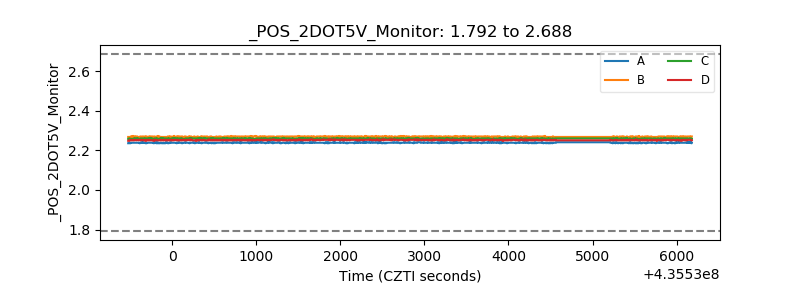 |
| +5 Volts monitor | 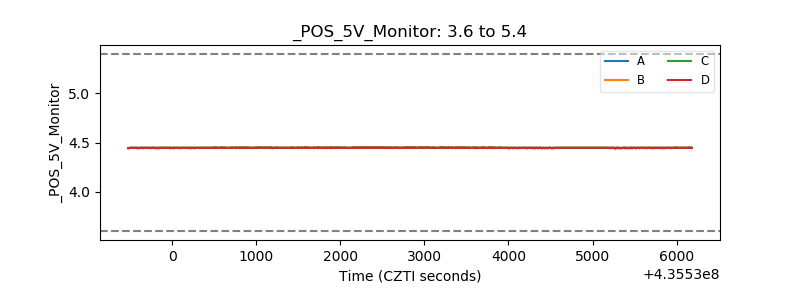 |
| _ROLL_ROT | 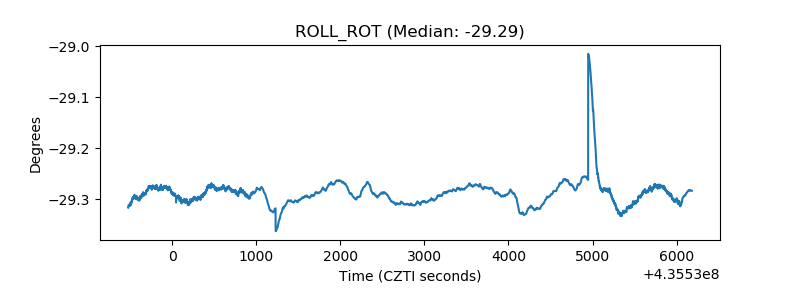 |
| _Roll_DEC | 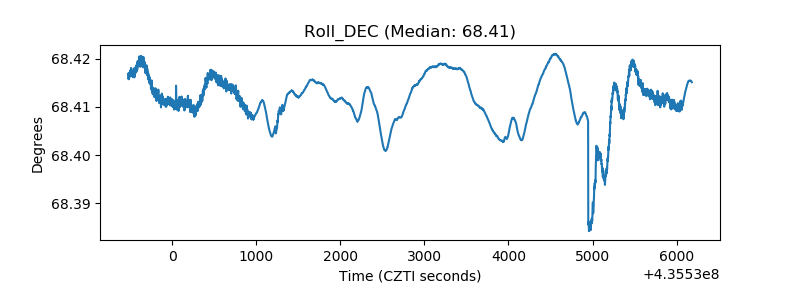 |
| _Roll_RA |  |
| Veto Counter | 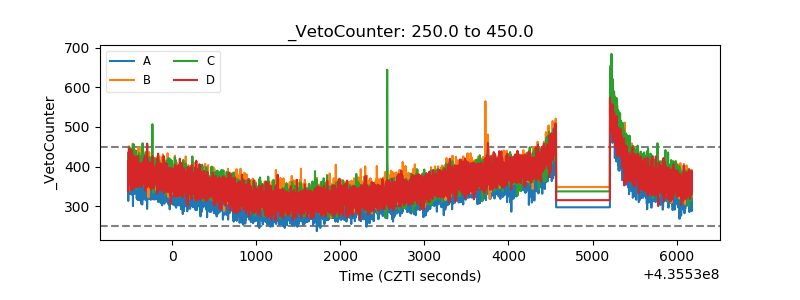 |