| Param | Original file | Final file |
|---|---|---|
| Filename | modeM0/AS1C07_001T10_9000005890_43595cztM0_level2.fits | modeM0/AS1C07_001T10_9000005890_43595cztM0_level2_quad_clean.evt |
| Size (bytes) | 1,419,814,080 | 82,451,520 |
| Size | 1.3 GB | 78.6 MB |
| Events in quadrant A | 7,741,193 | 799,830 |
| Events in quadrant B | 6,485,414 | 812,035 |
| Events in quadrant C | 19,834,906 | 199,344 |
| Events in quadrant D | 17,909,186 | 147,577 |
| Mode SS | |||
|---|---|---|---|
| Quadrant | BADHDUFLAG | Total packets | Discarded packets |
| A | 0 | 152 | 0 |
| B | 0 | 152 | 0 |
| C | 0 | 152 | 0 |
| D | 0 | 152 | 0 |
| Mode M0 | |||
|---|---|---|---|
| Quadrant | BADHDUFLAG | Total packets | Discarded packets |
| A | 0 | 28402 | 0 |
| B | 0 | 24623 | 0 |
| C | 0 | 64174 | 0 |
| D | 0 | 58412 | 7 |
| Quadrant | Total seconds | Saturated seconds | Saturation percentage |
|---|---|---|---|
| A | 7615 | 773 | 10.151018% |
| B | 7615 | 691 | 9.074196% |
| C | 7615 | 7595 | 99.737360% |
| D | 7614 | 7612 | 99.973733% |
Noise dominated data is calculated using 1-second bins in cleaned event files. If a bin has >2000 counts, and if more than 50% of those come from <1% of pixels, then it is considered to be noise-dominated and hence unusable.
| Quadrant | # 1 sec bins | Bins with >0 counts | Bins with >2000 counts | High rate bins dominated by noise | Noise dominated (total time) | Noise dominated (detector-on time) | Marked lightcurve |
|---|---|---|---|---|---|---|---|
| A | 7615 | 7615 | 614 | 614 | 8.06% | 8.06% | 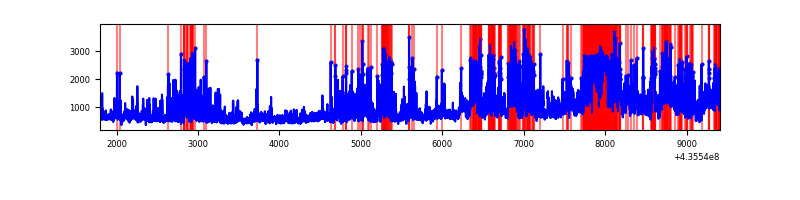 |
| B | 7615 | 7615 | 319 | 319 | 4.19% | 4.19% | 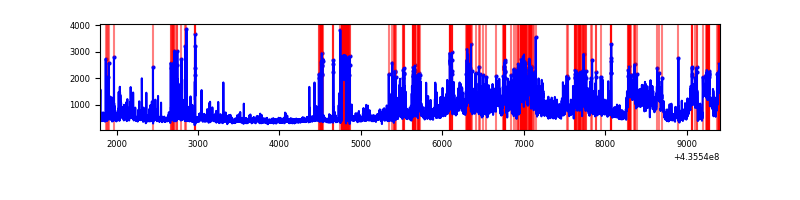 |
| C | 7614 | 7614 | 7460 | 7460 | 97.98% | 97.98% | 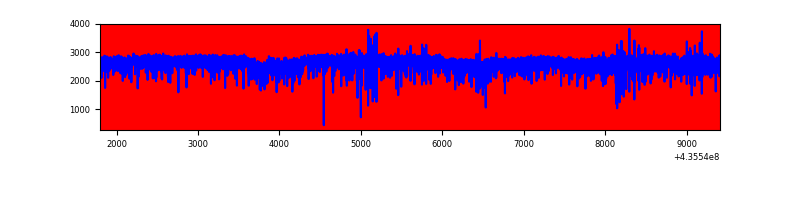 |
| D | 7613 | 7613 | 6761 | 6761 | 88.81% | 88.81% | 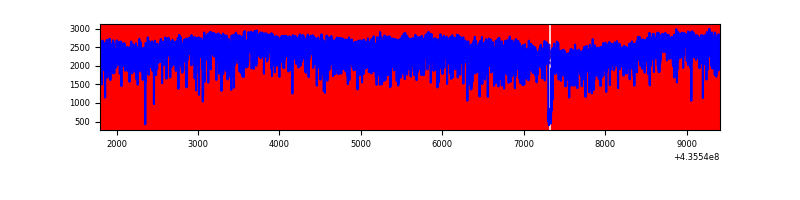 |
Top three noisy pixels from each quadrant. If the there are fewer than three noisy pixels in the level2.evt file, extra rows are filled as -1
| Pixel properties | Quadrant properties | ||||||
|---|---|---|---|---|---|---|---|
| Quadrant | DetID | PixID | Counts | Sigma | Mean | Median | Sigma |
| A | 10 | 99 | 1625341 | 9645.43 | 805 | 789 | 168.4 |
| A | 14 | 63 | 1282241 | 7608.35 | 805 | 789 | 168.4 |
| A | 10 | 83 | 785492 | 4659.01 | 805 | 789 | 168.4 |
| B | 0 | 183 | 1308404 | 8306.7 | 811 | 788 | 157.4 |
| B | 4 | 206 | 446973 | 2834.41 | 811 | 788 | 157.4 |
| B | 0 | 219 | 288926 | 1830.41 | 811 | 788 | 157.4 |
| C | 15 | 142 | 12137659 | 229627.31 | 217 | 218 | 52.9 |
| C | 15 | 174 | 4218252 | 79800.66 | 217 | 218 | 52.9 |
| C | 3 | 233 | 1323462 | 25034.35 | 217 | 218 | 52.9 |
| D | 4 | 216 | 4660582 | 75105.76 | 185 | 176 | 62.1 |
| D | 4 | 212 | 3966445 | 63919.25 | 185 | 176 | 62.1 |
| D | 8 | 192 | 3411988 | 54983.78 | 185 | 176 | 62.1 |
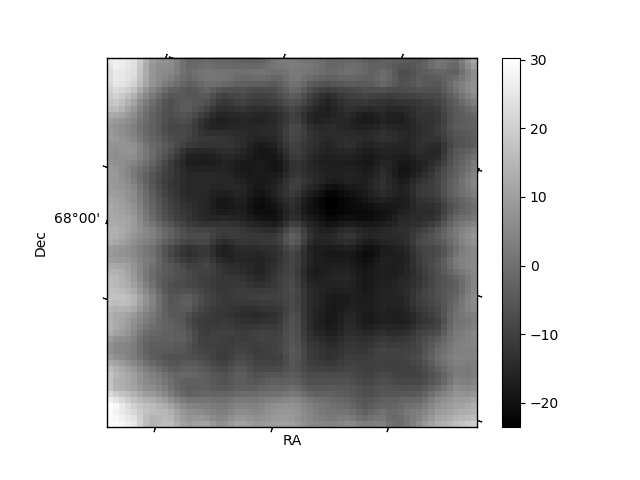
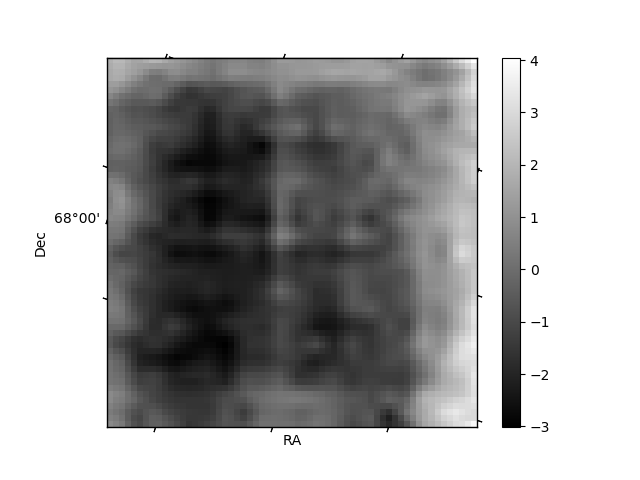
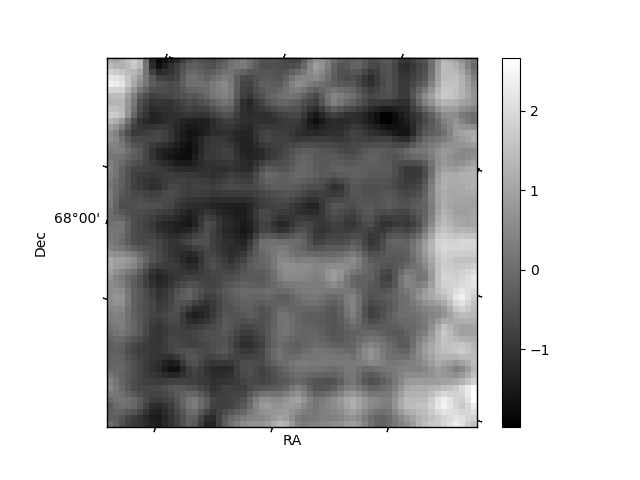
Histogram calculated using DETX and DETY for each event in the final _common_clean file
| Quadrant A | 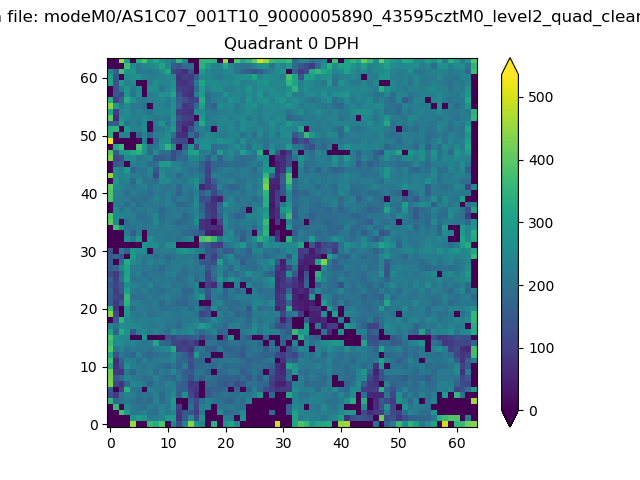 |
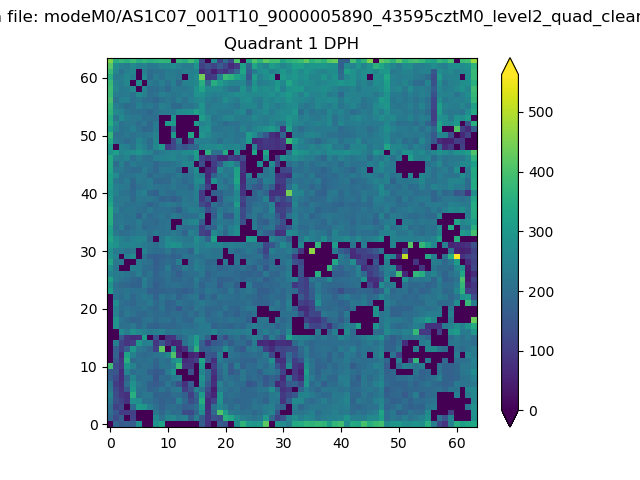 |
Quadrant B |
|---|---|---|---|
| Quadrant D | 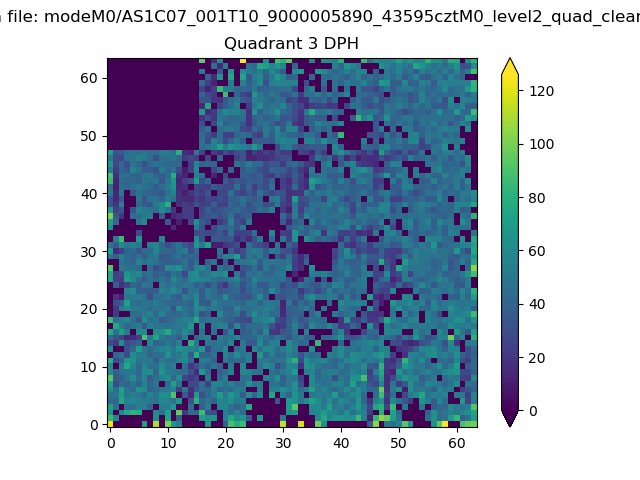 |
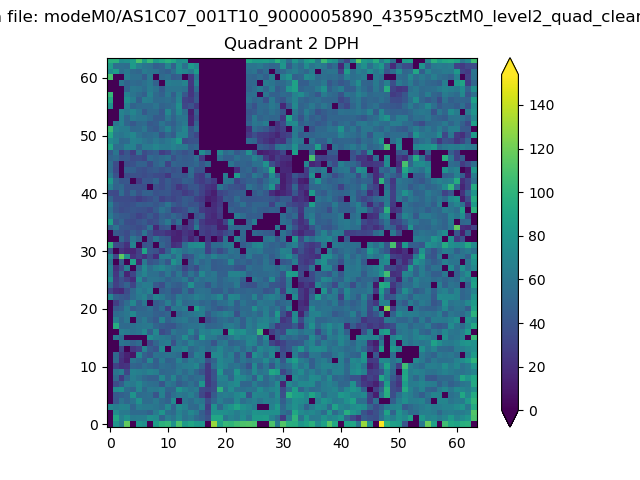 |
Quadrant C |
| Plot type | Count rate plots | Images |
|---|---|---|
| Comparison with Poisson distribution Blue bars denote a histogram of data divided into 1 sec bins. Red curve is a Poisson curve with rate = median count rate of data. |
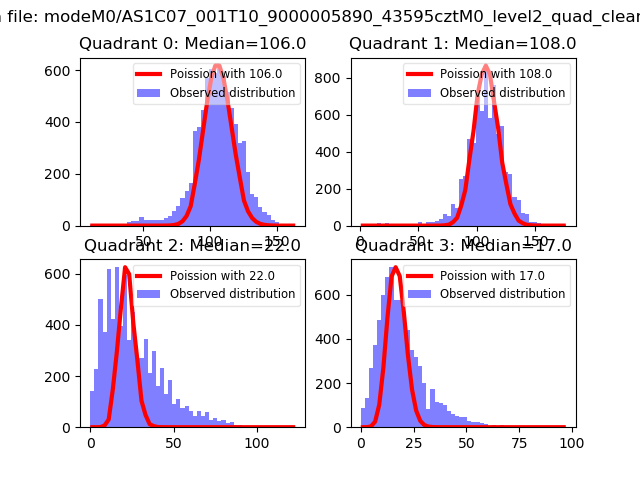 |
 |
| Quadrant-wise count rates Data is divided into 100 sec bins |
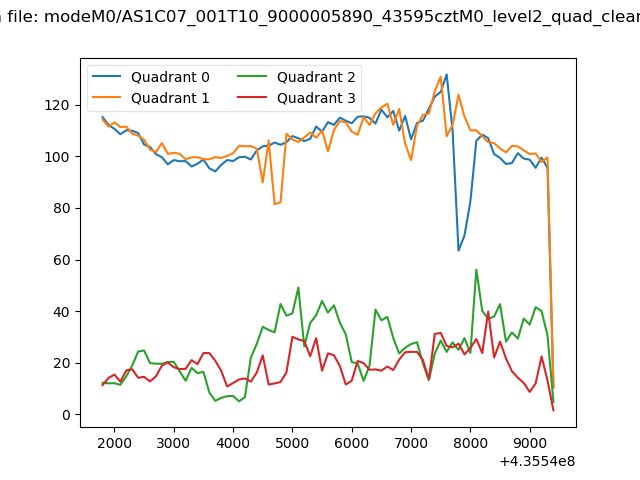 |
|
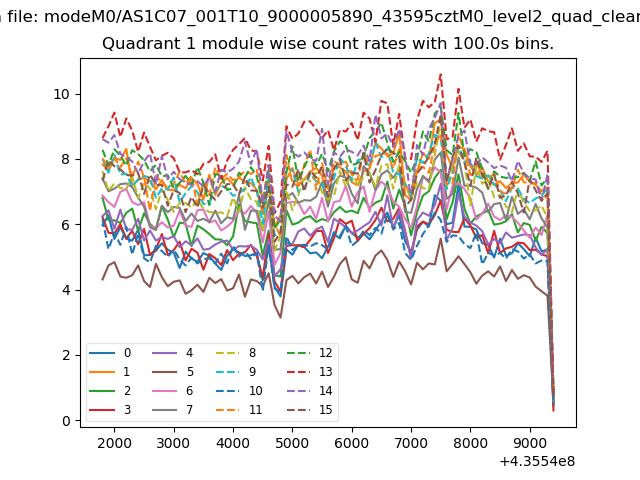
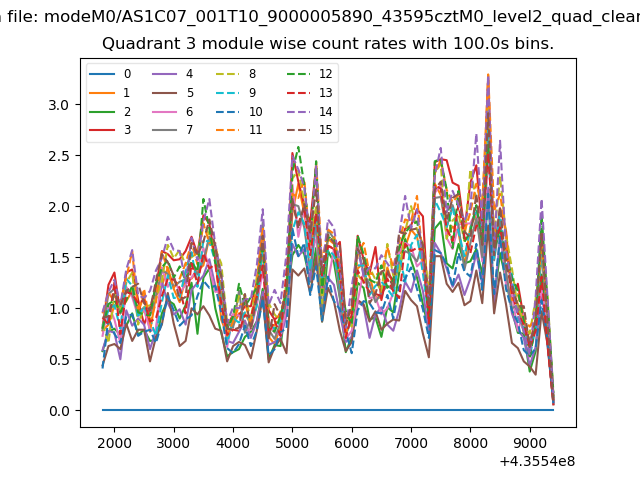
| Module-wise count rates for Quadrant A Data is divided into 100 sec bins |
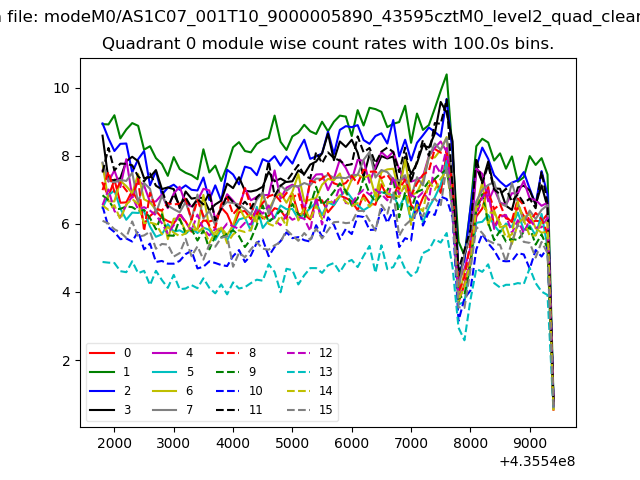 |
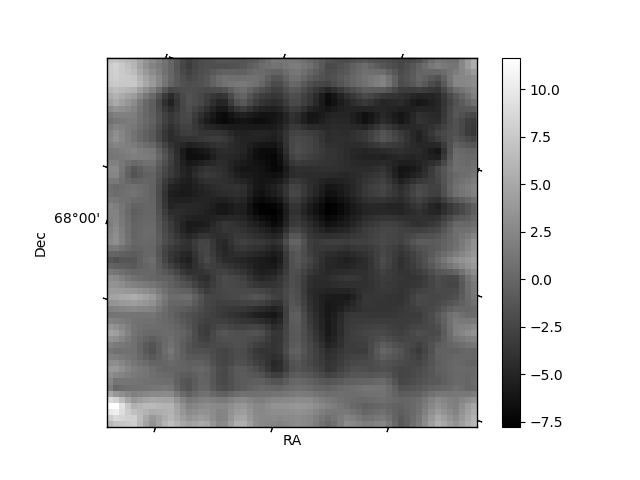 |
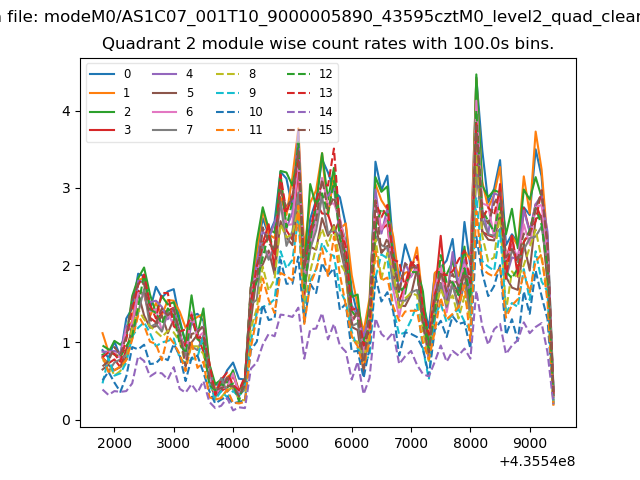
| Module-wise count rates for Quadrant B Data is divided into 100 sec bins |
 |
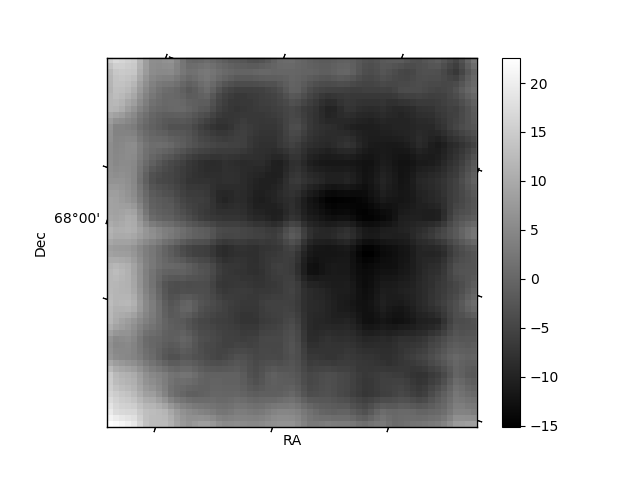 |
| Module-wise count rates for Quadrant C Data is divided into 100 sec bins |
 |
 |
| Module-wise count rates for Quadrant D Data is divided into 100 sec bins |
 |
 |
| Parameter | Plot |
|---|---|
| CZT HV Monitor | 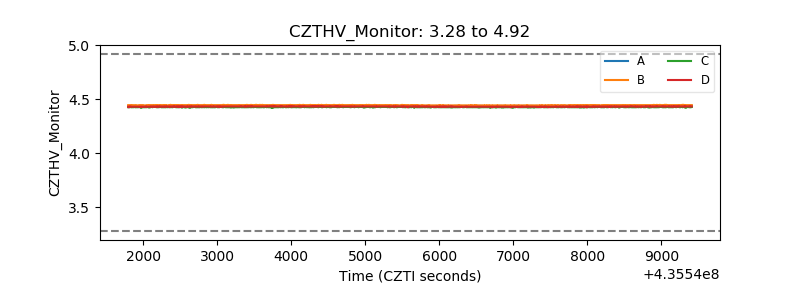 |
| D_VDD | 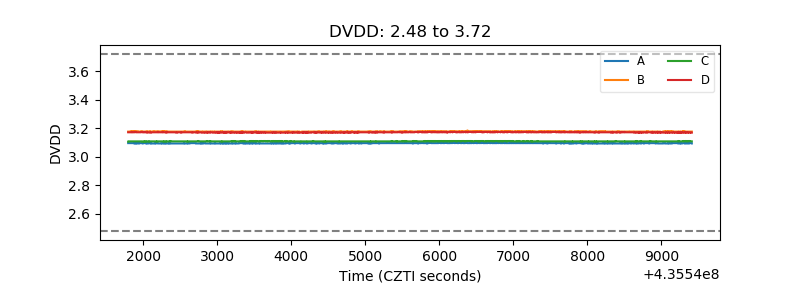 |
| Temperature 1 |  |
| Veto HV Monitor | 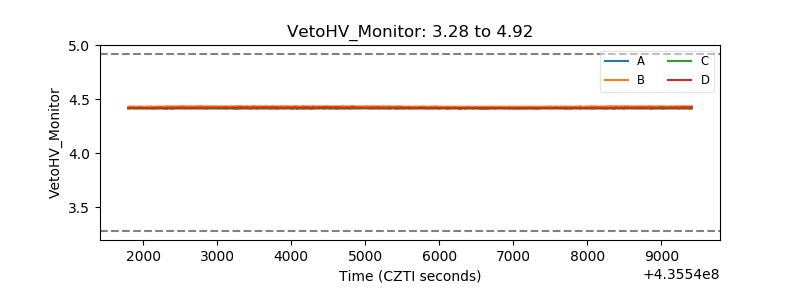 |
| Veto LLD | 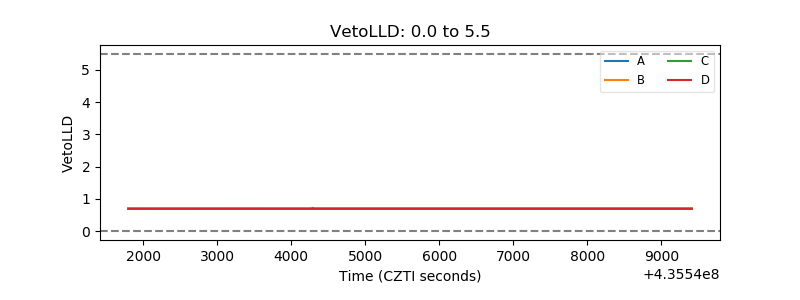 |
| Alpha Counter | 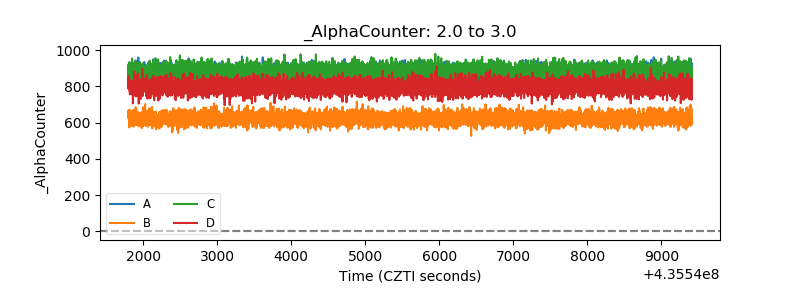 |
| _CPM_Rate | 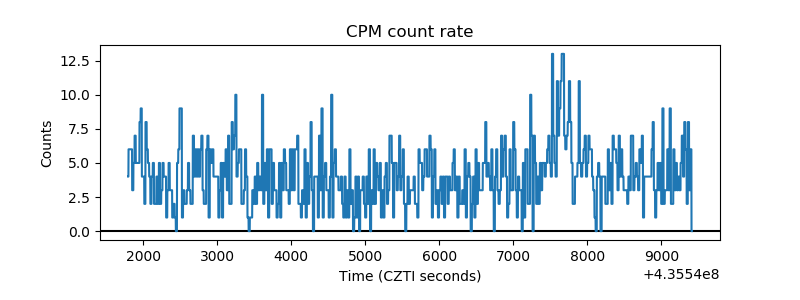 |
| CZT Counter | 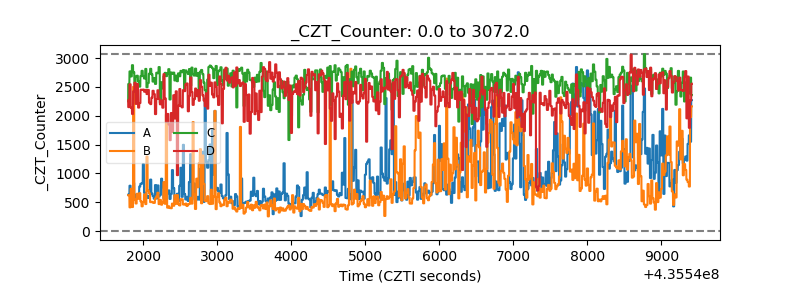 |
| +2.5 Volts monitor | 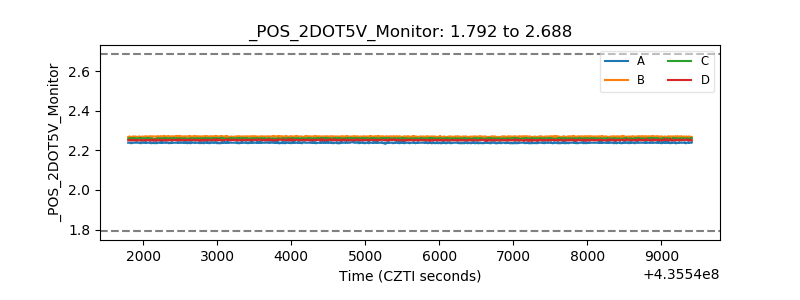 |
| +5 Volts monitor | 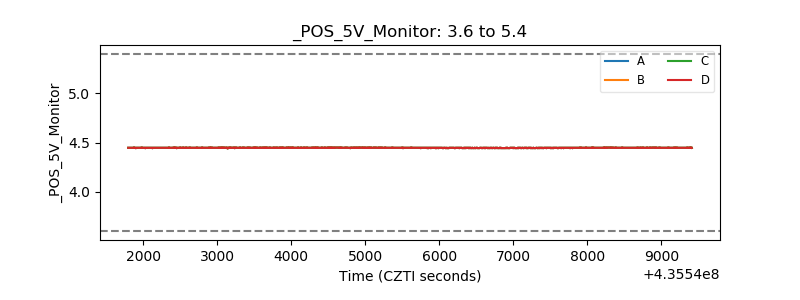 |
| _ROLL_ROT | 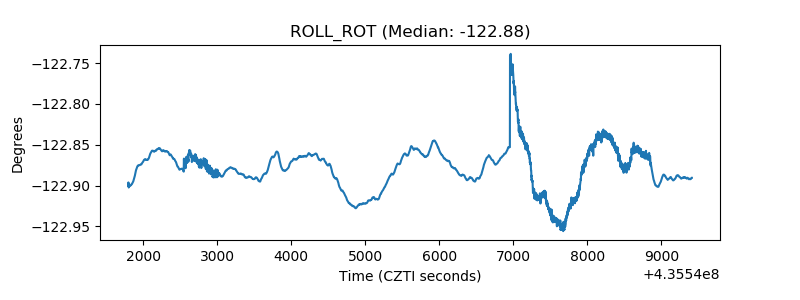 |
| _Roll_DEC | 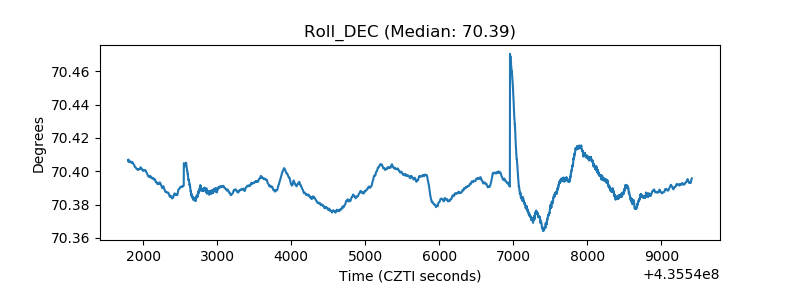 |
| _Roll_RA | 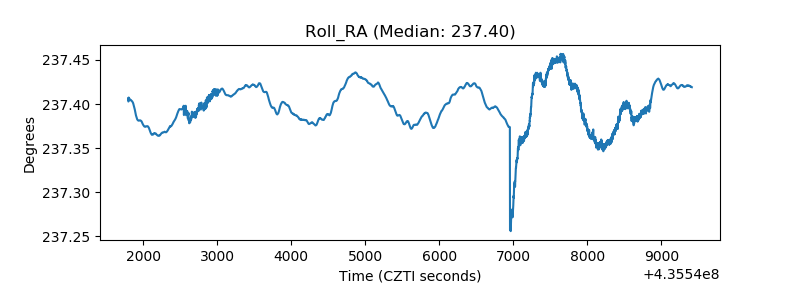 |
| Veto Counter | 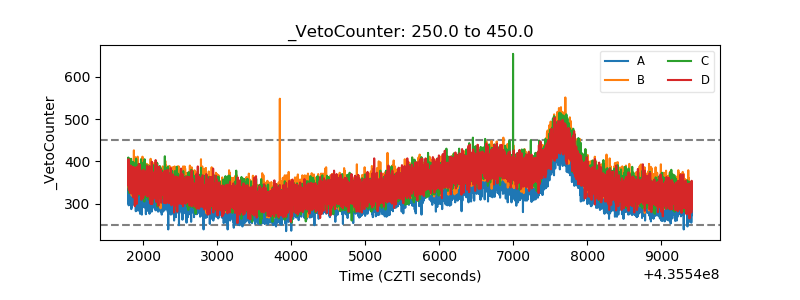 |