| Param | Original file | Final file |
|---|---|---|
| Filename | modeM0/AS1C07_001T10_9000005890_43598cztM0_level2.fits | modeM0/AS1C07_001T10_9000005890_43598cztM0_level2_quad_clean.evt |
| Size (bytes) | 2,685,787,200 | 153,296,640 |
| Size | 2.5 GB | 146.2 MB |
| Events in quadrant A | 14,322,703 | 1,475,950 |
| Events in quadrant B | 14,872,918 | 1,488,571 |
| Events in quadrant C | 35,332,463 | 379,290 |
| Events in quadrant D | 33,813,416 | 310,969 |
| Mode SS | |||
|---|---|---|---|
| Quadrant | BADHDUFLAG | Total packets | Discarded packets |
| A | 0 | 287 | 1 |
| B | 0 | 286 | 0 |
| C | 0 | 287 | 1 |
| D | 0 | 286 | 0 |
| Mode M9 | |||
|---|---|---|---|
| Quadrant | BADHDUFLAG | Total packets | Discarded packets |
| A | 0 | 4 | 0 |
| B | 0 | 4 | 0 |
| C | 0 | 7 | 3 |
| D | 0 | 6 | 2 |
| Mode M0 | |||
|---|---|---|---|
| Quadrant | BADHDUFLAG | Total packets | Discarded packets |
| A | 0 | 52364 | 120 |
| B | 0 | 54139 | 114 |
| C | 0 | 115049 | 394 |
| D | 0 | 110459 | 411 |
| Quadrant | Total seconds | Saturated seconds | Saturation percentage |
|---|---|---|---|
| A | 14061 | 1346 | 9.572577% |
| B | 14063 | 1841 | 13.091090% |
| C | 14055 | 13820 | 98.327997% |
| D | 14054 | 13952 | 99.274228% |
Noise dominated data is calculated using 1-second bins in cleaned event files. If a bin has >2000 counts, and if more than 50% of those come from <1% of pixels, then it is considered to be noise-dominated and hence unusable.
| Quadrant | # 1 sec bins | Bins with >0 counts | Bins with >2000 counts | High rate bins dominated by noise | Noise dominated (total time) | Noise dominated (detector-on time) | Marked lightcurve |
|---|---|---|---|---|---|---|---|
| A | 15249 | 14069 | 847 | 847 | 5.55% | 6.02% | 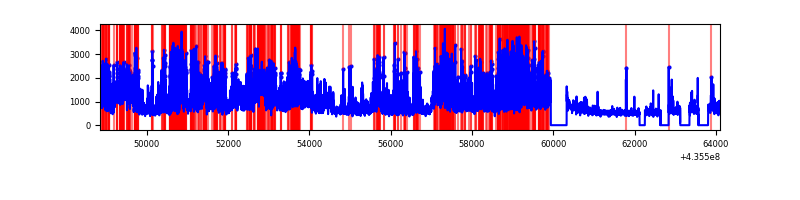 |
| B | 15249 | 14075 | 1017 | 1017 | 6.67% | 7.23% | 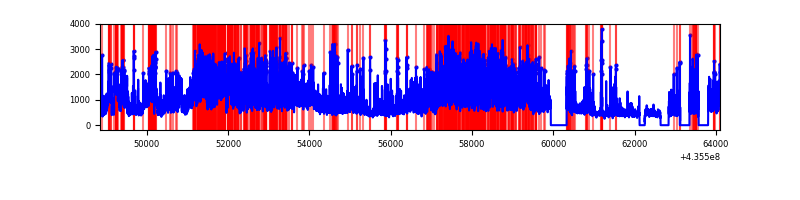 |
| C | 15248 | 14054 | 12959 | 12959 | 84.99% | 92.21% | 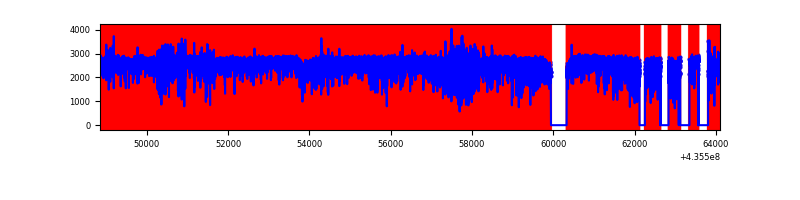 |
| D | 15248 | 14053 | 12842 | 12842 | 84.22% | 91.38% | 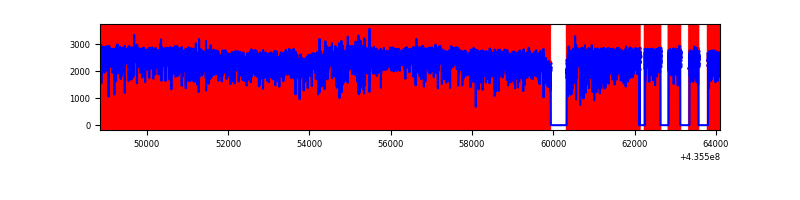 |
Top three noisy pixels from each quadrant. If the there are fewer than three noisy pixels in the level2.evt file, extra rows are filled as -1
| Pixel properties | Quadrant properties | ||||||
|---|---|---|---|---|---|---|---|
| Quadrant | DetID | PixID | Counts | Sigma | Mean | Median | Sigma |
| A | 10 | 99 | 2938043 | 9451.28 | 1517 | 1488 | 310.7 |
| A | 10 | 83 | 1501989 | 4829.35 | 1517 | 1488 | 310.7 |
| A | 12 | 189 | 1400390 | 4502.36 | 1517 | 1488 | 310.7 |
| B | 4 | 206 | 4436548 | 15429.3 | 1499 | 1456 | 287.4 |
| B | 5 | 235 | 958866 | 3330.75 | 1499 | 1456 | 287.4 |
| B | 0 | 183 | 955286 | 3318.29 | 1499 | 1456 | 287.4 |
| C | 15 | 142 | 16159935 | 159561.76 | 432 | 434 | 101.3 |
| C | 15 | 174 | 9465621 | 93460.93 | 432 | 434 | 101.3 |
| C | 15 | 158 | 3496893 | 34524.65 | 432 | 434 | 101.3 |
| D | 4 | 216 | 9075665 | 67850.53 | 418 | 397 | 133.8 |
| D | 8 | 192 | 7340115 | 54874.82 | 418 | 397 | 133.8 |
| D | 4 | 212 | 5858202 | 43795.42 | 418 | 397 | 133.8 |
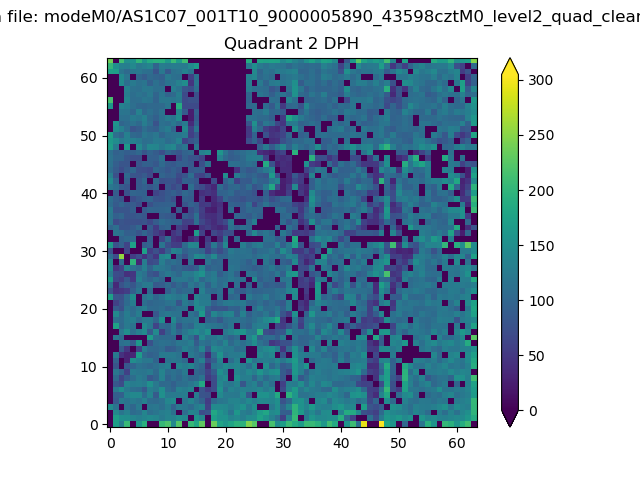
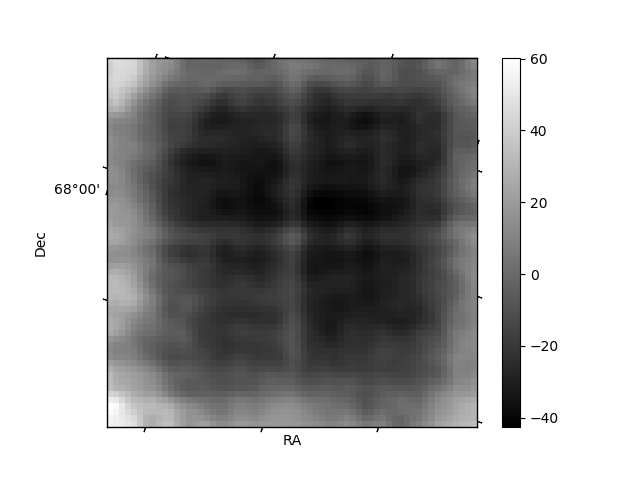
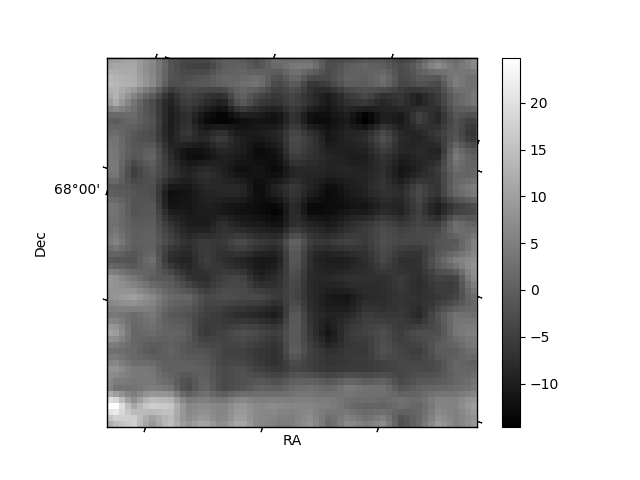
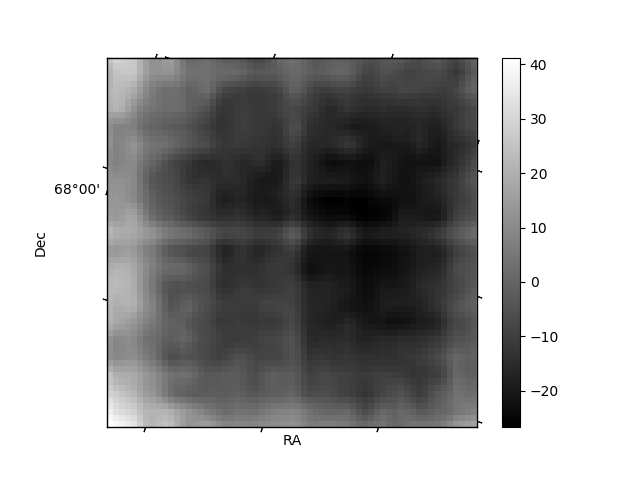
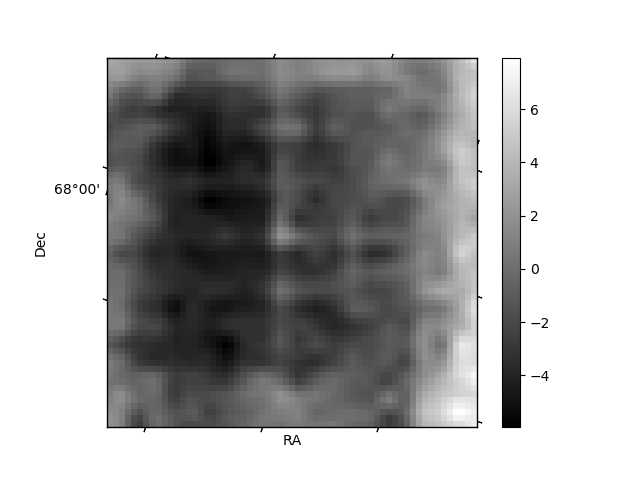
Histogram calculated using DETX and DETY for each event in the final _common_clean file
| Quadrant A | 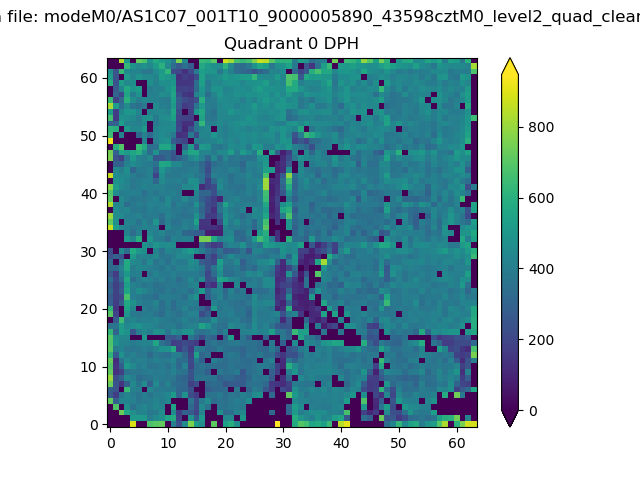 |
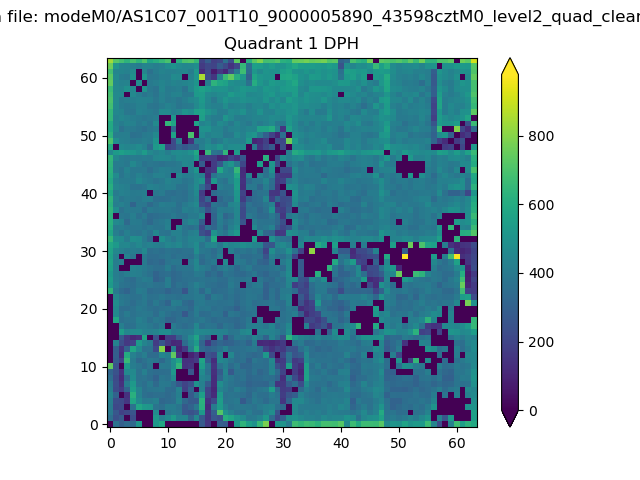 |
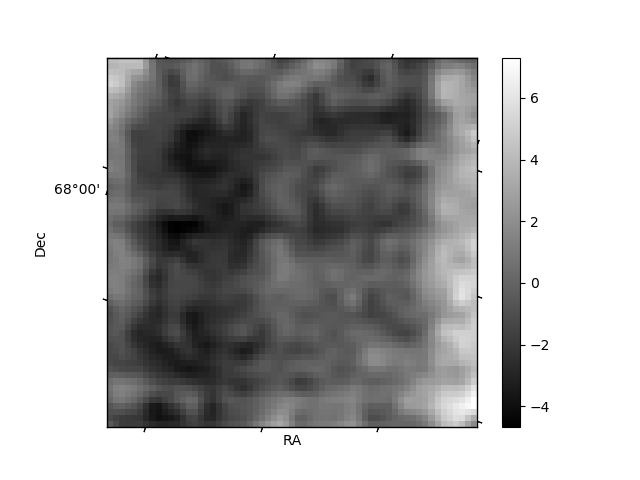
Quadrant B |
|---|---|---|---|
| Quadrant D | 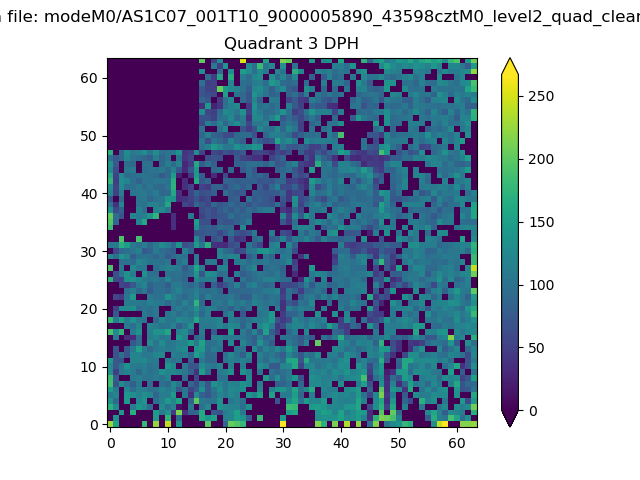 |
 |
Quadrant C |
| Plot type | Count rate plots | Images |
|---|---|---|
| Comparison with Poisson distribution Blue bars denote a histogram of data divided into 1 sec bins. Red curve is a Poisson curve with rate = median count rate of data. |
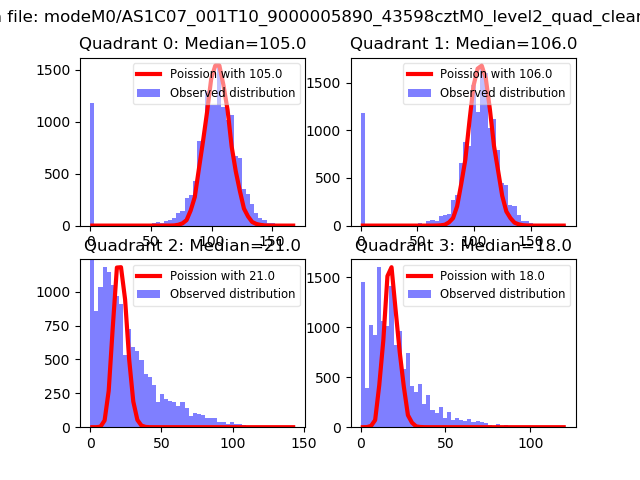 |
 |
| Quadrant-wise count rates Data is divided into 100 sec bins |
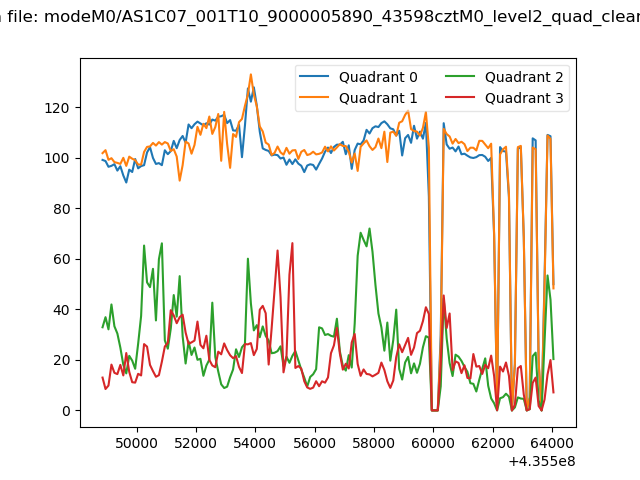 |
|
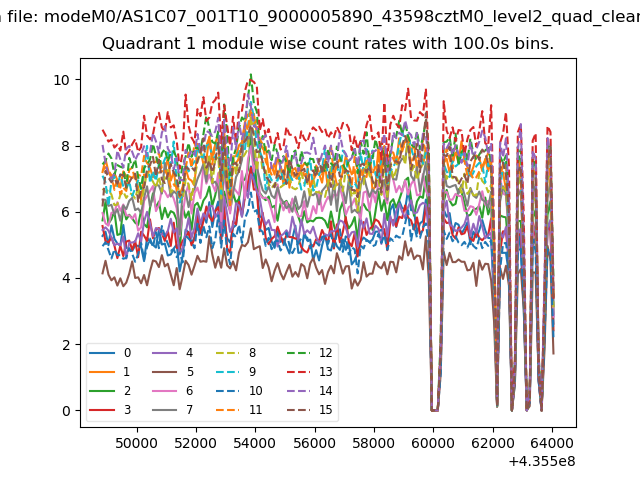
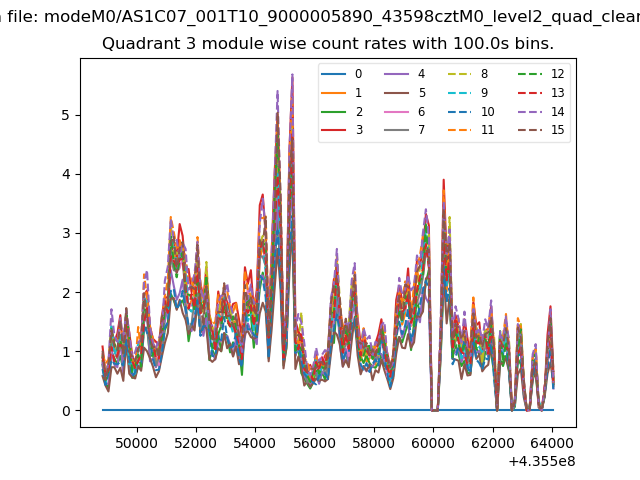
| Module-wise count rates for Quadrant A Data is divided into 100 sec bins |
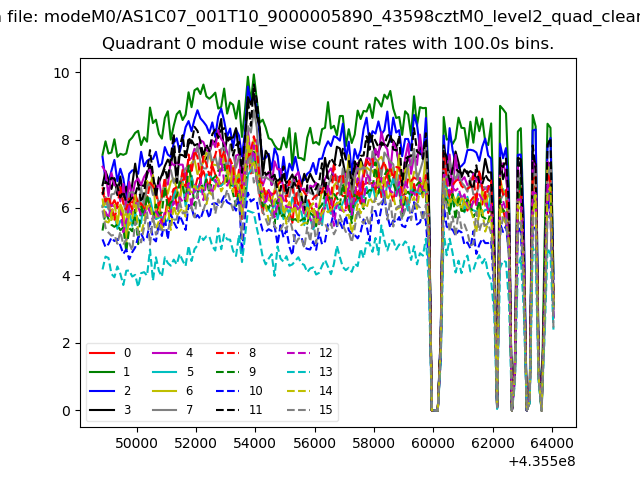 |
 |
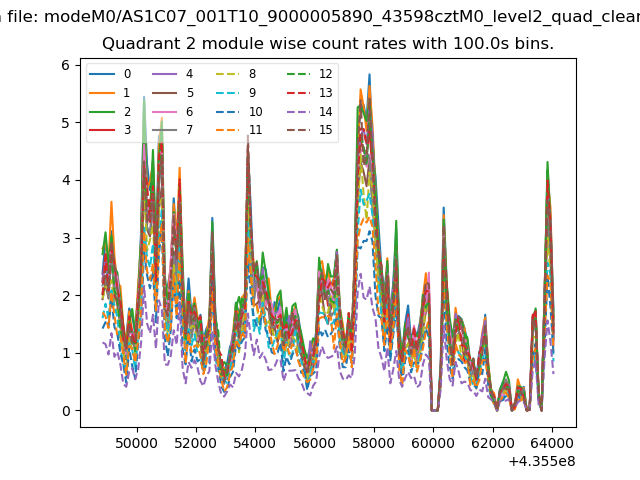
| Module-wise count rates for Quadrant B Data is divided into 100 sec bins |
 |
 |
| Module-wise count rates for Quadrant C Data is divided into 100 sec bins |
 |
 |
| Module-wise count rates for Quadrant D Data is divided into 100 sec bins |
 |
 |
| Parameter | Plot |
|---|---|
| CZT HV Monitor | 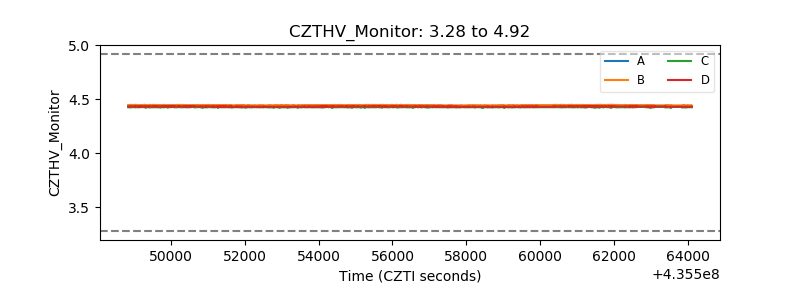 |
| D_VDD | 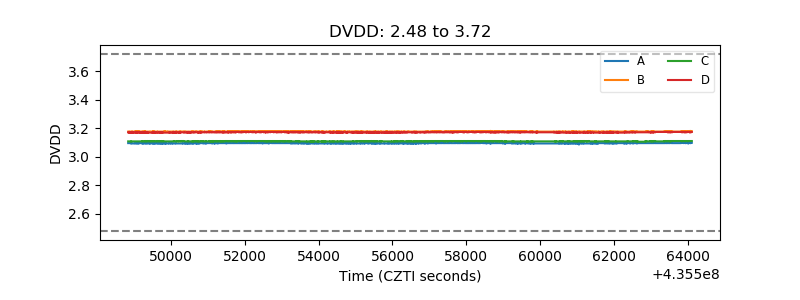 |
| Temperature 1 | 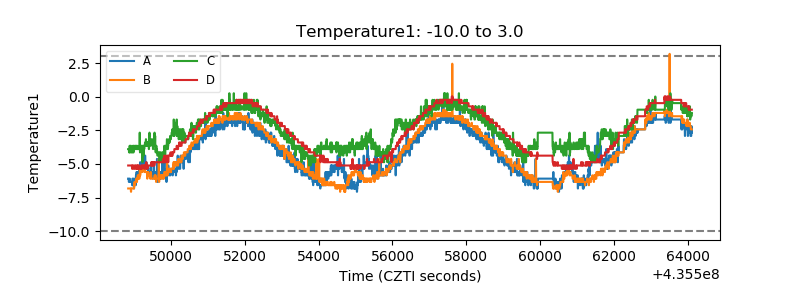 |
| Veto HV Monitor | 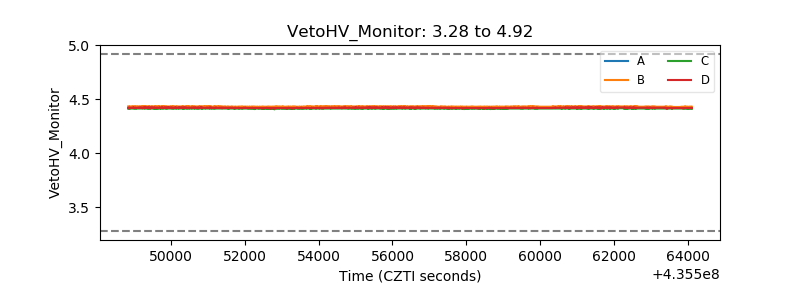 |
| Veto LLD | 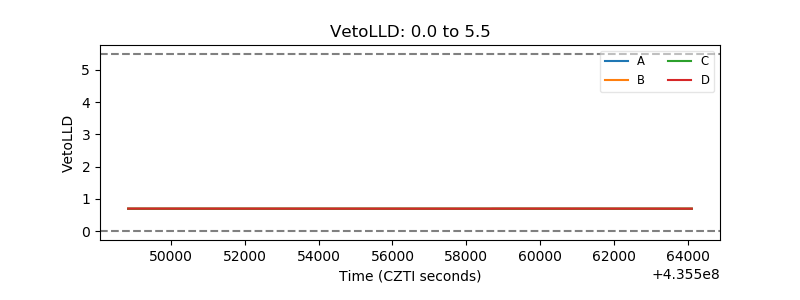 |
| Alpha Counter | 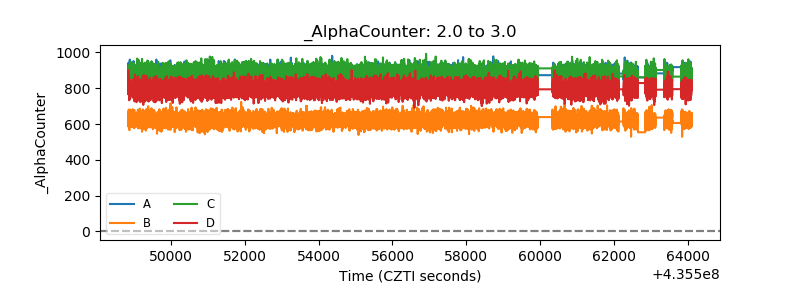 |
| _CPM_Rate | 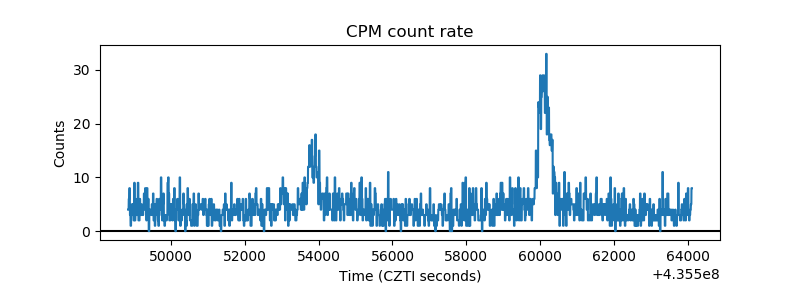 |
| CZT Counter | 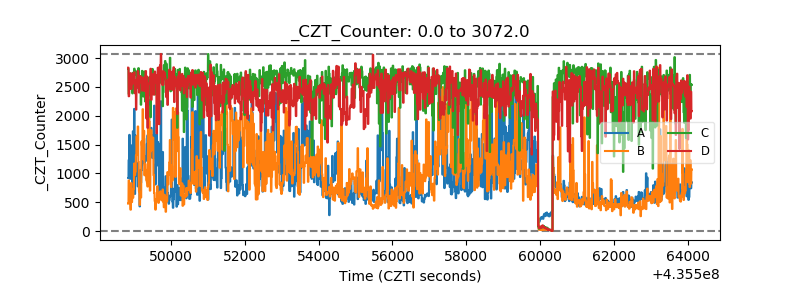 |
| +2.5 Volts monitor | 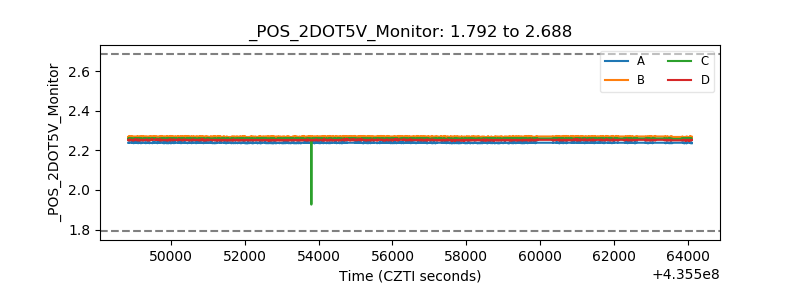 |
| +5 Volts monitor | 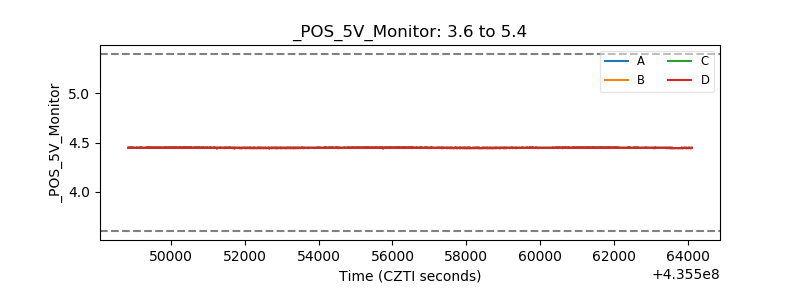 |
| _ROLL_ROT | 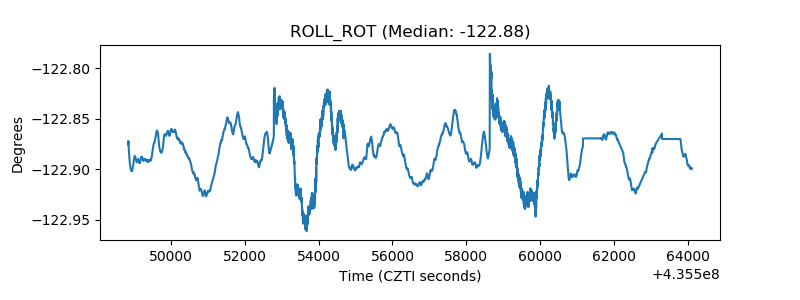 |
| _Roll_DEC | 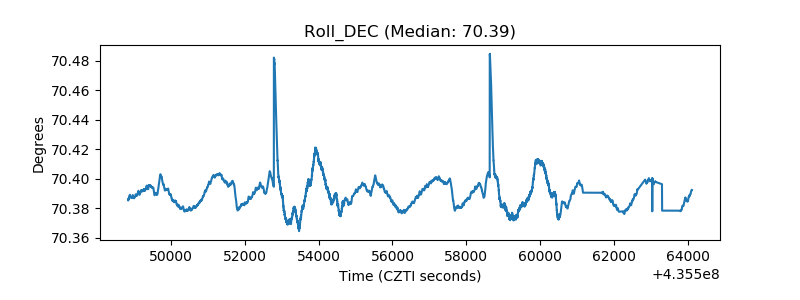 |
| _Roll_RA | 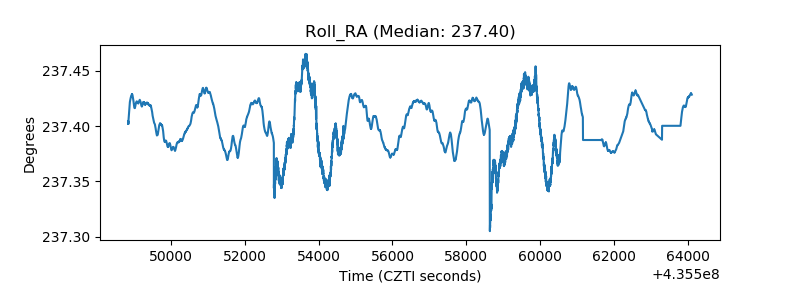 |
| Veto Counter | 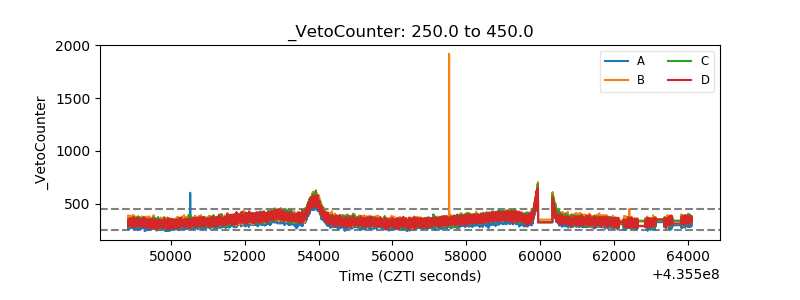 |