| Param | Original file | Final file |
|---|---|---|
| Filename | modeM0/AS1C07_001T10_9000005890_43600cztM0_level2.fits | modeM0/AS1C07_001T10_9000005890_43600cztM0_level2_quad_clean.evt |
| Size (bytes) | 1,191,801,600 | 68,031,360 |
| Size | 1.1 GB | 64.9 MB |
| Events in quadrant A | 4,868,138 | 676,842 |
| Events in quadrant B | 7,959,079 | 645,415 |
| Events in quadrant C | 16,048,142 | 209,417 |
| Events in quadrant D | 14,770,787 | 94,755 |
| Mode SS | |||
|---|---|---|---|
| Quadrant | BADHDUFLAG | Total packets | Discarded packets |
| A | 0 | 124 | 0 |
| B | 0 | 124 | 0 |
| C | 0 | 124 | 0 |
| D | 0 | 124 | 0 |
| Mode M9 | |||
|---|---|---|---|
| Quadrant | BADHDUFLAG | Total packets | Discarded packets |
| A | 0 | 9 | 0 |
| B | 0 | 9 | 0 |
| C | 0 | 9 | 0 |
| D | 0 | 9 | 0 |
| Mode M0 | |||
|---|---|---|---|
| Quadrant | BADHDUFLAG | Total packets | Discarded packets |
| A | 0 | 18926 | 2 |
| B | 0 | 27896 | 4 |
| C | 0 | 51792 | 1 |
| D | 0 | 48081 | 1 |
| Quadrant | Total seconds | Saturated seconds | Saturation percentage |
|---|---|---|---|
| A | 6113 | 314 | 5.136594% |
| B | 6113 | 1381 | 22.591199% |
| C | 6114 | 5943 | 97.203140% |
| D | 6114 | 6114 | 100.000000% |
Noise dominated data is calculated using 1-second bins in cleaned event files. If a bin has >2000 counts, and if more than 50% of those come from <1% of pixels, then it is considered to be noise-dominated and hence unusable.
| Quadrant | # 1 sec bins | Bins with >0 counts | Bins with >2000 counts | High rate bins dominated by noise | Noise dominated (total time) | Noise dominated (detector-on time) | Marked lightcurve |
|---|---|---|---|---|---|---|---|
| A | 7043 | 6113 | 165 | 165 | 2.34% | 2.70% | 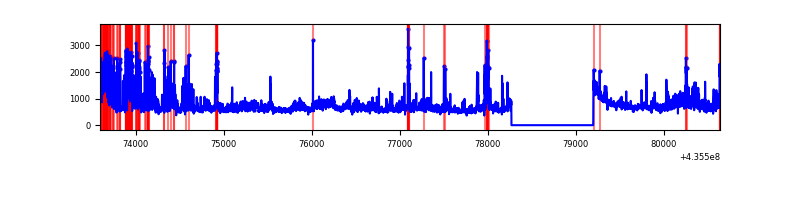 |
| B | 7043 | 6114 | 1028 | 1028 | 14.60% | 16.81% | 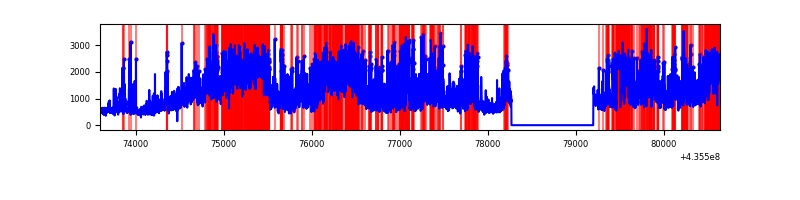 |
| C | 7043 | 6113 | 5834 | 5834 | 82.83% | 95.44% | 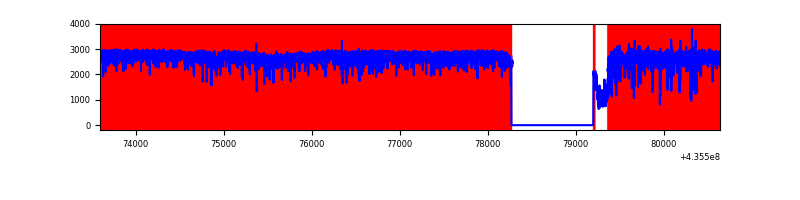 |
| D | 7043 | 6113 | 5424 | 5424 | 77.01% | 88.73% | 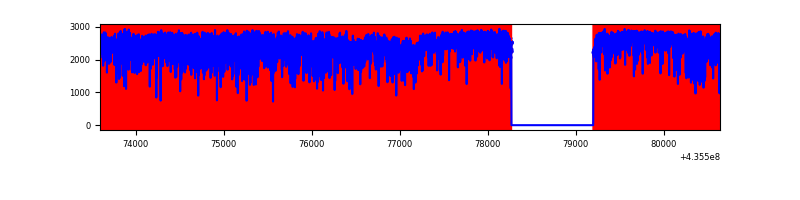 |
Top three noisy pixels from each quadrant. If the there are fewer than three noisy pixels in the level2.evt file, extra rows are filled as -1
| Pixel properties | Quadrant properties | ||||||
|---|---|---|---|---|---|---|---|
| Quadrant | DetID | PixID | Counts | Sigma | Mean | Median | Sigma |
| A | 10 | 83 | 749986 | 5432.11 | 674 | 660 | 137.9 |
| A | 15 | 223 | 620650 | 4494.51 | 674 | 660 | 137.9 |
| A | 12 | 189 | 405431 | 2934.32 | 674 | 660 | 137.9 |
| B | 4 | 206 | 2829126 | 23250.76 | 631 | 614 | 121.7 |
| B | 5 | 235 | 1231298 | 10116.39 | 631 | 614 | 121.7 |
| B | 0 | 219 | 439534 | 3607.98 | 631 | 614 | 121.7 |
| C | 15 | 142 | 7535253 | 143079.39 | 220 | 221 | 52.7 |
| C | 15 | 126 | 4434056 | 84192.13 | 220 | 221 | 52.7 |
| C | 15 | 174 | 2202954 | 41826.72 | 220 | 221 | 52.7 |
| D | 8 | 192 | 7902624 | 188516.91 | 119 | 114 | 41.9 |
| D | 4 | 212 | 2598443 | 61983.97 | 119 | 114 | 41.9 |
| D | 4 | 216 | 1290066 | 30772.22 | 119 | 114 | 41.9 |
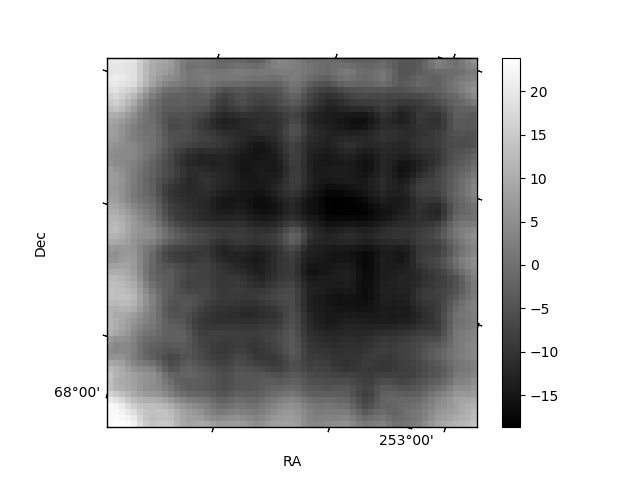
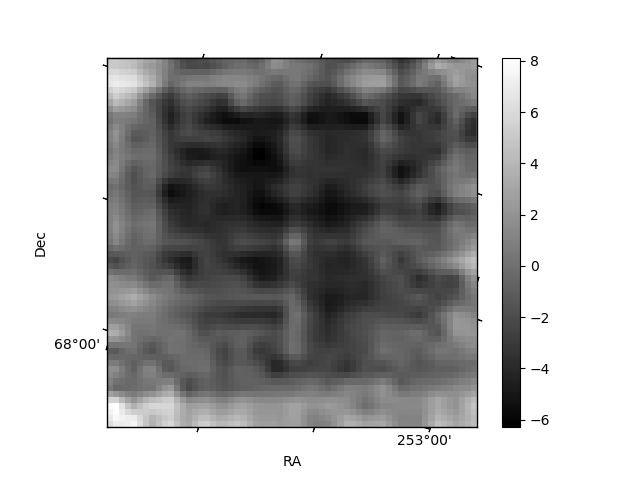
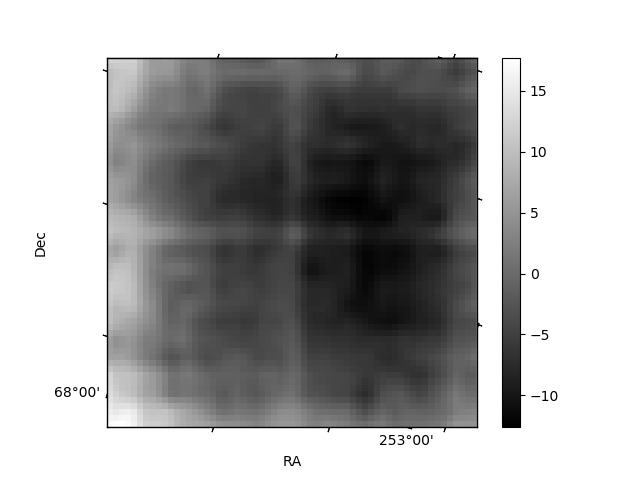
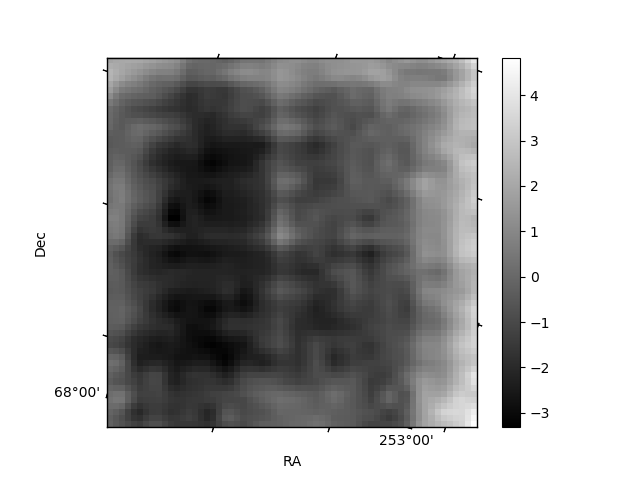
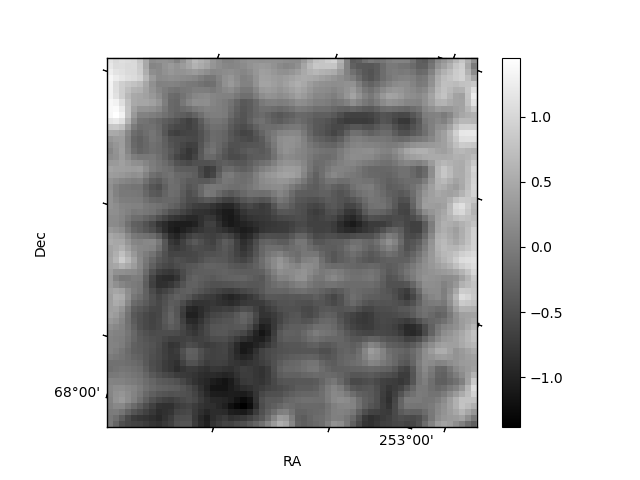
Histogram calculated using DETX and DETY for each event in the final _common_clean file
| Quadrant A | 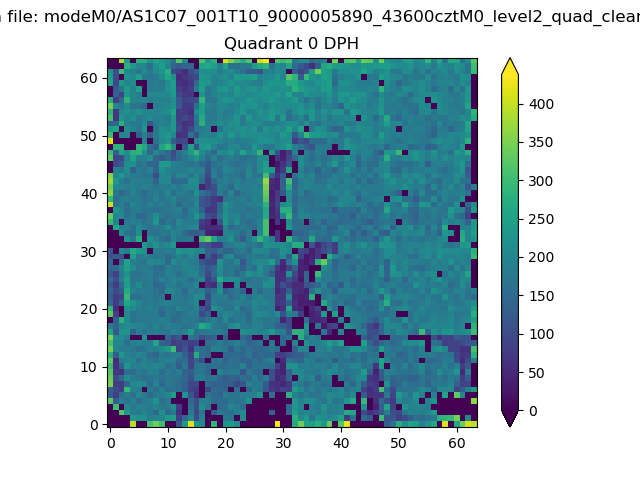 |
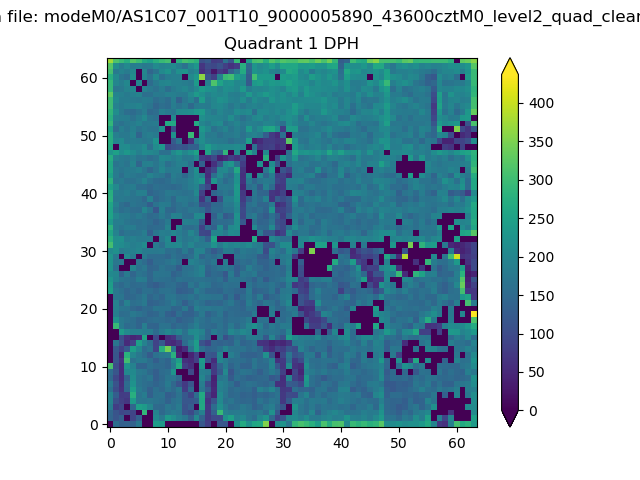 |
Quadrant B |
|---|---|---|---|
| Quadrant D | 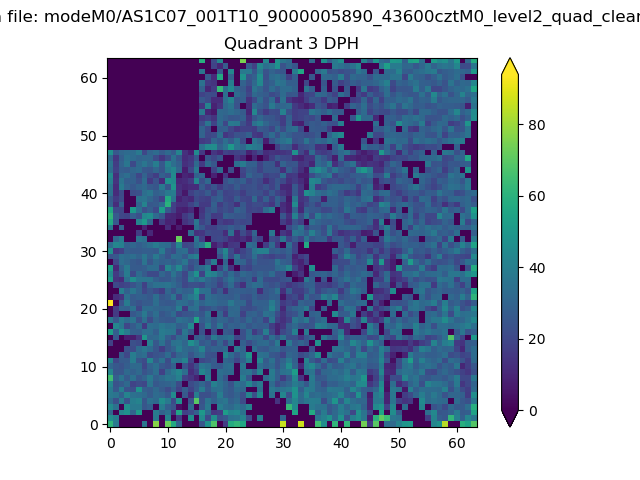 |
 |
Quadrant C |
| Plot type | Count rate plots | Images |
|---|---|---|
| Comparison with Poisson distribution Blue bars denote a histogram of data divided into 1 sec bins. Red curve is a Poisson curve with rate = median count rate of data. |
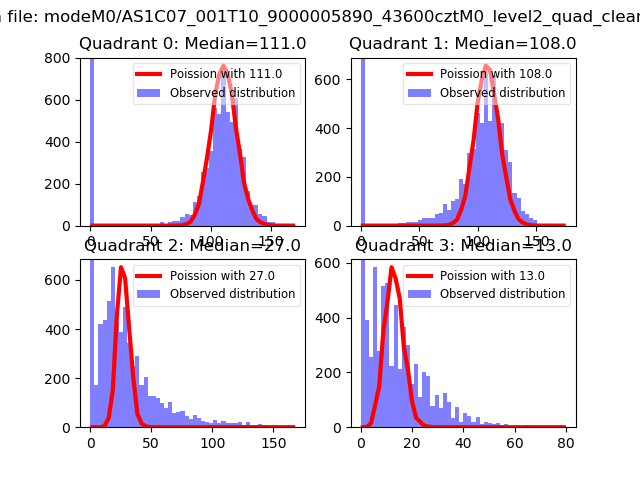 |
 |
| Quadrant-wise count rates Data is divided into 100 sec bins |
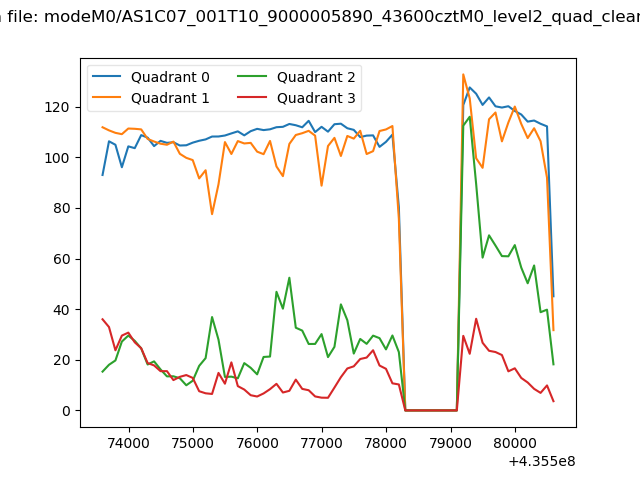 |
|
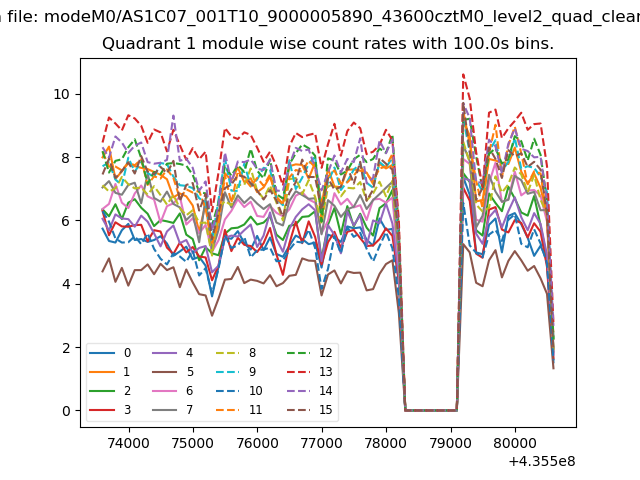
| Module-wise count rates for Quadrant A Data is divided into 100 sec bins |
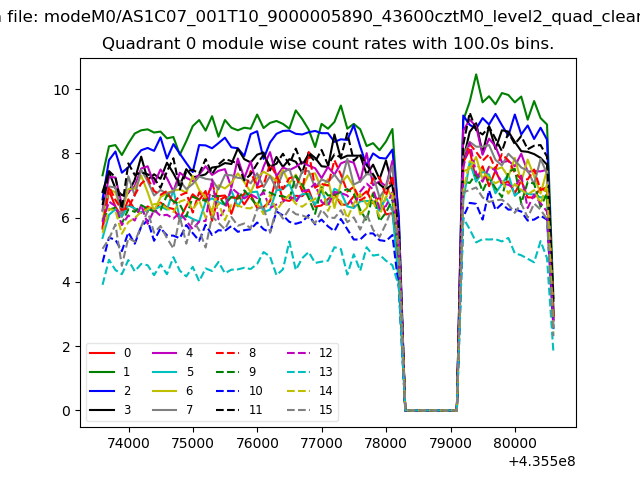 |
 |
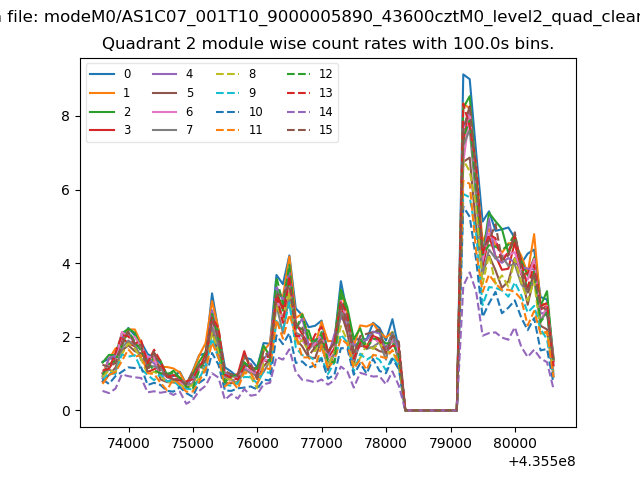
| Module-wise count rates for Quadrant B Data is divided into 100 sec bins |
 |
 |
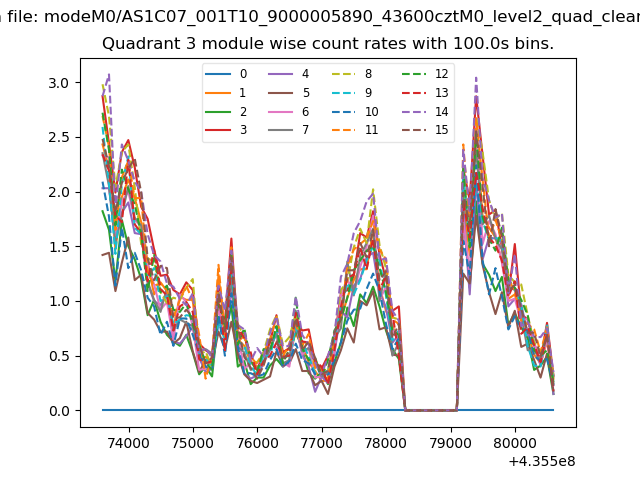
| Module-wise count rates for Quadrant C Data is divided into 100 sec bins |
 |
 |
| Module-wise count rates for Quadrant D Data is divided into 100 sec bins |
 |
 |
| Parameter | Plot |
|---|---|
| CZT HV Monitor | 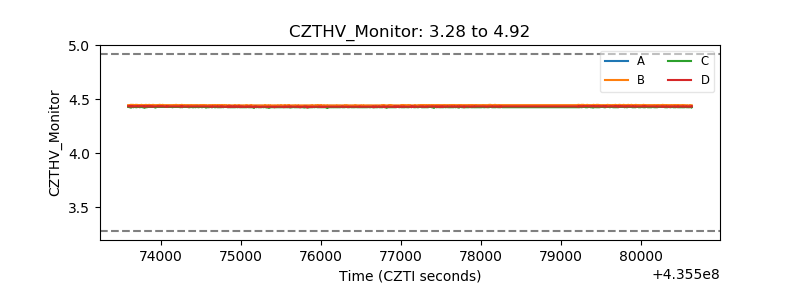 |
| D_VDD | 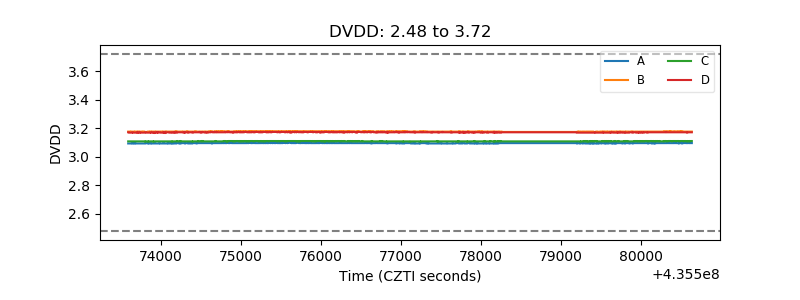 |
| Temperature 1 | 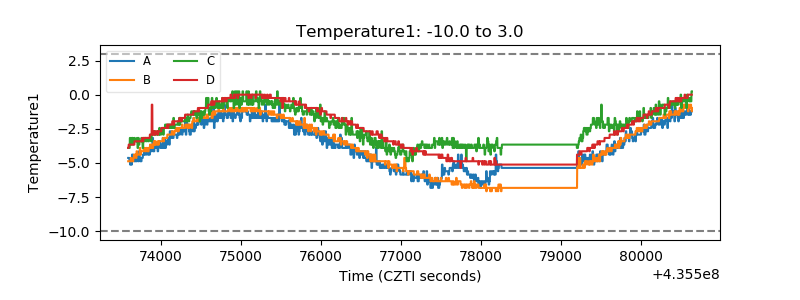 |
| Veto HV Monitor | 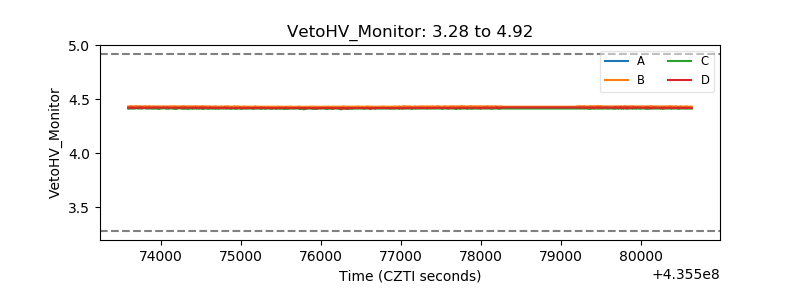 |
| Veto LLD | 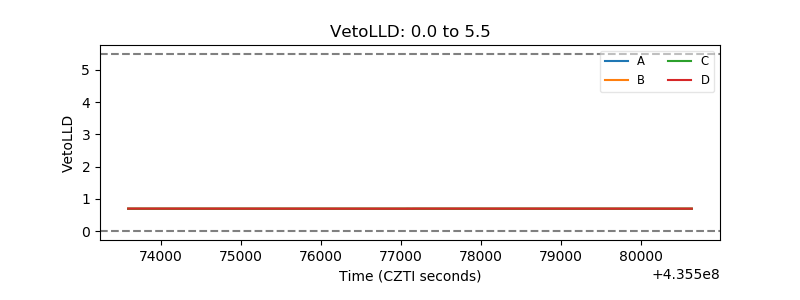 |
| Alpha Counter | 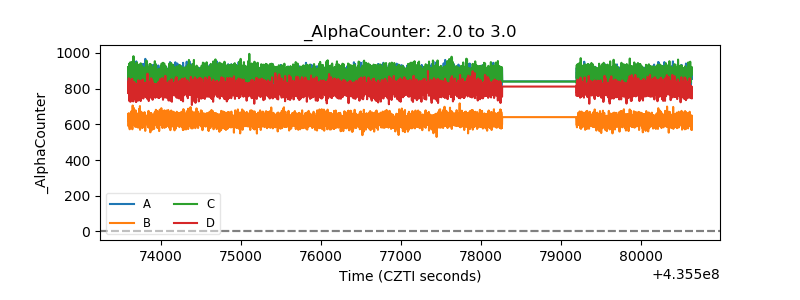 |
| _CPM_Rate | 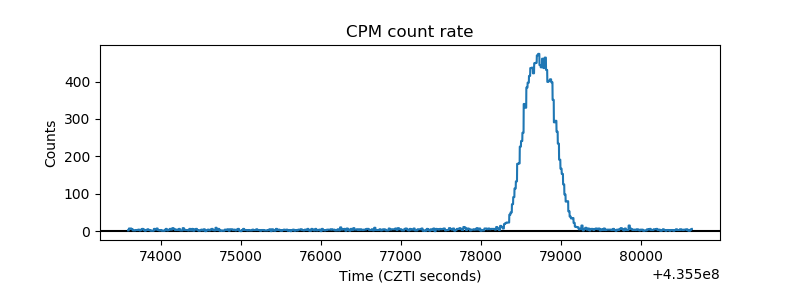 |
| CZT Counter | 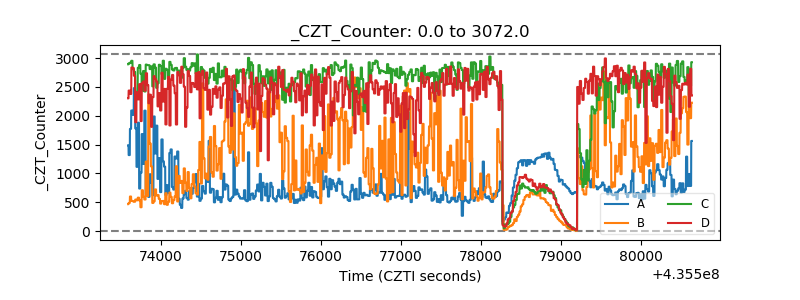 |
| +2.5 Volts monitor | 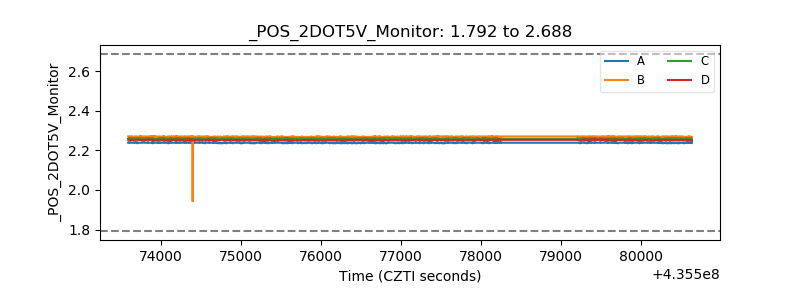 |
| +5 Volts monitor | 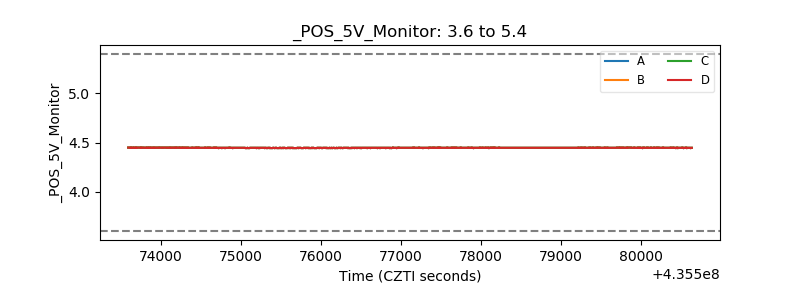 |
| _ROLL_ROT | 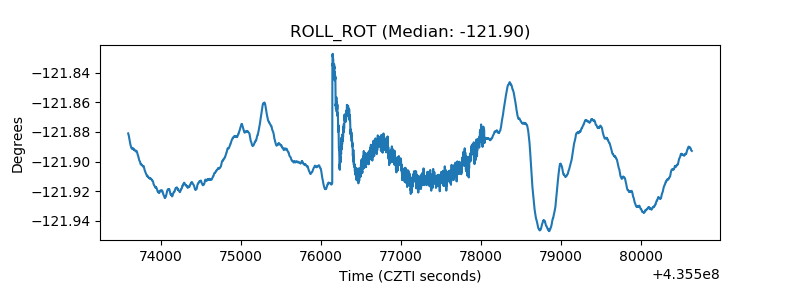 |
| _Roll_DEC | 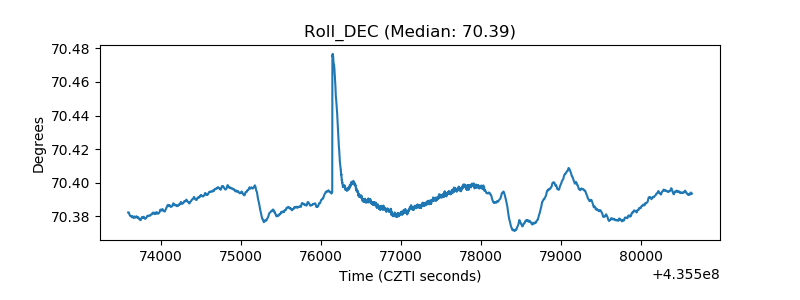 |
| _Roll_RA | 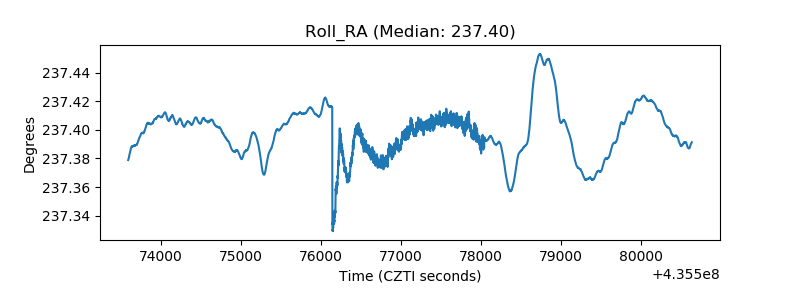 |
| Veto Counter | 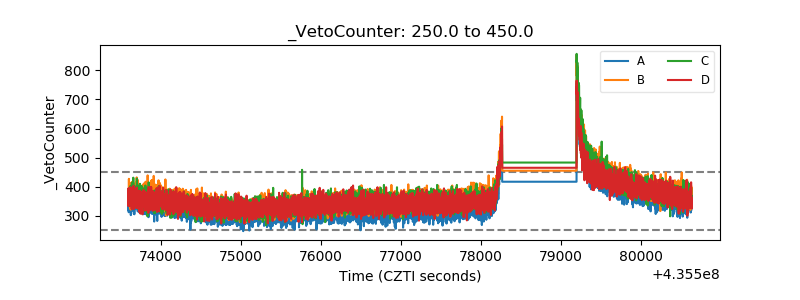 |